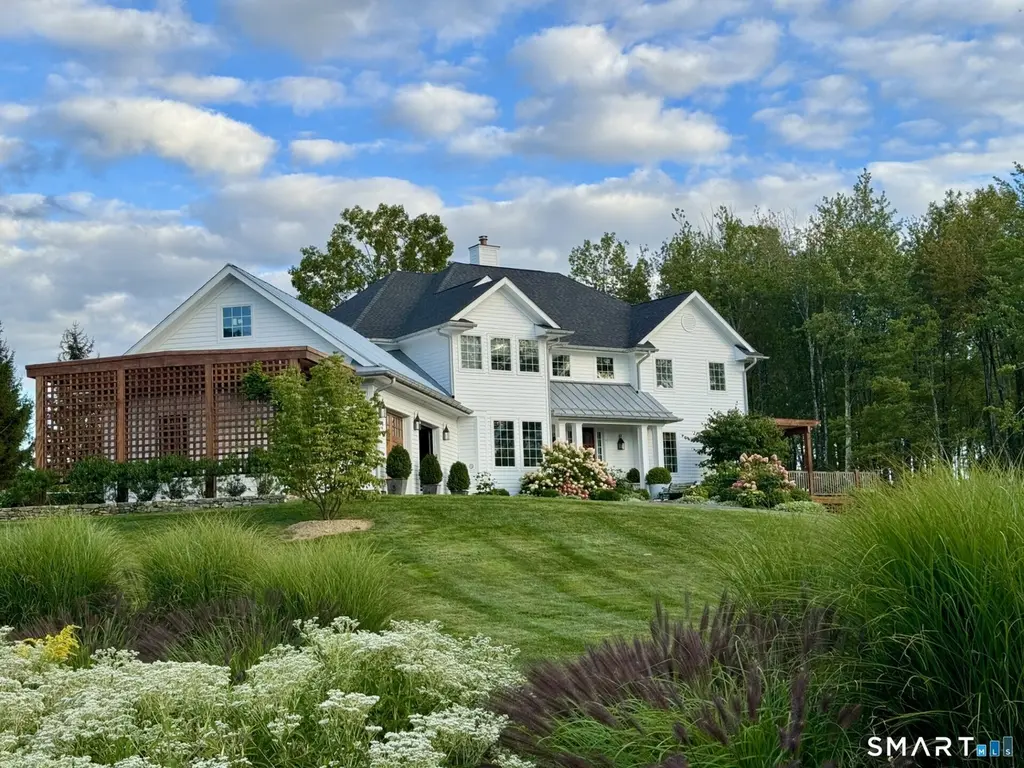
220 Painter Hill Rd · Bethlehem Village, CT
Flood risk 1/10 · Minimal
- FEMA flood zone
- X
- Chance of flooding over 30 yrs
- 0.0%
- Est. flood insurance / yr
- $473 – $860
Fire risk 4/10 · Minor
- Est. fire insurance / yr
- $829 – $1,539
Heat risk 3/10 · Minor
- Hot days now (above 95°F)
- 7 days/yr
- Hot days in 30 yrs
- 15 days/yr
Wind risk 5/10 · Moderate
- Chance of severe wind over 30 yrs
- 25.0%
Air-quality risk 3/10 · Minor
- Unhealthy air days now
- 2 days/yr
- Unhealthy air days in 30 yrs
- 3 days/yr
Risk factors via First Street. Map © Google.
Why this score? — see what drove the D grade
The composite is a weighted blend of 9 inputs, each scored 0–100. Each bar is that input's sub-score; the figure is the points it added to the 100-point composite (weight × sub-score).
- Cash flow +12.9/30.0
- ARV discount +8.5/15.0
- Schools +6.3/10.0
- DSCR +3.9/10.0
- Livability +3.4/5.0
- Rent growth +2.5/5.0
- Condition / age +2.5/5.0
- 1% rule +2.4/10.0
- Appreciation +0.0/10.0
$2,895,000
🖨 Deal sheet 📄 Offer letter ✓ Due diligence
Listing remarks MLS
Perched atop Painter Hill-Roxbury's highest elevation and one of its most coveted addresses-this newly renovated residence offers breathtaking, year-round Sunrise and Sunset views. Spanning over 4,500 sq ft, featuring 4-5 bedrooms and is thoughtfully designed for both comfort and entertaining, complete with a three-story elevator & dedicated game/media room. The chef's kitchen is a showpiece, appointed with premium appliances, a walk-in pantry, oversized island, and stylish bar. It opens seamlessly to a spacious screened porch with inviting dining and lounge areas. Outdoor living is elevated by an expansive ipe deck that functions as a true open-air great room-ideal for al fresco gatherings. The dining room extends to a charming sunset porch adorned with a pergola and irrigated herb garden. The grounds are equally impressive, with professionally designed landscaping that includes an apple orchard, restored stone walls, and a picturesque pond with cascading waterfall. A striking custom pool features a lap lane, lounging platform, and firepit with integrated stone seating, creating a private resort-like setting. Addl highlights include a 3,000-bottle wine cellar, heated garage, pergola-covered carport, and a newly finished oil-and-stone driveway. Ideally located just minutes from the chic shops & fine dining of Washington and Woodbury. Nearby land trust trails offer plentiful hiking. This turnkey property offers easy access to the very best of Litchfield County! Agent Owner.
Key facts
- Three story elevator
- Walk in pantry
- Oversized island
Tags
Neighborhood map
What this means for you Summary
Snapshot
- This is a 4-bed/4.5-bath single-family listed at $2.90M.
Deal economics
- At list price, monthly cash flow is $-196 ($-2k/yr) — negative.
- To cash-flow at today's rent, offer at most $2.86M (1.2% below list).
- To meet the 1% rule (rent ≥ 1% of price), the offer needs to be $2.15M (25.6% below list).
- Recommended offer: $2.15M (25.6% below list) — sets the bar for 1% rule.
Location & tenants
- Location reads 68/100 on livability (#107 in CT) — a middle-class / working-renter tenant base. Strengths: crime A+, employment A+, housing A+; Watch: amenities F, commute F, cost of living F.
- Regional School District 12 (rural): math 64% / reading 77% proficiency, ranked #20 of 153 in CT (top 13%) — strong family-tenant draw, lease renewals of 3-5y typical; only 8% free/reduced lunch — higher-income household profile.
- Market conditions: 48 active listings in the ZIP; 2 comparable units currently listed for rent nearby; 154 units permitted in Northwest Hills Planning Region in 2024 (6 in 5+ unit buildings).
Forward outlook
- Local home prices are declining (-3.0%/yr); year-one equity from $20k of loan paydown is wiped out by about $87k of value loss. Plan a longer hold.
Negotiation context
- It's been on market 65 days — a 6% lower offer ($2.72M) is reasonable based on typical stale-listing flexibility.
- 5 sale attempts since 8y ago with the ask held roughly flat each time — persistent listings suggest the price (not the market) is what's stuck; bring a comps-based counter.
- Current owner paid $700k; list at $2.90M implies a 314% gain — meaningful room to come down on a strong offer.
Risks & watch-outs
- Climate carrying-cost: moderate wind risk, 25% chance of damaging wind over 30y — expect insurance premiums to compound above CPI over the hold.
Questions for the listing agent
- What do current leases actually rent for vs. the listed asking? Can we see a recent rent roll and the last 12 months of T-12 income?
- It's been on market 65 days. Have you received any prior offers? Is the seller open to a 26% concession, seller financing, or rate buy-down credit?
- Why hasn't it sold? Are there any deal-killer items the seller is aware of (foundation, flood, title, zoning, code violations)?
- Is there a deadline driving the sale (1031 exchange, divorce, estate, relocation)? That informs how much negotiation room exists.
- Schools are B-rated — typically a magnet for longer-tenancy family renters. What's the average tenant stay here, and is there a school-zone premium baked into asking?
- The area grade is low — what's the realistic commute time and amenity access for the typical tenant pool here? Any planned neighborhood developments (good or bad) we should know about?
- What's the average days-on-market for RENTAL listings here right now (not sales)? A rising rental-DOM trend means longer vacancies and softer asking-rent achievability than the comps imply.
- What's the recent tenant-quality profile in this submarket — average credit score on applications, eviction rate, late-payment / NSF rate, and stable-employment percentage? A property-management company in the area should have these aggregated.
- How much new for-sale + rental construction is in the pipeline within 1–3 miles? Heavy new supply typically softens prices + rents 12–24 months out; constrained supply supports both.
Investment metrics
- 1% rule
- 0.74% ✗
- Cap rate
- 6.21%
- Cash-on-cash
- -0.29%
- DSCR
- 0.99
- GRM
- 11.2
CMA / ARV
- ARV (median comp)
- $2,957,942
- List price
- $2,895,000
- Delta
- -2.13%
- Verdict
- FAIR
- Comps
- 4 within 1.0 mi
Projected returns pro-forma
-3.0% appreciation · 3.0% rent growth · sell at horizon
- IRR
- -16.8%
- Equity multiple
- 0.40×
- Total profit
- $-482,988
- Equity at exit
- $431,654
- IRR
- -8.8%
- Equity multiple
- 0.45×
- Total profit
- $-442,308
- Equity at exit
- $250,307
Cash invested: $810,600 (down + closing). Projections, not guarantees.
Landlord ↔ Tenant lean methodology
- Overall (STATE)
- 27 Tenant-Leaning
- State Connecticut
- 27 Tenant-Leaning · D+7
- County
- — inherits STATE
- City
- — inherits STATE
ZIP-level market 06783
- Home prices YoY
- -24.7%
- Active inventory
- 48
- Price-to-rent
- 11.2×
Monthly cashflow live
- Estimated rent
- $21,538 medium interval (Pro) →
- Mortgage (P&I)
- −$15,182
- Tax from tax record
- −$823 /mo · $9,872/yr
- Insurance
- −$1,206
- HOA
- −$0
- Vacancy / Maint / Mgmt
- −$4,523
- Net cashflow
- $-196
Break-even live
UW: 25.0% down · 7.5% · 30yr · 1.5% tax · 5.0% vac · 8.0% maint · 8.0% mgmt
Financing live
Cash to close
- Down payment
- $723,750
- Closing costs
- $86,850
- Reserves months
- —
- Total cash needed
- —
Loan-product check · same deal, 3 products live
Conventional
25% down · 7.5% · 30yr
- Down + closing
- —
- Monthly P&I
- —
- Monthly cashflow
- —
- DSCR
- —
- Eligible?
- —
Personal DTI + credit; lowest rate.
DSCR
20% down · 8.5% · 30yr
- Down + closing
- —
- Monthly P&I
- —
- Monthly cashflow
- —
- DSCR
- —
- Eligible?
- —
No personal income docs; deal must DSCR.
Hard money
10% down · 12.0% · 12mo
- Down + closing
- —
- Monthly P&I
- —
- Monthly cashflow
- —
- DSCR
- —
- Eligible?
- —
Short-term bridge; refi at stabilization.
Rent comps 2 comps
| Address | Beds | Baths | Sqft | Rent | $/sqft | DOM | Units | Dist |
|---|---|---|---|---|---|---|---|---|
| 45 Moosehorn Rd Roxbury, CT | 3.0 | 3.5 | 4251 | $30,900 | $7.27 | 43d | 1 | 0.60mi |
| 18 Bear Burrow Rd Roxbury, CT | 4.0 | 2.5 | 3026 | $7,500 | $2.48 | 43d | 1 | 0.78mi |
Listing history 32 events
-
2026-06-19days on market $2,895,000 Active 65 DOM
-
2026-06-18days on market $2,895,000 Active 64 DOM
-
2026-06-17days on market $2,895,000 Active 63 DOM
-
2026-06-16days on market $2,895,000 Active 62 DOM
-
2026-06-15days on market $2,895,000 Active 61 DOM
-
2026-06-14days on market $2,895,000 Active 59 DOM
-
2026-06-13days on market $2,895,000 Active 58 DOM
-
2026-06-10days on market $2,895,000 Active 56 DOM
-
2026-06-09days on market $2,895,000 Active 55 DOM
-
2026-06-08days on market $2,895,000 Active 54 DOM
-
2026-06-07days on market $2,895,000 Active 53 DOM
-
2026-06-05days on market $2,895,000 Active 50 DOM
-
2026-06-03days on market $2,895,000 Active 49 DOM
-
2026-06-02days on market $2,895,000 Active 48 DOM
-
2026-06-01days on market $2,895,000 Active 47 DOM
-
2026-05-31days on market $2,895,000 Active 46 DOM
-
2026-05-30days on market $2,895,000 Active 45 DOM
-
2026-04-15$2,895,000 Active 1505-char remark
Show marketing remark (1505 chars)
Perched atop Painter Hill-Roxbury's highest elevation and one of its most coveted addresses-this newly renovated residence offers breathtaking, year-round Sunrise and Sunset views. Spanning over 4,500 sq ft, featuring 4-5 bedrooms and is thoughtfully designed for both comfort and entertaining, complete with a three-story elevator & dedicated game/media room. The chef's kitchen is a showpiece, appointed with premium appliances, a walk-in pantry, oversized island, and stylish bar. It opens seamlessly to a spacious screened porch with inviting dining and lounge areas. Outdoor living is elevated by an expansive ipe deck that functions as a true open-air great room-ideal for al fresco gatherings. The dining room extends to a charming sunset porch adorned with a pergola and irrigated herb garden. The grounds are equally impressive, with professionally designed landscaping that includes an apple orchard, restored stone walls, and a picturesque pond with cascading waterfall. A striking custom pool features a lap lane, lounging platform, and firepit with integrated stone seating, creating a private resort-like setting. Addl highlights include a 3,000-bottle wine cellar, heated garage, pergola-covered carport, and a newly finished oil-and-stone driveway. Ideally located just minutes from the chic shops & fine dining of Washington and Woodbury. Nearby land trust trails offer plentiful hiking. This turnkey property offers easy access to the very best of Litchfield County! Agent Owner.
-
2023-06-16historical
-
2023-05-28price $2,695,000
-
2023-04-26$2,795,000 Active
-
2021-05-20soldstatus $700,000
-
2020-09-01soldstatus $650,000
-
2020-08-28soldstatus $650,000 Closed
-
2020-06-03historical Under Contract - Continue to Show
-
2020-05-18status Active
-
2020-05-13historical
-
2020-03-05price $685,000
-
2020-03-05status Active
-
2019-03-26historical
-
2019-02-06price $795,000
-
2018-06-20$875,000 Active
ⓘ Source: listings_history table (triggers on properties + properties_extension) + one-shot
backfill from property_details.listing_events for pre-trigger history.
Tax reassessment forecast CT · Partial reset (capped growth)
- Current annual tax
- $9,872 · $823/mo
- Projected year-2 tax
- $35,912 · $2,993/mo
- Expected delta
- +$26,040/yr (+$2,170/mo · 263.8%)
ⓘ Screening estimate from a state-policy table — verify with the county assessor before closing.
Climate risk First Street
- Flood 1/10 Low FEMA zone X · 0% chance over 30 yrs
- Wildfire 4/10 Moderate
- Heat 3/10 Moderate 7 d/yr ≥95°F today · 15 d/yr by 30 yrs out
- Wind 5/10 Major 25% chance of damaging wind over 30 yrs
- Air quality 3/10 Moderate 2 unhealthy d/yr today · 3 by 30 yrs out
Nearby sold comps map
Loading sold comps map…
Walkable amenities ~0.75 mi
Loading nearby amenities…
Taxation est. · year 1
- Rental income
- $258,450
- − Mortgage interest
- −$162,165
- − Property taxes
- −$9,872
- − Insurance
- −$14,475
- − Repairs & maintenance
- −$20,676
- − Management
- −$20,676
- − Depreciation
- −$84,218
- Taxable loss
- −$53,632
- Est. tax savings @ 24.0%
- +$12,872
- After-tax cash flow
- $10,520/yr
For passive investors: Depreciation is non-cash, so a rental often shows a tax loss while cash-flowing — sheltering income. Rental losses are passive: they offset passive income freely, and up to $25,000/yr can offset ordinary (W-2) income if you actively participate and your MAGI is under $100k (phasing out to $0 by $150k); unused losses carry forward. On sale, claimed depreciation is recaptured at up to 25%, and gains may owe capital-gains tax (a 1031 exchange can defer both). Figures are a year-1 estimate at your 24.0% rate — not tax advice; consult a CPA.
Schools (NCES district)
- District
- Regional School District 12
- NCES district ID
- 0903530
- Math proficiency
- 64% ▼ -9.00%
- Reading proficiency
- 77% ▬ 0.00%
- Median HH income
- $86,065
- Composite
- 63.18/100
- National rank
- #638
- State rank
- #20 of 153 in CT
Livability — Bethlehem Village
- Score
- 68/100
- State rank
- #107
- US rank
- #9178
Category grades
Schools grade is shown separately in the Schools card above.
Census & demographics
- City population
- 3,398
- Population (ZIP)
- 2,184
Population outlook (Northwest Hills County) Hauer SSP2
- By 2040
- 118,998
Race, ethnicity, and origin ACS 2023
- Neighborhood character
- Predominantly White (84%)
- Race & ethnicity
- White 84% Black 7% Hispanic / Latino 5% Two or more races 3% Asian 3%
- Common ancestry
- Slovak 8% Romanian 7% Hispanic 5%
- Foreign-born
- 14% · Canada
- Languages at home
- 82% English-only · French/Haitian/Cajun 6% Other Indo-European 4% Spanish 3%
Political lean MEDSL · Northwest Hills
- 2024 margin
- Toss-up / Even · D 48.6% · R 49.9% · Other 1.6%
- All cycles
- 2024: R+1.3
Not yet ingested
- Civics
- —
Market trends
- HPI YoY
- ▼ -55.80%
- Current HPI
- 170.3789
- Rent YoY
- —
- Metro
- —
- State GDP YoY
- ▲ 1.06%
- F500 in state
- 38
Industry mix (Fortune 500 HQ in CT)
| Industry | F500 HQs | Revenue |
|---|---|---|
| Industrial Machinery | 4 | $38B |
|
||
| Insurance | 3 | $71B |
|
||
| Financial Services | 2 | $25B |
|
||
| Transportation / Logistics | 2 | $18B |
|
||
| Healthcare | 1 | $247B |
|
||
| Telecommunications | 1 | $55B |
|
||
Price history
+230.9% since first listed15 events — show timeline
- 2026-04-15 Listed $2,895,000 Smart MLS
- 2023-06-16 Listing Removed — Smart MLS
- 2023-05-28 Price Changed $2,695,000 Smart MLS
- 2023-04-26 Listed $2,795,000 Smart MLS
- 2021-05-20 Sold (Public Records) $700,000 Public Records
- 2020-09-01 Sold (Public Records) $650,000 Public Records
- 2020-08-28 Sold (MLS) $650,000 Smart MLS
- 2020-06-03 Contingent — Smart MLS
- 2020-05-18 Relisted — Smart MLS
- 2020-05-13 Listing Removed — Smart MLS
- 2020-03-05 Price Changed $685,000 Smart MLS
- 2020-03-05 Relisted — Smart MLS
- 2019-03-26 Listing Removed — Smart MLS
- 2019-02-06 Price Changed $795,000 Smart MLS
- 2018-06-20 Listed $875,000 Smart MLS
Property tax history
-1.9%/yrLatest (2023): $9,872 · +14.8% YoY. Source: county tax records.
Cash-flow waterfall
monthlySold comps — $/sqft
last 12 mo · ≤1 miLoading sold comps…