492 Algene St · Orion, MI
Flood risk 1/10 · Minimal
- FEMA flood zone
- X (unshaded)
- Chance of flooding over 30 yrs
- 0.0%
- Est. flood insurance / yr
- $473 – $860
Fire risk 1/10 · Minimal
- Est. fire insurance / yr
- $784 – $1,456
Heat risk 2/10 · Minimal
- Hot days now (above 97°F)
- 7 days/yr
- Hot days in 30 yrs
- 15 days/yr
Wind risk 2/10 · Minimal
- Chance of severe wind over 30 yrs
- —
Air-quality risk 3/10 · Minor
- Unhealthy air days now
- 2 days/yr
- Unhealthy air days in 30 yrs
- 4 days/yr
Risk factors via First Street. Map © Google.
Why this score? — see what drove the F grade
The composite is a weighted blend of 9 inputs, each scored 0–100. Each bar is that input's sub-score; the figure is the points it added to the 100-point composite (weight × sub-score).
- Cash flow +12.3/30.0
- Schools +5.1/10.0
- DSCR +3.6/10.0
- 1% rule +3.0/10.0
- Rent growth +2.5/5.0
- Livability +2.5/5.0
- Condition / age +2.5/5.0
- ARV discount +0.0/15.0
- Appreciation +0.0/10.0
$338,000
🖨 Deal sheet 📄 Offer letter ✓ Due diligence
Listing remarks MLS
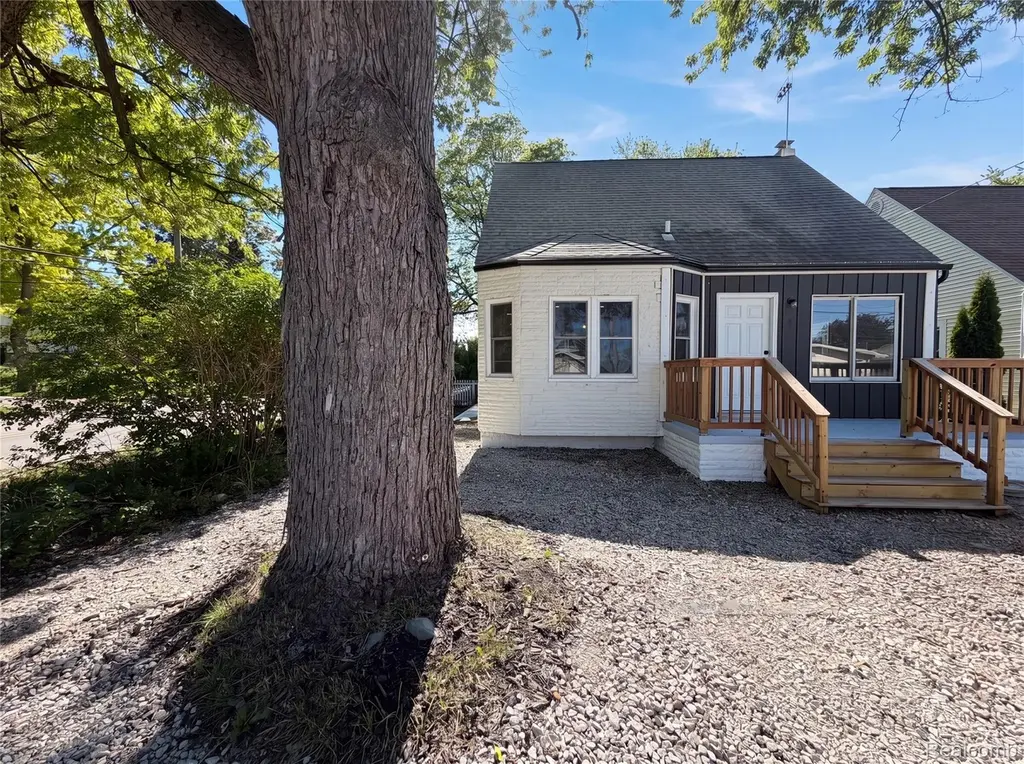
Imagine 492 Algene St, a residence designed for everyday practicality and comfort, with thoughtful enhancements throughout. The kitchen features an accent backsplash and contains all stainless steel appliances, providing a streamlined culinary environment. An exterior patio extends to a fully fenced in backyard, providing functional outdoor space. Experience a blend of modern style and functional living. Buyer/agent advised to verify homestead vs non homestead tax status with a tax professional. Included 100-Day Home Warranty with buyer activation
Key facts
- Exterior patio
- Accent backsplash
- 8,712 sq ft lot
Tags
Property features AI
Exterior
- Parking: Detached 2-car garage
- Utilities: Public water; Public sewer
- Home design: Single family residence; Two levels; Ground-level entry with steps
- Construction: Aluminum and vinyl siding; Block foundation; Built with conventional residential construction
- Exterior features: Patio; Paved road access; Pets allowed
Interior
- Bathrooms: 2 full bathrooms
- Heating & cooling: Forced air heating (natural gas); No central air cooling
- Interior features: Unfinished basement; Total of 5 rooms
Neighborhood map
What this means for you Summary
Snapshot
- This is a 3-bed/1.0-bath single-family listed at $338k.
Deal economics
- At list price, monthly cash flow is $-63 ($-762/yr) — negative.
- To cash-flow at today's rent, offer at most $327k (3.3% below list).
- To meet the 1% rule (rent ≥ 1% of price), the offer needs to be $270k (20.3% below list).
- Recommended offer: $270k (20.3% below list) — sets the bar for 1% rule.
Location & tenants
- Location reads: area grade F — affects rentability + tenant quality, not the cash-flow math above.
- Lake Orion Community Schools (suburban): math 49% / reading 64% proficiency, ranked #45 of 540 in MI (top 8%) — acceptable for families but not a draw, mixed tenant base, ~2y average lease; only 16% free/reduced lunch — higher-income household profile.
- Market conditions: 88 active listings in the ZIP; 5 comparable units currently listed for rent nearby; rentals at typical pace (median 15d on market — plan ~3-4 weeks tenant-placement turnaround); 2,614 units permitted in Oakland County in 2024 (721 in 5+ unit buildings).
Forward outlook
- Local home prices are declining (-3.0%/yr); year-one equity from $2k of loan paydown is wiped out by about $10k of value loss. Plan a longer hold.
- Oakland County population projected at +10% by 2050 — modest demand growth; plan on rents tracking national, not racing it.
Negotiation context
- Only 13 days on market — expect competitive offers; lowballing is unlikely to land.
- 11 sale attempts since 27y ago with the ask held roughly flat each time — persistent listings suggest the price (not the market) is what's stuck; bring a comps-based counter.
Risks & watch-outs
- Watch-outs: built in 1950 — expect roof / HVAC / electrical / plumbing capex.
Questions for the listing agent
- What do current leases actually rent for vs. the listed asking? Can we see a recent rent roll and the last 12 months of T-12 income?
- Built in 1950 — when were the roof, HVAC, electrical panel, plumbing, and water heater last replaced?
- Is there a deadline driving the sale (1031 exchange, divorce, estate, relocation)? That informs how much negotiation room exists.
- The area grade is low — what's the realistic commute time and amenity access for the typical tenant pool here? Any planned neighborhood developments (good or bad) we should know about?
- What's the average days-on-market for RENTAL listings here right now (not sales)? A rising rental-DOM trend means longer vacancies and softer asking-rent achievability than the comps imply.
- What's the recent tenant-quality profile in this submarket — average credit score on applications, eviction rate, late-payment / NSF rate, and stable-employment percentage? A property-management company in the area should have these aggregated.
- How much new for-sale + rental construction is in the pipeline within 1–3 miles? Heavy new supply typically softens prices + rents 12–24 months out; constrained supply supports both.
Investment metrics
- 1% rule
- 0.80% ✗
- Cap rate
- 6.07%
- Cash-on-cash
- -0.81%
- DSCR
- 0.96
- GRM
- 10.5
CMA / ARV
- ARV (on-the-fly)
- $243,695
- Comps found
- 12
Show comp detail 12 sales within ~0.75 mi
| Address | Dist | Beds/Ba | Sqft | Sold | Price | $/sf | Match |
|---|---|---|---|---|---|---|---|
| 74 Odanah St | 0.22mi | 3/1.5 | 1,109 (+7%) | 1mo | $244,000 | $220 | 75 |
| 481 Heights Rd | 0.32mi | 2/1.0 (-1) | 1,081 (+4%) | 7mo | $325,000 | $301 | 67 |
| 853 Merritt Ave | 0.58mi | 3/1.0 | 1,025 (-1%) | 6mo | $227,500 | $222 | 66 |
| 893 Sherry Dr | 0.50mi | 3/1.5 | 1,105 (+7%) | 1mo | $302,000 | $273 | 63 |
| 30 Beebe St | 0.64mi | 2/1.0 (-1) | 1,008 (-3%) | 10mo | $265,000 | $263 | 52 |
| 160 Parkview Blvd | 0.67mi | 2/1.0 (-1) | 1,104 (+6%) | 7mo | $259,000 | $235 | 47 |
| 305 Goldengate St | 0.57mi | 3/1.0 | 1,172 (+13%) | 7mo | $250,000 | $213 | 46 |
| 332 Newton Dr | 0.60mi | 3/1.0 | 906 (-13%) | 7mo | $220,000 | $243 | 46 |
| 40 Smith Ct | 0.32mi | 2/1.0 (-1) | 926 (-11%) | 21mo | $200,000 | $216 | 45 |
| 417 Glenn Ct | 0.71mi | 3/1.0 | 1,067 (+3%) | 23mo | $250,000 | $234 | 43 |
| 126 N North Shore Dr | 0.73mi | 3/1.5 | 1,170 (+13%) | 4mo | $230,000 | $197 | 40 |
| 630 Longpointe Dr | 0.69mi | 2/1.0 (-1) | 884 (-15%) | 20mo | $285,000 | $322 | 21 |
Match score weights: distance 35% · size 25% · config 20% · recency 20%. Top-matched comps best support the ARV.
Projected returns pro-forma
-3.0% appreciation · 3.0% rent growth · sell at horizon
- IRR
- -17.6%
- Equity multiple
- 0.38×
- Total profit
- $-58,861
- Equity at exit
- $50,397
- IRR
- -9.8%
- Equity multiple
- 0.40×
- Total profit
- $-56,654
- Equity at exit
- $29,224
Cash invested: $94,640 (down + closing). Projections, not guarantees.
Landlord ↔ Tenant lean methodology
- Overall (STATE)
- 62 Landlord-Friendly
- State Michigan
- 62 Landlord-Friendly · EVEN
- County
- — inherits STATE
- City
- — inherits STATE
ZIP-level market 48362
- Active inventory
- 88
- Price-to-rent
- 10.5×
Monthly cashflow live
- Estimated rent
- $2,695 high interval (Pro) →
- Mortgage (P&I)
- −$1,773
- Tax from tax record
- −$279 /mo · $3,353/yr
- Insurance
- −$141
- HOA
- −$0
- Vacancy / Maint / Mgmt
- −$566
- Net cashflow
- $-63
Break-even live
UW: 25.0% down · 7.5% · 30yr · 1.5% tax · 5.0% vac · 8.0% maint · 8.0% mgmt
Financing live
Cash to close
- Down payment
- $84,500
- Closing costs
- $10,140
- Reserves months
- —
- Total cash needed
- —
Loan-product check · same deal, 3 products live
Conventional
25% down · 7.5% · 30yr
- Down + closing
- —
- Monthly P&I
- —
- Monthly cashflow
- —
- DSCR
- —
- Eligible?
- —
Personal DTI + credit; lowest rate.
DSCR
20% down · 8.5% · 30yr
- Down + closing
- —
- Monthly P&I
- —
- Monthly cashflow
- —
- DSCR
- —
- Eligible?
- —
No personal income docs; deal must DSCR.
Hard money
10% down · 12.0% · 12mo
- Down + closing
- —
- Monthly P&I
- —
- Monthly cashflow
- —
- DSCR
- —
- Eligible?
- —
Short-term bridge; refi at stabilization.
Rent comps 5 comps
| Address | Beds | Baths | Sqft | Rent | $/sqft | DOM | Units | Dist |
|---|---|---|---|---|---|---|---|---|
| 442 Mystic Cove Ln Lake Orion, MI | 2.0–4.0 | 2.0–3.0 | 1989 | $5,350 | $2.69 | 1d | 4 | 0.27mi |
| 711 Kimberly Lake Orion, MI | 1.0–2.0 | 1.0–1.5 | 985 | $1,149 | $1.17 | 1d | 6 | 0.30mi |
| 120 S Broadway St Lake Orion, MI | 2.0 | 2.0 | 1065 | $2,950 | $2.77 | 14d | 1 | 0.57mi |
| 733 Luna Ct Lake Orion, MI | 3.0 | 1.5 | 1177 | $2,695 | $2.29 | 19d | 1 | 1.07mi |
| 784 Porteous Dr Lake Orion, MI | 2.0 | 1.0 | 875 | $1,600 | $1.83 | 43d | 1 | 1.49mi |
Listing history 9 events
-
2026-06-18days on market $338,000 Active 13 DOM
-
2026-06-17days on market $338,000 Active 12 DOM
-
2026-06-16days on market $338,000 Active 11 DOM
-
2026-06-15days on market $338,000 Active 10 DOM
-
2026-06-13days on market $338,000 Active 8 DOM
-
2026-06-09days on market $338,000 Active 4 DOM
-
2026-06-08days on market $338,000 Active 3 DOM
-
2026-06-07remarks 553-char remark
-
2026-06-07$338,000 Active 2 DOM
ⓘ Source: listings_history table (triggers on properties + properties_extension) + one-shot
backfill from property_details.listing_events for pre-trigger history.
Tax reassessment forecast MI · Partial reset (capped growth)
- Current annual tax
- $3,353 · $279/mo
- Projected year-2 tax
- $4,279 · $357/mo
- Expected delta
- +$926/yr (+$77/mo · 27.6%)
ⓘ Screening estimate from a state-policy table — verify with the county assessor before closing.
Climate risk First Street
- Flood 1/10 Low FEMA zone X (unshaded) · 0% chance over 30 yrs
- Wildfire 1/10 Low
- Heat 2/10 Low 7 d/yr ≥97°F today · 15 d/yr by 30 yrs out
- Wind 2/10 Low
- Air quality 3/10 Moderate 2 unhealthy d/yr today · 4 by 30 yrs out
Nearby sold comps map
Loading sold comps map…
Walkable amenities ~0.75 mi
Loading nearby amenities…
Taxation est. · year 1
- Rental income
- $32,344
- − Mortgage interest
- −$18,933
- − Property taxes
- −$3,353
- − Insurance
- −$1,690
- − Repairs & maintenance
- −$2,587
- − Management
- −$2,587
- − Depreciation
- −$9,833
- Taxable loss
- −$6,641
- Est. tax savings @ 24.0%
- +$1,594
- After-tax cash flow
- $832/yr
For passive investors: Depreciation is non-cash, so a rental often shows a tax loss while cash-flowing — sheltering income. Rental losses are passive: they offset passive income freely, and up to $25,000/yr can offset ordinary (W-2) income if you actively participate and your MAGI is under $100k (phasing out to $0 by $150k); unused losses carry forward. On sale, claimed depreciation is recaptured at up to 25%, and gains may owe capital-gains tax (a 1031 exchange can defer both). Figures are a year-1 estimate at your 24.0% rate — not tax advice; consult a CPA.
Schools (NCES district)
- District
- Lake Orion Community Schools
- NCES district ID
- 2620730
- Math proficiency
- 49% ▼ -10.00%
- Reading proficiency
- 64% ▼ -10.00%
- Median HH income
- $82,396
- Composite
- 51.21/100
- National rank
- #1755
- State rank
- #45 of 540 in MI
Livability — Orion
No livability data for this city. (Only ~50 U.S. cities are tracked.)
Census & demographics
- Census place
- Lake Orion, MI
- City population
- 10,401
- Population (ZIP)
- 14,746
Population outlook (Oakland County) Hauer SSP2
- Today (2025)
- 1,335,747 people
- By 2030
- 1,375,100 · +2.9%
- By 2040
- 1,435,385 · +7.5%
- By 2050
- 1,469,250 · +10.0%
- By 2075
- 1,531,946 · +14.7%
- By 2100
- 1,450,485 · +8.6%
Race, ethnicity, and origin ACS 2023
- Neighborhood character
- Predominantly White (88%)
- Race & ethnicity
- White 88% Two or more races 5% Hispanic / Latino 4% Black 2% Asian 2%
- Common ancestry
- Romanian 11% Lithuanian 5% Slovak 3%
- Foreign-born
- 6% · Canada, China, Dominican Republic
- Languages at home
- 95% English-only · Spanish 1% Chinese 1% German/W. Germanic 1%
Political lean MEDSL · Oakland
- 2024 margin
- D (+10.6) · D 54.4% · R 43.8% · Other 1.9%
- 2008→2024 swing
- -3.9pp toward R · 2008: 14.5pp · 2024: 10.6pp
- All cycles
- 2024: D+10.6 2020: D+14.1 2016: D+8.1 2012: D+8.1 2008: D+14.5
Not yet ingested
- Civics
- —
Market trends
- HPI YoY
- ▼ -307.96%
- Current HPI
- 182.3653
- Rent YoY
- —
- Metro
- —
- State GDP YoY
- ▲ 1.37%
- F500 in state
- 28
Industry mix (Fortune 500 HQ in MI)
| Industry | F500 HQs | Revenue |
|---|---|---|
| Automotive Parts | 3 | $48B |
|
||
| Automotive | 2 | $372B |
|
||
| Chemicals | 1 | $45B |
|
||
| Automotive Retail | 1 | $29B |
|
||
| Healthcare / Medical Devices | 1 | $23B |
|
||
| Automotive Technology | 1 | $20B |
|
||
Price history
+181.9% since first listed34 events — show timeline
- 2026-06-05 Listed $338,000 REALCOMP
- 2026-06-05 Listed $338,000 MiRealSource-MiMLS
- 2026-05-21 Sold (Public Records) $325,900 Public Records
- 2025-01-17 Sold (Public Records) $215,000 Public Records
- 2025-01-10 Sold (MLS) $215,000 MiRealSource-MiMLS
- 2025-01-10 Sold (MLS) $215,000 REALCOMP
- 2024-12-17 Pending — REALCOMP
- 2024-12-16 Pending — MiRealSource-MiMLS
- 2024-12-16 Pending — REALCOMP
- 2024-11-12 Price Changed $240,000 MiRealSource-MiMLS
- 2024-11-12 Price Changed $240,000 REALCOMP
- 2024-11-07 Price Changed $248,000 MiRealSource-MiMLS
- 2024-11-07 Price Changed $248,000 REALCOMP
- 2024-11-05 Price Changed $258,000 MiRealSource-MiMLS
- 2024-11-05 Price Changed $258,000 REALCOMP
- 2024-11-01 Listed $268,000 MiRealSource-MiMLS
- 2024-11-01 Listed $268,000 REALCOMP
- 2009-10-13 Sold (MLS) $31,000 REALCOMP
- 2009-06-19 Listed $35,000 REALCOMP
- 2009-04-08 Listing Removed — MiRealSource-MiMLS
- 2009-04-08 Listing Removed — REALCOMP
- 2008-10-30 Listed $53,000 MiRealSource-MiMLS
- 2008-10-30 Listed $53,000 REALCOMP
- 2006-09-12 Sold (Public Records) $139,900 Public Records
- 2003-10-14 Listing Removed — REALCOMP
- 2003-09-26 Listed $139,900 REALCOMP
- 2003-02-17 Listing Removed — REALCOMP
- 2003-02-03 Listed $134,900 REALCOMP
- 2002-12-31 Listing Removed — REALCOMP
- 2002-05-20 Listed $132,900 REALCOMP
- 2000-02-09 Sold (Public Records) $131,000 Public Records
- 2000-02-09 Sold (Public Records) $115,000 Public Records
- 1999-12-30 Sold (MLS) $115,000 REALCOMP
- 1999-10-11 Listed $119,900 REALCOMP
Property tax history
+6.3%/yrLatest (2025): $3,353 · +44.1% YoY. Source: county tax records.
Cash-flow waterfall
monthlySold comps — $/sqft
last 12 mo · ≤1 miLoading sold comps…