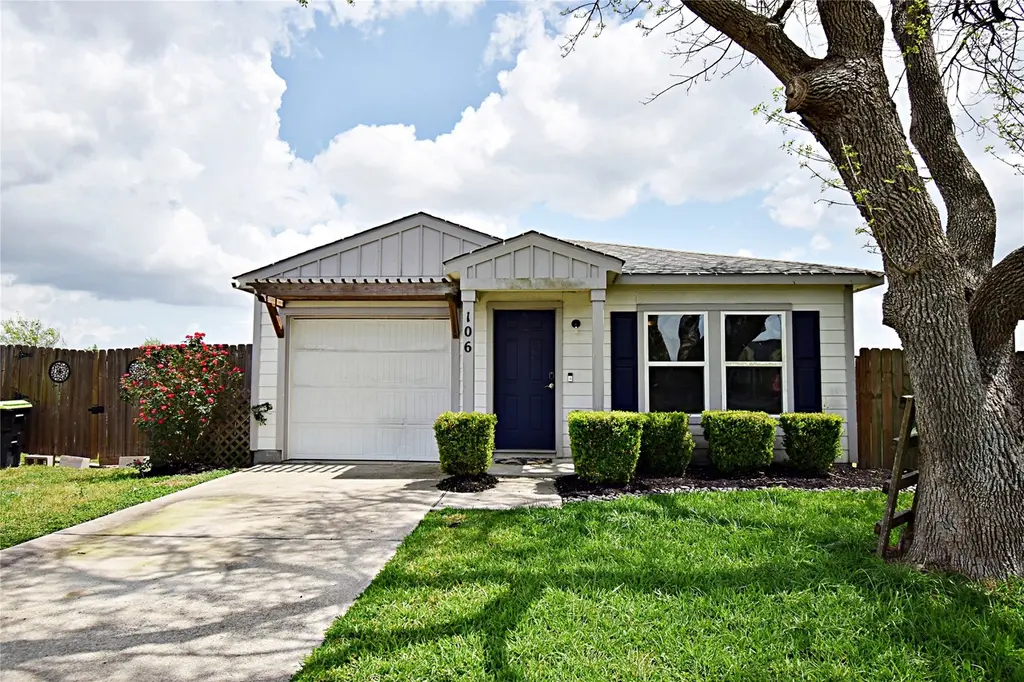
106 Collins Ct · Kendleton, TX
Flood risk 1/10 · Minimal
- FEMA flood zone
- X (unshaded)
- Chance of flooding over 30 yrs
- 0.0%
- Est. flood insurance / yr
- $507 – $1,088
Fire risk 3/10 · Minor
- Est. fire insurance / yr
- $1,222 – $2,270
Heat risk 9/10 · Severe
- Hot days now (above 111°F)
- 7 days/yr
- Hot days in 30 yrs
- 23 days/yr
Wind risk 9/10 · Severe
- Chance of severe wind over 30 yrs
- 99.0%
Air-quality risk 2/10 · Minimal
- Unhealthy air days now
- 1 days/yr
- Unhealthy air days in 30 yrs
- 1 days/yr
Risk factors via First Street. Map © Google.
Why this score? — see what drove the B grade
The composite is a weighted blend of 9 inputs, each scored 0–100. Each bar is that input's sub-score; the figure is the points it added to the 100-point composite (weight × sub-score).
- Cash flow +30.0/30.0
- 1% rule +10.0/10.0
- DSCR +10.0/10.0
- Appreciation +7.6/10.0
- Schools +4.6/10.0
- Livability +3.1/5.0
- Rent growth +2.5/5.0
- Condition / age +2.5/5.0
- ARV discount +0.0/15.0
$175,000
🖨 Deal sheet 📄 Offer letter ✓ Due diligence
Listing remarks MLS
Proud to present 106 Collins Court! Nestled in a quiet cul-de-sac, this charming 3 bedroom, 2 full bath offers the perfect blend of comfort, style, and privacy. Step inside to find an open concept floor plan characterized by abundance of natural light. Beautifully maintained residence welcomes you with manicured landscaping, sitting on a generous 14,147 sqft lot. Fully fenced backyard with enough room to design a massive custom deck, a covered outdoor kitchen, or even a swimming pool while still leaving plenty of green space for play. Schedule your private tour today and experience the charm for yourself!
Key facts
- Quiet cul-de-sac
- Custom deck
- 0.32 acre lot
Tags
Neighborhood map
What this means for you Summary
Snapshot
- This is a 3-bed/2.0-bath single-family listed at $175k.
Deal economics
- At list price, monthly cash flow is $1k ($17k/yr) — positive.
- The deal already cash-flows at list — no discount required.
- Meets the 1% rule at list price ($3k rent vs $175k).
- Recommended offer: $164k (6.0% below list) — sets the bar for market timing.
- Cap rate 16.1% vs local median 6.2% in Kendleton — top-decile yield for the area; either an underpriced asset or a hidden risk that comps aren't pricing in. Stress-test before assuming the spread holds.
Location & tenants
- Location reads 61/100 on livability (#1,021 in TX) — a middle-class / working-renter tenant base. Strengths: cost of living A+, housing A+; Watch: schools C-, employment D+, crime D.
- Lamar CISD (suburban): math 50% / reading 53% proficiency, ranked #116 of 826 in TX (top 14%) — acceptable for families but not a draw, mixed tenant base, ~2y average lease.
- Market conditions: 14 active listings in the ZIP; 1 comparable units currently listed for rent nearby; 12,093 units permitted in Fort Bend County in 2024 (815 in 5+ unit buildings).
Forward outlook
- In year one you build about $10k of equity ($1k loan paydown + $9k appreciation (5.1% local appreciation)).
- Fort Bend County population projected at +75% by 2050 — long-run rental-demand tailwind backs the buy-and-hold thesis.
- At projected returns (5.1% appreciation + 3.0% rent growth), your $49k cash investment doubles in ~2 years — after that, you're playing with house money.
- By year 4, paydown + projected appreciation supports a ~$34k cash-out refi (75% LTV) — recoverable capital for the next deal without selling this one.
Negotiation context
- It's been on market 78 days — a 6% lower offer ($164k) is reasonable based on typical stale-listing flexibility.
- 6 sale attempts since 11y ago; this cycle's ask has dropped $10k (5%) from the opening price — seller is motivated, your offer sets the floor, not the list.
Risks & watch-outs
- Climate carrying-cost: severe wind risk, 99% chance of damaging wind over 30y; extreme-heat days projected 7→23/yr by 2055 (HVAC capex compounding) — expect insurance premiums to compound above CPI over the hold.
Questions for the listing agent
- It's been on market 78 days. Have you received any prior offers? Is the seller open to a 6% concession, seller financing, or rate buy-down credit?
- Why hasn't it sold? Are there any deal-killer items the seller is aware of (foundation, flood, title, zoning, code violations)?
- Is there a deadline driving the sale (1031 exchange, divorce, estate, relocation)? That informs how much negotiation room exists.
- Crime grade is D in this area — have there been break-ins, vandalism, or insurance claims at this property in the last 3 years? What carrier currently insures it and at what premium?
- What's the average days-on-market for RENTAL listings here right now (not sales)? A rising rental-DOM trend means longer vacancies and softer asking-rent achievability than the comps imply.
- What's the recent tenant-quality profile in this submarket — average credit score on applications, eviction rate, late-payment / NSF rate, and stable-employment percentage? A property-management company in the area should have these aggregated.
- How much new for-sale + rental construction is in the pipeline within 1–3 miles? Heavy new supply typically softens prices + rents 12–24 months out; constrained supply supports both.
Investment metrics
- 1% rule
- 1.97% ✓
- Cap rate
- 16.12%
- Cash-on-cash
- 35.11%
- DSCR
- 2.56
- GRM
- 4.2
CMA / ARV
- ARV (median comp)
- $145,831
- List price
- $175,000
- Delta
- 20.00%
- Verdict
- OVERPRICED
- Comps
- 9 within 1.0 mi
Show comp detail 2 sales within ~0.75 mi
| Address | Dist | Beds/Ba | Sqft | Sold | Price | $/sf | Match |
|---|---|---|---|---|---|---|---|
| 14119 Willie Melton Blvd | 0.04mi | 3/2.0 | 1,001 (0%) | 11mo | $215,000 | $215 | 89 |
| 13726 Willie Melton Blvd | 0.35mi | 3/1.5 | 1,048 (+5%) | 9mo | $145,000 | $138 | 67 |
Match score weights: distance 35% · size 25% · config 20% · recency 20%. Top-matched comps best support the ARV.
Projected returns pro-forma
5.1% appreciation · 3.0% rent growth · sell at horizon
- IRR
- 44.0%
- Equity multiple
- 3.71×
- Total profit
- $132,776
- Equity at exit
- $100,266
- IRR
- 41.9%
- Equity multiple
- 7.58×
- Total profit
- $322,194
- Equity at exit
- $173,958
Cash invested: $49,000 (down + closing). Projections, not guarantees.
Landlord ↔ Tenant lean methodology
- Overall (STATE)
- 87 Strongly Landlord-Friendly
- State Texas
- 87 Strongly Landlord-Friendly · R+5
- County
- — inherits STATE
- City
- — inherits STATE
ZIP-level market 77451
- Home prices YoY
- 3.4%
- Active inventory
- 14
- Price-to-rent
- 4.2×
Monthly cashflow live
- Estimated rent
- $3,450 medium interval (Pro) →
- Mortgage (P&I)
- −$918
- Tax from tax record
- −$301 /mo · $3,615/yr
- Insurance
- −$73
- HOA
- −$0
- Vacancy / Maint / Mgmt
- −$724
- Net cashflow
- $1,434
Break-even live
UW: 25.0% down · 7.5% · 30yr · 1.5% tax · 5.0% vac · 8.0% maint · 8.0% mgmt
Financing live
Cash to close
- Down payment
- $43,750
- Closing costs
- $5,250
- Reserves months
- —
- Total cash needed
- —
Loan-product check · same deal, 3 products live
Conventional
25% down · 7.5% · 30yr
- Down + closing
- —
- Monthly P&I
- —
- Monthly cashflow
- —
- DSCR
- —
- Eligible?
- —
Personal DTI + credit; lowest rate.
DSCR
20% down · 8.5% · 30yr
- Down + closing
- —
- Monthly P&I
- —
- Monthly cashflow
- —
- DSCR
- —
- Eligible?
- —
No personal income docs; deal must DSCR.
Hard money
10% down · 12.0% · 12mo
- Down + closing
- —
- Monthly P&I
- —
- Monthly cashflow
- —
- DSCR
- —
- Eligible?
- —
Short-term bridge; refi at stabilization.
Rent comps 1 comps
| Address | Beds | Baths | Sqft | Rent | $/sqft | DOM | Units | Dist |
|---|---|---|---|---|---|---|---|---|
| 13218 HP Johnson St Unit A Kendleton, TX | 3.0 | 2.5 | 1364 | $3,450 | $2.53 | 1d | 1 | 0.82mi |
Listing history 32 events
-
2026-06-18days on market $175,000 Active 78 DOM
-
2026-06-17days on market $175,000 Active 77 DOM
-
2026-06-16days on market $175,000 Active 76 DOM
-
2026-06-15days on market $175,000 Active 75 DOM
-
2026-06-13days on market $175,000 Active 73 DOM
-
2026-06-10days on market $175,000 Active 69 DOM
-
2026-06-08days on market $175,000 Active 68 DOM
-
2026-06-07days on market $175,000 Active 67 DOM
-
2026-06-04days on market $175,000 Active 64 DOM
-
2026-06-03days on market $175,000 Active 63 DOM
-
2026-06-02days on market $175,000 Active 62 DOM
-
2026-06-01days on market $175,000 Active 61 DOM
-
2026-05-31days on market $175,000 Active 60 DOM
-
2026-04-27price $175,000 616-char remark
Show marketing remark (616 chars)
Proud to present 106 Collins Court! Nestled in a quiet cul-de-sac, this charming 3 bedroom, 2 full bath offers the perfect blend of comfort, style, and privacy. Step inside to find an open concept floor plan characterized by abundance of natural light. Beautifully maintained residence welcomes you with manicured landscaping, sitting on a generous 14,147 sqft lot. Fully fenced backyard with enough room to design a massive custom deck, a covered outdoor kitchen, or even a swimming pool while still leaving plenty of green space for play. Schedule your private tour today and experience the charm for yourself!
-
2026-04-01$185,000 Active 616-char remark
Show marketing remark (616 chars)
Proud to present 106 Collins Court! Nestled in a quiet cul-de-sac, this charming 3 bedroom, 2 full bath offers the perfect blend of comfort, style, and privacy. Step inside to find an open concept floor plan characterized by abundance of natural light. Beautifully maintained residence welcomes you with manicured landscaping, sitting on a generous 14,147 sqft lot. Fully fenced backyard with enough room to design a massive custom deck, a covered outdoor kitchen, or even a swimming pool while still leaving plenty of green space for play. Schedule your private tour today and experience the charm for yourself!
-
2019-03-01soldstatus Sold 287-char remark
Show marketing remark (287 chars)
Completion date is March 2019. 1001-A NEW single-story garage home! The home features an open great room and kitchen. Additionally, there is an owner's suite with private bath, 2 more bedrooms and another full bath. Haggle free pricing. No negotiation necessary. Lowest price guaranteed.
-
2019-01-29status Pending 287-char remark
Show marketing remark (287 chars)
Completion date is March 2019. 1001-A NEW single-story garage home! The home features an open great room and kitchen. Additionally, there is an owner's suite with private bath, 2 more bedrooms and another full bath. Haggle free pricing. No negotiation necessary. Lowest price guaranteed.
-
2019-01-03$100,990 Active 287-char remark
Show marketing remark (287 chars)
Completion date is March 2019. 1001-A NEW single-story garage home! The home features an open great room and kitchen. Additionally, there is an owner's suite with private bath, 2 more bedrooms and another full bath. Haggle free pricing. No negotiation necessary. Lowest price guaranteed.
-
2018-10-29status Pending
-
2018-10-29historical
-
2018-10-20price $94,990
-
2018-10-13price $96,990
-
2018-06-20$100,990 Active
-
2018-06-14soldstatus
-
2017-12-31historical
-
2017-11-09price $10,000
-
2017-01-06status Active
-
2016-12-24status Pending
-
2016-12-07status Option Pending
-
2016-06-28status Active
-
2016-05-18historical
-
2015-11-24$6,600 Active
ⓘ Source: listings_history table (triggers on properties + properties_extension) + one-shot
backfill from property_details.listing_events for pre-trigger history.
Tax reassessment forecast TX · Resets to sale price
- Current annual tax
- $3,615 · $301/mo
- Projected year-2 tax
- $3,615 · $301/mo
- Expected delta
- $0/yr ($0/mo · 0.0%)
ⓘ Screening estimate from a state-policy table — verify with the county assessor before closing.
Climate risk First Street
- Flood 1/10 Low FEMA zone X (unshaded) · 0% chance over 30 yrs
- Wildfire 3/10 Moderate
- Heat 9/10 Extreme 7 d/yr ≥111°F today · 23 d/yr by 30 yrs out
- Wind 9/10 Extreme 99% chance of damaging wind over 30 yrs
- Air quality 2/10 Low 1 unhealthy d/yr today · 1 by 30 yrs out
Nearby sold comps map
Loading sold comps map…
Walkable amenities ~0.75 mi
Loading nearby amenities…
Taxation est. · year 1
- Rental income
- $41,400
- − Mortgage interest
- −$9,803
- − Property taxes
- −$3,615
- − Insurance
- −$875
- − Repairs & maintenance
- −$3,312
- − Management
- −$3,312
- − Depreciation
- −$5,091
- Taxable income
- $15,392
- Est. tax owed @ 24.0%
- −$3,694
- After-tax cash flow
- $13,509/yr
For passive investors: Depreciation is non-cash, so a rental often shows a tax loss while cash-flowing — sheltering income. Rental losses are passive: they offset passive income freely, and up to $25,000/yr can offset ordinary (W-2) income if you actively participate and your MAGI is under $100k (phasing out to $0 by $150k); unused losses carry forward. On sale, claimed depreciation is recaptured at up to 25%, and gains may owe capital-gains tax (a 1031 exchange can defer both). Figures are a year-1 estimate at your 24.0% rate — not tax advice; consult a CPA.
Schools (NCES district)
- District
- Lamar CISD
- NCES district ID
- 4826580
- Math proficiency
- 50% ▼ -12.00%
- Reading proficiency
- 53% ▼ -4.00%
- Median HH income
- $75,213
- Composite
- 46.43/100
- National rank
- #2452
- State rank
- #116 of 826 in TX
Livability — Kendleton
- Score
- 61/100
- State rank
- #1021
- US rank
- #18149
Category grades
Schools grade is shown separately in the Schools card above.
Census & demographics
- Census place
- Kendleton, TX
- Population (ZIP)
- 510
Population outlook (Fort Bend County) Hauer SSP2
- Today (2025)
- 1,004,526 people
- By 2030
- 1,153,104 · +14.8%
- By 2040
- 1,453,718 · +44.7%
- By 2050
- 1,753,781 · +74.6%
- By 2075
- 2,455,772 · +144.5%
- By 2100
- 2,930,528 · +191.7%
Race, ethnicity, and origin ACS 2023
- Neighborhood character
- Majority Black (53%)
- Race & ethnicity
- Black 53% Hispanic / Latino 47% Two or more races 29%
- Hispanic origin (detail)
- Mexican 47%
- Foreign-born
- 9% · Canada
- Languages at home
- 73% English-only · Spanish 27%
Political lean MEDSL · Fort Bend
- 2024 margin
- Toss-up / Even · D 49.5% · R 47.9% · Other 2.6%
- 2008→2024 swing
- +4.0pp toward D · 2008: -2.4pp · 2024: 1.6pp
- All cycles
- 2024: D+1.6 2020: D+10.6 2016: D+6.6 2012: R+6.8 2008: R+2.4
Not yet ingested
- Civics
- —
Market trends
- HPI YoY
- ▲ 5.10%
- Current HPI
- 153.2946
- Rent YoY
- —
- Metro
- —
- State GDP YoY
- ▲ 3.95%
- F500 in state
- 110
Industry mix (Fortune 500 HQ in TX)
| Industry | F500 HQs | Revenue |
|---|---|---|
| Energy | 16 | $1,198B |
|
||
| Technology | 5 | $198B |
|
||
| Engineering / Construction | 4 | $72B |
|
||
| Energy Services | 3 | $60B |
|
||
| Utilities | 3 | $41B |
|
||
| Healthcare | 2 | $330B |
|
||
Price history
+2551.5% since first listed19 events — show timeline
- 2026-04-27 Price Changed $175,000 HARMLS
- 2026-04-01 Listed $185,000 HARMLS
- 2019-03-01 Sold (MLS) — HARMLS
- 2019-01-29 Pending — HARMLS
- 2019-01-03 Listed $100,990 HARMLS
- 2018-10-29 Pending — HARMLS
- 2018-10-29 Listing Removed — HARMLS
- 2018-10-20 Price Changed $94,990 HARMLS
- 2018-10-13 Price Changed $96,990 HARMLS
- 2018-06-20 Listed $100,990 HARMLS
- 2018-06-14 Sold (Public Records) — Public Records
- 2017-12-31 Listing Removed — HARMLS
- 2017-11-09 Price Changed $10,000 HARMLS
- 2017-01-06 Relisted — HARMLS
- 2016-12-24 Pending — HARMLS
- 2016-12-07 Pending — HARMLS
- 2016-06-28 Relisted — HARMLS
- 2016-05-18 Listing Removed — HARMLS
- 2015-11-24 Listed $6,600 HARMLS
Property tax history
+23.2%/yrLatest (2025): $3,615 · +3.8% YoY. Source: county tax records.
Cash-flow waterfall
monthlySold comps — $/sqft
last 12 mo · ≤1 miLoading sold comps…