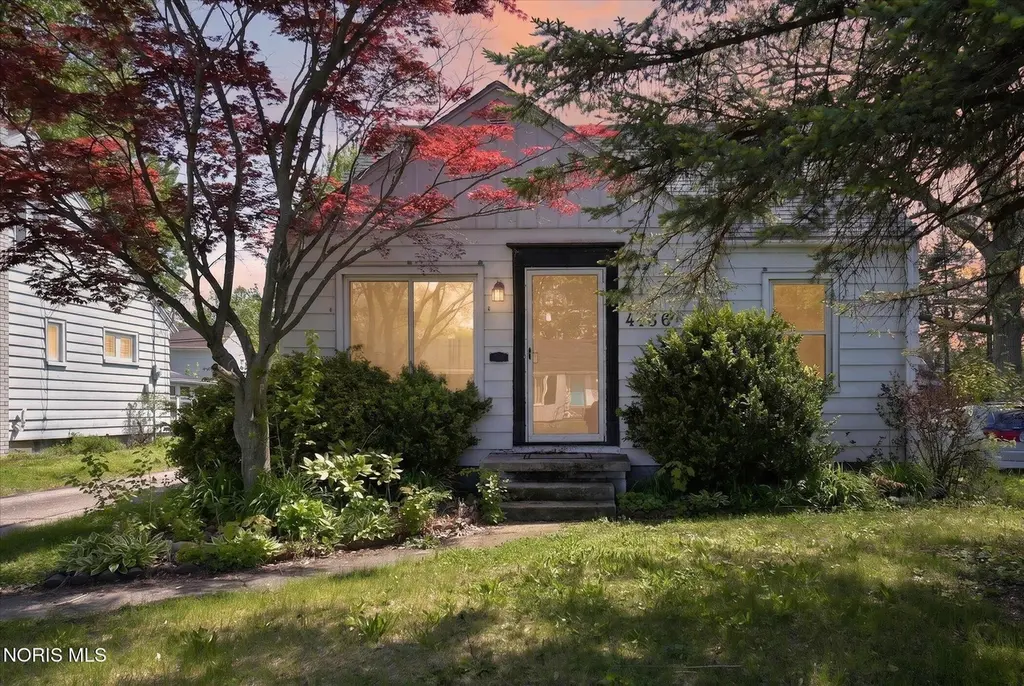
4136 Rohr Dr · Toledo, OH
Flood risk 1/10 · Minimal
- FEMA flood zone
- X (unshaded)
- Chance of flooding over 30 yrs
- 0.0%
- Est. flood insurance / yr
- $473 – $860
Fire risk 1/10 · Minimal
- Est. fire insurance / yr
- $713 – $1,323
Heat risk 3/10 · Minor
- Hot days now (above 101°F)
- 7 days/yr
- Hot days in 30 yrs
- 16 days/yr
Wind risk 2/10 · Minimal
- Chance of severe wind over 30 yrs
- —
Air-quality risk 2/10 · Minimal
- Unhealthy air days now
- 1 days/yr
- Unhealthy air days in 30 yrs
- 3 days/yr
Risk factors via First Street. Map © Google.
Why this score? — see what drove the D+ grade
The composite is a weighted blend of 9 inputs, each scored 0–100. Each bar is that input's sub-score; the figure is the points it added to the 100-point composite (weight × sub-score).
- Cash flow +16.8/30.0
- ARV discount +7.5/15.0
- DSCR +5.2/10.0
- 1% rule +4.9/10.0
- Schools +3.5/10.0
- Rent growth +3.3/5.0
- Livability +3.3/5.0
- Condition / age +2.5/5.0
- Appreciation +0.0/10.0
$109,900
🖨 Deal sheet 📄 Offer letter ✓ Due diligence
Listing remarks
Excellent opportunity in a great area with Washington Local Schools! This 3 bedroom home offers comfort, value, and plenty of potential at a great price. The spacious layout features a huge dormer that creates an ideal primary suite, giving you a private retreat with room to relax and make the space your own. The full basement provides additional storage, workspace, or future finishing possibilities, while the 1.5-car garage adds convenience for parking, tools, and outdoor equipment. All appliances stay with the home, making the move even easier. With a roof that is only six years old, a desirable location, and a price point that makes sense, this property is a fantastic opportunity for buy
Key facts
- 6,300 sq ft lot
- Garage
- Built 1952
Property features AI
Exterior
- Parking: Detached garage with concrete driveway; Approximately 1.5 garage spaces
- Utilities: Cable available; Electricity available; Natural gas connected; Public sewer; Public water; Internet connected
- Home design: Single-family house; One and one-half levels (2 stories total); Not attached to other units; No common walls
- Construction: Aluminum siding; Other foundation
- Exterior features: Shingle roof
Interior
- Kitchen: Kitchen on main level
- Bedrooms: Upper bedroom (large); Main-level bedroom; Third bedroom
- Flooring: Carpet; Wood
- Bathrooms: 1 full bathroom
- Heating & cooling: Forced air heating (natural gas); Central air conditioning
- Interior features: Ceiling fan(s); 6 total rooms; Full basement
- Laundry & utility: Laundry located inside
Neighborhood map
What this means for you Summary
Snapshot
- This is a 3-bed/1.0-bath single-family listed at $110k.
Deal economics
- At list price, monthly cash flow is $70 ($839/yr) — positive.
- The deal already cash-flows at list — no discount required.
- To meet the 1% rule (rent ≥ 1% of price), the offer needs to be $109k (0.7% below list).
- Recommended offer: $109k (0.7% below list) — sets the bar for 1% rule.
Location & tenants
- Location reads 66/100 on livability (#645 in OH) — a middle-class / working-renter tenant base. Strengths: cost of living A+, housing A+, health & safety A+; Watch: amenities C-, crime F, commute F.
- Washington Local (urban): math 37% / reading 47% proficiency, ranked #528 of 656 in OH (top 80%) — families likely to look elsewhere, expect single-tenant / working-renter base with shorter leases.
- Zoned schools: Hiawatha Elementary School (math 37% / reading 52%, grade F, #991 of 1,584 statewide, top 64%, 345 students, 49% FRL); Whitmer High School (math 38% / reading 48%, grade F, #494 of 781 statewide, top 63%, 2,247 students, 42% FRL) — zoned schools at 46% FRL track the district average.
- Market conditions: Rents rising (+3.3%/yr); 111 active listings in the ZIP; 24 comparable units currently listed for rent nearby; rentals at typical pace (median 24d on market — plan ~3-4 weeks tenant-placement turnaround); 415 units permitted in Lucas County in 2024 (122 in 5+ unit buildings).
Forward outlook
- Local home prices are declining (-3.0%/yr); year-one equity from $760 of loan paydown is wiped out by about $3k of value loss. Plan a longer hold.
- Lucas County population projected at -16% by 2050 — secular population decline; favor cash flow + early exit over multi-decade hold.
Negotiation context
- Only 3 days on market — expect competitive offers; lowballing is unlikely to land.
- 6 sale attempts since 15y ago with the ask held roughly flat each time — persistent listings suggest the price (not the market) is what's stuck; bring a comps-based counter.
- Current owner paid $64k; list at $110k implies a 72% gain — meaningful room to come down on a strong offer.
Risks & watch-outs
- Watch-outs: built in 1952 — expect roof / HVAC / electrical / plumbing capex.
Questions for the listing agent
- Built in 1952 — when were the roof, HVAC, electrical panel, plumbing, and water heater last replaced?
- Is there a deadline driving the sale (1031 exchange, divorce, estate, relocation)? That informs how much negotiation room exists.
- Schools are D-rated, which usually means shorter tenancies and higher turnover. Who's the typical renter profile here, and what's been the actual vacancy rate?
- Crime grade is F in this area — have there been break-ins, vandalism, or insurance claims at this property in the last 3 years? What carrier currently insures it and at what premium?
- The area grade is low — what's the realistic commute time and amenity access for the typical tenant pool here? Any planned neighborhood developments (good or bad) we should know about?
- What's the average days-on-market for RENTAL listings here right now (not sales)? A rising rental-DOM trend means longer vacancies and softer asking-rent achievability than the comps imply.
- What's the recent tenant-quality profile in this submarket — average credit score on applications, eviction rate, late-payment / NSF rate, and stable-employment percentage? A property-management company in the area should have these aggregated.
- How much new for-sale + rental construction is in the pipeline within 1–3 miles? Heavy new supply typically softens prices + rents 12–24 months out; constrained supply supports both.
Investment metrics
- 1% rule
- 0.99% ✗
- Cap rate
- 7.06%
- Cash-on-cash
- 2.73%
- DSCR
- 1.12
- GRM
- 8.4
CMA / ARV
- ARV (median comp)
- $225,441
- List price
- $109,900
- Delta
- -46.82%
- Verdict
- UNDERPRICED
- Comps
- 13 within 2.0 mi
Show comp detail 12 sales within ~0.75 mi
| Address | Dist | Beds/Ba | Sqft | Sold | Price | $/sf | Match |
|---|---|---|---|---|---|---|---|
| 3015 Lambert Dr | 0.36mi | 3/1.0 | 1,133 (+0%) | 2mo | $165,000 | $146 | 82 |
| 3016 Lambert Dr | 0.38mi | 3/1.0 | 1,185 (+5%) | 3mo | $150,000 | $127 | 72 |
| 4214 Grantley Rd | 0.43mi | 3/1.5 | 1,194 (+6%) | 3mo | $172,000 | $144 | 66 |
| 3021 Pinehurst Rd | 0.31mi | 3/1.5 | 1,242 (+10%) | 2mo | $207,400 | $167 | 66 |
| 2645 Westbrook Dr | 0.63mi | 3/1.0 | 1,102 (-3%) | 4mo | $145,000 | $132 | 64 |
| 3827 Grantley Rd | 0.52mi | 3/1.5 | 1,267 (+12%) | 2mo | $189,000 | $149 | 52 |
| 2537 Ivy Pl | 0.74mi | 3/1.0 | 1,220 (+8%) | 3mo | $168,000 | $138 | 49 |
| 4722 Bowser Dr | 0.63mi | 3/2.0 | 1,020 (-10%) | 2mo | $180,000 | $176 | 48 |
| 3723 Grantley Rd | 0.61mi | 3/2.0 | 1,254 (+11%) | 2mo | $222,300 | $177 | 48 |
| 4807 Brott Rd | 0.69mi | 3/1.0 | 996 (-12%) | 2mo | $157,000 | $158 | 46 |
| 3653 Woodmont Rd | 0.72mi | 3/1.5 | 1,258 (+11%) | 2mo | $200,000 | $159 | 44 |
| 3840 Garrison Rd | 0.49mi | 4/2.0 (+1) | 1,287 (+14%) | 4mo | $202,000 | $157 | 42 |
Match score weights: distance 35% · size 25% · config 20% · recency 20%. Top-matched comps best support the ARV.
Projected returns pro-forma
-3.0% appreciation · 3.3% rent growth · sell at horizon
- IRR
- -11.6%
- Equity multiple
- 0.58×
- Total profit
- $-12,988
- Equity at exit
- $16,386
- IRR
- -1.9%
- Equity multiple
- 0.87×
- Total profit
- $-4,063
- Equity at exit
- $9,502
Cash invested: $30,772 (down + closing). Projections, not guarantees.
Landlord ↔ Tenant lean methodology
- Overall (STATE)
- 73 Landlord-Friendly
- State Ohio
- 73 Landlord-Friendly · R+6
- County
- — inherits STATE
- City
- — inherits STATE
ZIP-level market 43613
- Home prices YoY
- -20.7%
- Rents YoY
- 3.3%
- Active inventory
- 111
- Price-to-rent
- 8.4×
Monthly cashflow live
- Estimated rent
- $1,091 high interval (Pro) →
- Mortgage (P&I)
- −$576
- Tax from tax record
- −$170 /mo · $2,038/yr
- Insurance
- −$46
- HOA
- −$0
- Vacancy / Maint / Mgmt
- −$229
- Net cashflow
- $70
Break-even live
UW: 25.0% down · 7.5% · 30yr · 1.5% tax · 5.0% vac · 8.0% maint · 8.0% mgmt
Financing live
Cash to close
- Down payment
- $27,475
- Closing costs
- $3,297
- Reserves months
- —
- Total cash needed
- —
Loan-product check · same deal, 3 products live
Conventional
25% down · 7.5% · 30yr
- Down + closing
- —
- Monthly P&I
- —
- Monthly cashflow
- —
- DSCR
- —
- Eligible?
- —
Personal DTI + credit; lowest rate.
DSCR
20% down · 8.5% · 30yr
- Down + closing
- —
- Monthly P&I
- —
- Monthly cashflow
- —
- DSCR
- —
- Eligible?
- —
No personal income docs; deal must DSCR.
Hard money
10% down · 12.0% · 12mo
- Down + closing
- —
- Monthly P&I
- —
- Monthly cashflow
- —
- DSCR
- —
- Eligible?
- —
Short-term bridge; refi at stabilization.
Rent comps 24 comps
| Address | Beds | Baths | Sqft | Rent | $/sqft | DOM | Units | Dist |
|---|---|---|---|---|---|---|---|---|
| 4137 Secor Rd Toledo, OH | 1.0–2.0 | 1.0 | 750 | $921 | $1.23 | 14d | 7 | 0.21mi |
| 4030 Elmhurst Rd Apt 2 Toledo, OH | 2.0 | 1.0 | 875 | $900 | $1.03 | 43d | 1 | 0.33mi |
| 4030 Elmhurst Rd Toledo, OH | 2.0 | 1.0 | 800 | $900 | $1.12 | 23d | 1 | 0.33mi |
| 3070 Carskaddon Ave Toledo, OH | 1.0–2.0 | 1.0 | 805 | $1,150 | $1.43 | 14d | 1 | 0.64mi |
| 3519 Secor Rd Toledo, OH | 1.0–2.0 | 1.0 | 728 | $930 | $1.28 | 14d | 5 | 0.74mi |
| 4109 Harvest Ln Toledo, OH | 2.0 | 1.0 | 750 | $1,195 | $1.59 | 14d | 1 | 0.78mi |
| 3838 W Sylvania Ave Toledo, OH | 1.0–2.0 | 1.0 | 725 | $1,195 | $1.65 | 14d | 2 | 0.82mi |
| 3353 W Laskey Rd Unit 2 Toledo, OH | 3.0 | 1.0 | 750 | $850 | $1.13 | 21d | 1 | 0.88mi |
| 3355 W Laskey Rd Toledo, OH | 2.0 | 1.0 | 750 | $850 | $1.13 | 14d | 2 | 0.89mi |
| 3355 W Laskey Rd Apt 24 Toledo, OH | 2.0 | 1.0 | 750 | $850 | $1.13 | 23d | 1 | 0.89mi |
| 3644 Harley Rd Toledo, OH | 2.0 | 1.0 | 1025 | $975 | $0.95 | 23d | 1 | 0.94mi |
| 5080 Secor Rd Toledo, OH | 1.0–2.0 | 1.0–1.5 | 699 | $925 | $1.32 | 43d | 1 | 1.01mi |
| 5133 Secor Rd Toledo, OH | 2.0 | 2.0 | 850 | $1,099 | $1.29 | 23d | 1 | 1.09mi |
| 2301 Portsmouth Ave Toledo, OH | 4.0 | 1.0 | 1335 | $1,395 | $1.04 | 23d | 1 | 1.11mi |
| 2244 W Sylvania Ave Unit 6 Toledo, OH | 2.0 | 1.0 | 800 | $795 | $0.99 | 43d | 1 | 1.13mi |
| 2956 Central Ave Toledo, OH | 2.0 | 2.0 | 1018 | $1,495 | $1.47 | 23d | 1 | 1.16mi |
| 2956 Central Ave Toledo, OH | 2.0 | 1.0 | 999 | $1,445 | $1.45 | 43d | 1 | 1.16mi |
| 3430 Anderson Pkwy Toledo, OH | 3.0 | 2.0 | 1372 | $1,650 | $1.20 | 23d | 1 | 1.19mi |
| 5240 Oakridge Dr Toledo, OH | 2.0 | 1.0 | 872 | $945 | $1.08 | 14d | 1 | 1.23mi |
| 4668 Talmadge Rd Toledo, OH | 1.0–2.0 | 1.0 | 820 | $1,079 | $1.32 | 14d | 1 | 1.32mi |
| 5360 Secor Rd Unit 316 Toledo, OH | 2.0 | 1.0 | 900 | $699 | $0.78 | 23d | 1 | 1.34mi |
| 4102 Garden Estates Dr Unit 4 Toledo, OH | 2.0 | 2.0 | 1200 | $995 | $0.83 | 14d | 1 | 1.35mi |
| 3022 Letchworth Pkwy Toledo, OH | 2.0 | 1.0 | 800 | $970 | $1.21 | 43d | 1 | 1.45mi |
| 3907 Donegal Dr Toledo, OH | 4.0 | 2.0 | 1152 | $1,295 | $1.12 | 23d | 1 | 1.49mi |
Listing history 21 events
-
2026-06-17status $109,900 Pending 3 DOM
-
2026-06-16days on market $109,900 Active 3 DOM
-
2026-06-15days on market $109,900 Active 2 DOM
-
2026-06-14statusdays on market $109,900 Active 1 DOM
-
2026-06-13days on market $109,900 Coming Soon 4 DOM
-
2026-06-10days on market $109,900 Coming Soon 2 DOM
-
2026-06-09remarks 699-char remark
-
2026-06-09pricestatusdays on market $109,900 Coming Soon 1 DOM
-
2026-06-03status $119,900 Active 4 DOM
-
2026-06-02days on market $119,900 Contingent 4 DOM
-
2026-06-01days on market $119,900 Contingent 3 DOM
-
2026-05-31days on market $119,900 Contingent 2 DOM
-
2026-05-30statusdays on market $119,900 Contingent 1 DOM
-
2026-05-15$119,900 Active 609-char remark
-
2026-05-06historical $119,900 609-char remark
-
2025-10-13price $64,000 333-char remark
-
2012-04-25soldstatus $64,000 333-char remark
-
2011-12-13$64,900 333-char remark
-
2000-04-03soldstatus $85,000
-
1996-06-06soldstatus $72,000
-
1986-01-08soldstatus $45,000
ⓘ Source: listings_history table (triggers on properties + properties_extension) + one-shot
backfill from property_details.listing_events for pre-trigger history.
Tax reassessment forecast OH · Partial reset (capped growth)
- Current annual tax
- $2,038 · $170/mo
- Projected year-2 tax
- $2,038 · $170/mo
- Expected delta
- $0/yr ($0/mo · 0.0%)
ⓘ Screening estimate from a state-policy table — verify with the county assessor before closing.
Climate risk First Street
- Flood 1/10 Low FEMA zone X (unshaded) · 0% chance over 30 yrs
- Wildfire 1/10 Low
- Heat 3/10 Moderate 7 d/yr ≥101°F today · 16 d/yr by 30 yrs out
- Wind 2/10 Low
- Air quality 2/10 Low 1 unhealthy d/yr today · 3 by 30 yrs out
Nearby sold comps map
Loading sold comps map…
Walkable amenities ~0.75 mi
Loading nearby amenities…
Taxation est. · year 1
- Rental income
- $13,092
- − Mortgage interest
- −$6,156
- − Property taxes
- −$2,038
- − Insurance
- −$550
- − Repairs & maintenance
- −$1,047
- − Management
- −$1,047
- − Depreciation
- −$3,197
- Taxable loss
- −$944
- Est. tax savings @ 24.0%
- +$226
- After-tax cash flow
- $1,066/yr
For passive investors: Depreciation is non-cash, so a rental often shows a tax loss while cash-flowing — sheltering income. Rental losses are passive: they offset passive income freely, and up to $25,000/yr can offset ordinary (W-2) income if you actively participate and your MAGI is under $100k (phasing out to $0 by $150k); unused losses carry forward. On sale, claimed depreciation is recaptured at up to 25%, and gains may owe capital-gains tax (a 1031 exchange can defer both). Figures are a year-1 estimate at your 24.0% rate — not tax advice; consult a CPA.
Schools (NCES district)
- District
- Washington Local
- NCES district ID
- 3904823
- Math proficiency
- 37% ▼ -20.00%
- Reading proficiency
- 47% ▼ -11.00%
- Median HH income
- $42,105
- Composite
- 35.36/100
- National rank
- #4957
- State rank
- #528 of 656 in OH
Livability — Toledo
- Score
- 66/100
- State rank
- #645
- US rank
- #11442
Category grades
Schools grade is shown separately in the Schools card above.
Census & demographics
- Census place
- Toledo, OH
- County
- Lucas County · 380,724 people
- City population
- 280,811
- Metro
- Toledo, OH
- Population (ZIP)
- 30,780
- Household income
- $64,384
- Rent vs Own
- Severe rent burden
- 917.0
Population outlook (Lucas County) Hauer SSP2
- Today (2025)
- 420,751 people
- By 2030
- 410,187 · -2.5%
- By 2040
- 384,019 · -8.7%
- By 2050
- 355,125 · -15.6%
- By 2075
- 291,683 · -30.7%
- By 2100
- 233,670 · -44.5%
Race, ethnicity, and origin ACS 2023
- Neighborhood character
- Predominantly White (71%)
- Race & ethnicity
- White 71% Black 15% Two or more races 10% Hispanic / Latino 7%
- Hispanic origin (detail)
- Mexican 5%
- Common ancestry
- Romanian 9% Lithuanian 3% Slovak 1%
- Foreign-born
- 2% · Canada
- Languages at home
- 95% English-only · Spanish 3% Arabic 1%
Political lean MEDSL · Lucas
- 2024 margin
- D (+12.6) · D 55.8% · R 43.2%
- 2008→2024 swing
- -18.9pp toward R · 2008: 31.4pp · 2024: 12.6pp
- All cycles
- 2024: D+12.6 2020: D+16.8 2016: D+17.4 2012: D+30.4 2008: D+31.4
Not yet ingested
- Civics
- —
Market trends
- HPI YoY
- ▼ -62.37%
- Current HPI
- 239.1345
- Rent YoY
- ▲ 3.30%
- Metro
- Toledo, OH
- State GDP YoY
- ▲ 1.98%
- F500 in state
- 48
Industry mix (Fortune 500 HQ in OH)
| Industry | F500 HQs | Revenue |
|---|---|---|
| Insurance | 3 | $145B |
|
||
| Industrial Machinery | 3 | $49B |
|
||
| Financial Services | 3 | $24B |
|
||
| Consumer Goods | 2 | $93B |
|
||
| Aerospace / Defense | 2 | $47B |
|
||
| Utilities | 2 | $33B |
|
||
Price history
+144.2% since first listed17 events — show timeline
- 2026-06-17 Pending — NORIS
- 2026-06-13 Listed $109,900 NORIS
- 2026-06-09 Coming Soon $109,900 NORIS
- 2026-06-02 Relisted — NORIS
- 2026-06-02 Listing Removed — NORIS
- 2026-05-29 Listed — NORIS
- 2026-05-29 Listed $119,900 NORIS
- 2026-05-26 Listing Removed — NORIS
- 2026-05-15 Listed $119,900 NORIS
- 2026-05-06 Coming Soon — NORIS
- 2025-10-13 Price Changed $64,000 NORIS
- 2012-04-25 Sold (MLS) $64,000 NORIS
- 2012-02-29 Price Changed $64,900 NORIS
- 2011-12-13 Listed $64,900 NORIS
- 2000-04-03 Sold (Public Records) $85,000 Public Records
- 1996-06-06 Sold (Public Records) $72,000 Public Records
- 1986-01-08 Sold (Public Records) $45,000 Public Records
Property tax history
+1.3%/yrLatest (2025): $2,038 · +1.7% YoY. Source: county tax records.
Cash-flow waterfall
monthlySold comps — $/sqft
last 12 mo · ≤1 miLoading sold comps…