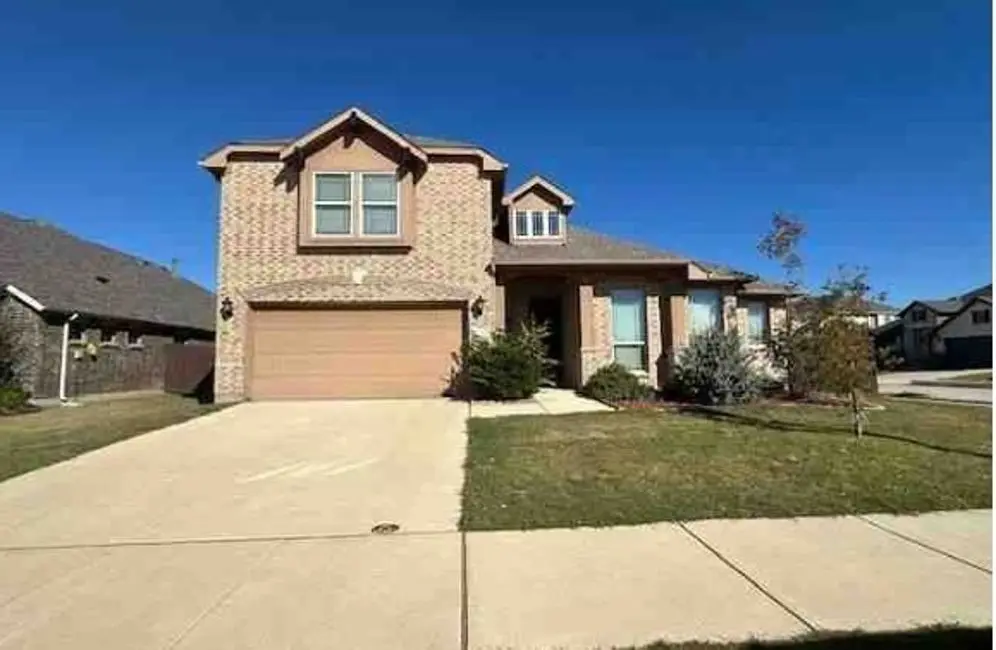
1721 Emma Pearl · Paloma Creek South, TX
Flood risk 1/10 · Minimal
- FEMA flood zone
- X (unshaded)
- Chance of flooding over 30 yrs
- 0.0%
- Est. flood insurance / yr
- $507 – $1,088
Fire risk 4/10 · Minor
- Est. fire insurance / yr
- $1,222 – $2,270
Heat risk 7/10 · Major
- Hot days now (above 109°F)
- 8 days/yr
- Hot days in 30 yrs
- 25 days/yr
Wind risk 4/10 · Minor
- Chance of severe wind over 30 yrs
- 22.0%
Air-quality risk 4/10 · Minor
- Unhealthy air days now
- 4 days/yr
- Unhealthy air days in 30 yrs
- 5 days/yr
Risk factors via First Street. Map © Google.
Why this score? — see what drove the D- grade
The composite is a weighted blend of 9 inputs, each scored 0–100. Each bar is that input's sub-score; the figure is the points it added to the 100-point composite (weight × sub-score).
- ARV discount +15.0/15.0
- Cash flow +7.1/30.0
- 1% rule +4.0/10.0
- Schools +3.5/10.0
- Livability +3.0/5.0
- Condition / age +2.5/5.0
- Rent growth +2.1/5.0
- DSCR +1.3/10.0
- Appreciation +0.0/10.0
$345,000
🖨 Deal sheet 📄 Offer letter ✓ Due diligence
Listing remarks MLS
This property offers 4 bedrooms and 3 full bathrooms
Key facts
- Spacious kitchen
- Built in buffet
- Granite countertops
Tags
Neighborhood map
What this means for you Summary
Snapshot
- This is a 4-bed/3.0-bath single-family listed at $345k.
Deal economics
- At list price, monthly cash flow is $-488 ($-6k/yr) — negative.
- To cash-flow at today's rent, offer at most $259k (25.0% below list).
- To meet the 1% rule (rent ≥ 1% of price), the offer needs to be $310k (10.2% below list).
- Recommended offer: $259k (25.0% below list) — sets the bar for cash-flow.
Location & tenants
- Location reads 60/100 on livability (#1,039 in TX) — a middle-class / working-renter tenant base. Strengths: crime A+, employment A+, housing A+; Watch: schools C-, amenities F, commute F.
- Denton ISD (urban): math 36% / reading 43% proficiency, ranked #383 of 826 in TX (top 46%) — families likely to look elsewhere, expect single-tenant / working-renter base with shorter leases.
- Market conditions: Rents soft (-1.5%/yr); 1306 active listings in the ZIP; 40 comparable units currently listed for rent nearby; rentals at typical pace (median 25d on market — plan ~3-4 weeks tenant-placement turnaround); 45% of comp listings sitting > 30 days — soft ceiling on asking rent; high-income renter base; 10,531 units permitted in Denton County in 2024 (2,713 in 5+ unit buildings).
Forward outlook
- Local home prices are declining (-3.0%/yr); year-one equity from $2k of loan paydown is wiped out by about $10k of value loss. Plan a longer hold.
- Denton County population projected at +66% by 2050 — long-run rental-demand tailwind backs the buy-and-hold thesis.
Negotiation context
- It's been on market 20 days — a 2% lower offer ($340k) is reasonable based on typical stale-listing flexibility.
- 3 sale attempts since 3y ago; this cycle's ask has dropped $48k (12%) from the opening price — seller is motivated, your offer sets the floor, not the list.
Risks & watch-outs
- Watch-outs: property tax is 3.1% of price.
- Climate carrying-cost: extreme-heat days projected 8→25/yr by 2055 (HVAC capex compounding) — expect insurance premiums to compound above CPI over the hold.
Questions for the listing agent
- What do current leases actually rent for vs. the listed asking? Can we see a recent rent roll and the last 12 months of T-12 income?
- Property tax is high relative to price — has the assessment been appealed recently, and will the sale trigger a re-assessment?
- What does the HOA fee cover, when was the last increase, and are there any pending special assessments or reserve-fund shortfalls?
- Is there a deadline driving the sale (1031 exchange, divorce, estate, relocation)? That informs how much negotiation room exists.
- The area grade is low — what's the realistic commute time and amenity access for the typical tenant pool here? Any planned neighborhood developments (good or bad) we should know about?
- What's the average days-on-market for RENTAL listings here right now (not sales)? A rising rental-DOM trend means longer vacancies and softer asking-rent achievability than the comps imply.
- What's the recent tenant-quality profile in this submarket — average credit score on applications, eviction rate, late-payment / NSF rate, and stable-employment percentage? A property-management company in the area should have these aggregated.
- How much new for-sale + rental construction is in the pipeline within 1–3 miles? Heavy new supply typically softens prices + rents 12–24 months out; constrained supply supports both.
Investment metrics
- 1% rule
- 0.90% ✗
- Cap rate
- 4.59%
- Cash-on-cash
- -6.07%
- DSCR
- 0.73
- GRM
- 9.3
CMA / ARV
- ARV (median comp)
- $487,491
- List price
- $345,000
- Delta
- -23.68%
- Verdict
- UNDERPRICED
- Comps
- 20 within 1.0 mi
Show comp detail 12 sales within ~0.75 mi
| Address | Dist | Beds/Ba | Sqft | Sold | Price | $/sf | Match |
|---|---|---|---|---|---|---|---|
| 1604 George Ln | 0.13mi | 4/2.5 | 3,427 (+5%) | 0mo | $429,900 | $125 | 84 |
| 1404 Kittyhawk Dr | 0.32mi | 4/3.5 | 3,409 (+4%) | 3mo | $400,000 | $117 | 74 |
| 1832 Ringtail Dr | 0.25mi | 4/2.5 | 2,877 (-12%) | 2mo | $355,000 | $123 | 64 |
| 937 Horizon Ridge Cir | 0.20mi | 4/3.5 | 2,821 (-14%) | 5mo | $310,000 | $110 | 62 |
| 1404 Canary Dr | 0.30mi | 4/2.5 | 2,877 (-12%) | 3mo | $365,000 | $127 | 61 |
| 1728 Flamingo Dr | 0.40mi | 5/2.5 (+1) | 3,000 (-8%) | 2mo | $349,000 | $116 | 59 |
| 641 Lake Cove Dr | 0.37mi | 4/2.5 | 2,875 (-12%) | 3mo | $425,000 | $148 | 58 |
| 1717 Roadrunner Dr | 0.64mi | 4/4.0 | 3,455 (+6%) | 1mo | $599,000 | $173 | 56 |
| 928 Freesia Dr | 0.56mi | 4/3.5 | 3,535 (+8%) | 3mo | $499,900 | $141 | 56 |
| 1225 Roadrunner Dr | 0.38mi | 4/2.5 | 2,841 (-13%) | 4mo | $380,000 | $134 | 55 |
| 1308 Audubon Dr | 0.52mi | 4/3.0 | 2,783 (-15%) | 3mo | $419,900 | $151 | 48 |
| 2612 Castle Creek Dr | 0.69mi | 5/3.5 (+1) | 3,743 (+14%) | 3mo | $475,000 | $127 | 34 |
Match score weights: distance 35% · size 25% · config 20% · recency 20%. Top-matched comps best support the ARV.
Projected returns pro-forma
-3.0% appreciation · 0.0% rent growth · sell at horizon
- IRR
- -31.0%
- Equity multiple
- 0.01×
- Total profit
- $-95,703
- Equity at exit
- $51,441
- IRR
- -61.6%
- Equity multiple
- -0.62×
- Total profit
- $-156,909
- Equity at exit
- $29,829
Cash invested: $96,600 (down + closing). Projections, not guarantees.
Landlord ↔ Tenant lean methodology
- Overall (STATE)
- 87 Strongly Landlord-Friendly
- State Texas
- 87 Strongly Landlord-Friendly · R+5
- County
- — inherits STATE
- City
- — inherits STATE
ZIP-level market 75068
- Home prices YoY
- -25.5%
- Rents YoY
- -1.5%
- Active inventory
- 1306
- Price-to-rent
- 9.3×
Monthly cashflow live
- Estimated rent
- $3,098 high interval (Pro) →
- Mortgage (P&I)
- −$1,809
- Tax from tax record
- −$891 /mo · $10,690/yr
- Insurance
- −$144
- HOA
- −$92
- Vacancy / Maint / Mgmt
- −$651
- Net cashflow
- $-488
Break-even live
UW: 25.0% down · 7.5% · 30yr · 1.5% tax · 5.0% vac · 8.0% maint · 8.0% mgmt
Financing live
Cash to close
- Down payment
- $86,250
- Closing costs
- $10,350
- Reserves months
- —
- Total cash needed
- —
Loan-product check · same deal, 3 products live
Conventional
25% down · 7.5% · 30yr
- Down + closing
- —
- Monthly P&I
- —
- Monthly cashflow
- —
- DSCR
- —
- Eligible?
- —
Personal DTI + credit; lowest rate.
DSCR
20% down · 8.5% · 30yr
- Down + closing
- —
- Monthly P&I
- —
- Monthly cashflow
- —
- DSCR
- —
- Eligible?
- —
No personal income docs; deal must DSCR.
Hard money
10% down · 12.0% · 12mo
- Down + closing
- —
- Monthly P&I
- —
- Monthly cashflow
- —
- DSCR
- —
- Eligible?
- —
Short-term bridge; refi at stabilization.
Rent comps 40 comps
| Address | Beds | Baths | Sqft | Rent | $/sqft | DOM | Units | Dist |
|---|---|---|---|---|---|---|---|---|
| 700 Sedona St Little Elm, TX | 5.0 | 4.5 | 3693 | $3,500 | $0.95 | 43d | 1 | 0.04mi |
| 905 Sedona St Little Elm, TX | 4.0 | 3.0 | 2456 | $3,200 | $1.30 | 18d | 1 | 0.11mi |
| 1716 Ringtail Dr Little Elm, TX | 4.0 | 2.5 | 2998 | $2,730 | $0.91 | 43d | 1 | 0.18mi |
| 1808 Ringtail Dr Little Elm, TX | 5.0 | 3.0 | 2800 | $3,390 | $1.21 | 4d | 1 | 0.20mi |
| 1708 Kittyhawk Dr Little Elm, TX | 4.0 | 3.5 | 2928 | $2,700 | $0.92 | 18d | 1 | 0.23mi |
| 1820 Rosson Rd Little Elm, TX | 4.0 | 3.5 | 2980 | $3,475 | $1.17 | 24d | 1 | 0.28mi |
| 1412 Kittyhawk Dr Little Elm, TX | 5.0 | 3.5 | 2928 | $3,500 | $1.20 | 17d | 1 | 0.31mi |
| 1705 Nighthawk Dr Little Elm, TX | 4.0 | 2.5 | 2998 | $3,249 | $1.08 | 6d | 1 | 0.31mi |
| 601 Hummingbird Dr Little Elm, TX | 4.0 | 2.5 | 2868 | $7,500 | $2.62 | 43d | 1 | 0.31mi |
| 404 Hummingbird Dr Little Elm, TX | 4.0 | 3.5 | 3447 | $2,800 | $0.81 | 24d | 1 | 0.36mi |
| 1200 Pigeon Hawk Dr Little Elm, TX | 4.0 | 3.0 | 2510 | $2,695 | $1.07 | 43d | 1 | 0.36mi |
| 1928 Michelle Creek Dr Little Elm, TX | 4.0 | 2.5 | 2409 | $2,450 | $1.02 | 43d | 1 | 0.37mi |
| 1220 Upland Dove Dr Little Elm, TX | 4.0 | 4.5 | 3430 | $3,200 | $0.93 | 43d | 1 | 0.42mi |
| 1809 Turtledove Dr Little Elm, TX | 4.0 | 2.0 | 2673 | $2,366 | $0.89 | 2d | 1 | 0.43mi |
| 1413 Wood Duck Dr Little Elm, TX | 4.0 | 3.0 | 3283 | $3,200 | $0.97 | 43d | 1 | 0.45mi |
| 1129 Quail Dove Dr Little Elm, TX | 4.0 | 2.5 | 3125 | $2,795 | $0.89 | 20d | 1 | 0.51mi |
| 904 Sunset Haven Dr Little Elm, TX | 4.0 | 4.5 | 3300 | $3,200 | $0.97 | 43d | 1 | 0.51mi |
| 1501 Lake Grove Dr Little Elm, TX | 5.0 | 4.5 | 3361 | $3,100 | $0.92 | 20d | 1 | 0.54mi |
| 608 Partridge Dr Aubrey, TX | 4.0 | 2.5 | 2476 | $2,600 | $1.05 | 43d | 1 | 0.66mi |
| 1220 Mockingbird Dr Aubrey, TX | 4.0 | 2.5 | 3009 | $3,000 | $1.00 | 18d | 1 | 0.71mi |
| 2208 Gregory Creek Dr Little Elm, TX | 5.0 | 2.5 | 3262 | $2,900 | $0.89 | 18d | 1 | 0.72mi |
| 1305 Rembrandt Dr Little Elm, TX | 4.0 | 2.5 | 2363 | $2,490 | $1.05 | 18d | 1 | 0.76mi |
| 721 Kinghaven Dr Little Elm, TX | 4.0 | 3.5 | 3500 | $3,145 | $0.90 | 18d | 1 | 0.78mi |
| 1237 Mallard Crk Aubrey, TX | 4.0 | 2.5 | 2761 | $6,200 | $2.25 | 43d | 1 | 0.78mi |
| 1356 Francesca Dr Little Elm, TX | 5.0 | 4.0 | 3479 | $3,300 | $0.95 | 43d | 1 | 0.79mi |
| 850 Warbler Aubrey, TX | 4.0 | 3.0 | 2338 | $2,350 | $1.01 | 43d | 1 | 0.80mi |
| 1713 Lake Pine Dr Little Elm, TX | 4.0 | 2.5 | 2792 | $2,500 | $0.90 | 43d | 1 | 0.84mi |
| 1420 Abby Creek Dr Little Elm, TX | 4.0 | 2.5 | 2800 | $3,299 | $1.18 | 2d | 1 | 0.85mi |
| 925 Warbler Aubrey, TX | 5.0 | 3.5 | 3055 | $3,395 | $1.11 | 43d | 1 | 0.89mi |
| 1817 Heron Dr Aubrey, TX | 4.0 | 2.5 | 2673 | $2,599 | $0.97 | 7d | 1 | 0.91mi |
| 1016 Aviary Aubrey, TX | 4.0 | 2.5 | 2583 | $2,500 | $0.97 | 43d | 1 | 0.95mi |
| 2024 Gayla Creek Dr Little Elm, TX | 5.0 | 3.5 | 3315 | $2,900 | $0.87 | 43d | 1 | 1.02mi |
| 956 Lost Mine Trl Little Elm, TX | 4.0 | 2.5 | 2498 | $2,690 | $1.08 | 43d | 1 | 1.07mi |
| 1616 Lake Way Dr Little Elm, TX | 4.0 | 2.5 | 2926 | $2,600 | $0.89 | 20d | 1 | 1.07mi |
| 1072 Aviary Aubrey, TX | 4.0 | 2.5 | 2583 | $2,445 | $0.95 | 12d | 1 | 1.07mi |
| 936 Apeldoorn Trl Little Elm, TX | 4.0 | 2.5 | 2416 | $2,650 | $1.10 | 12d | 1 | 1.08mi |
| 813 Lake Forest Trl Little Elm, TX | 5.0 | 3.5 | 2701 | $2,600 | $0.96 | 24d | 1 | 1.09mi |
| 937 Lost Mine Trl Providence Village, TX | 4.0 | 2.5 | 2498 | $2,700 | $1.08 | 24d | 1 | 1.09mi |
| 845 Lake Meadow Ln Little Elm, TX | 4.0 | 2.5 | 2437 | $2,550 | $1.05 | 7d | 1 | 1.09mi |
| 1121 Golden Eagle Ct Aubrey, TX | 4.0 | 2.5 | 2338 | $2,600 | $1.11 | 43d | 1 | 1.12mi |
HOA detail
- Monthly dues
- $92 · $1,104/yr
Listing history 26 events
-
2026-06-13statusdays on market $345,000 Pending 20 DOM
-
2026-06-09days on market $345,000 Active Contingent 17 DOM
-
2026-06-08days on market $345,000 Active Contingent 16 DOM
-
2026-06-07days on market $345,000 Active Contingent 15 DOM
-
2026-06-04statusdays on market $345,000 Active Contingent 12 DOM
-
2026-06-03days on market $345,000 Active 11 DOM
-
2026-06-02days on market $345,000 Active 10 DOM
-
2026-06-01days on market $345,000 Active 9 DOM
-
2026-05-31days on market $345,000 Active 8 DOM
-
2026-04-10price $372,040 52-char remark
Show marketing remark (52 chars)
This property offers 4 bedrooms and 3 full bathrooms
-
2026-02-26$393,000 Active 52-char remark
Show marketing remark (52 chars)
This property offers 4 bedrooms and 3 full bathrooms
-
2025-07-31historical
-
2025-06-27price $508,000
-
2025-05-28price $515,000
-
2025-05-08price $518,000
-
2025-04-10$525,000 Active
-
2023-12-05soldstatus
-
2023-12-04soldstatus Closed
-
2023-11-05status Pending
-
2023-10-30historical Active Option Contract
-
2023-10-26price $463,000
-
2023-09-14price $473,000
-
2023-08-31price $481,000
-
2023-07-27price $491,000
-
2023-07-11$499,000 Active
-
2023-06-14soldstatus
ⓘ Source: listings_history table (triggers on properties + properties_extension) + one-shot
backfill from property_details.listing_events for pre-trigger history.
Tax reassessment forecast TX · Resets to sale price
- Current annual tax
- $10,690 · $891/mo
- Projected year-2 tax
- $10,690 · $891/mo
- Expected delta
- $0/yr ($0/mo · 0.0%)
ⓘ Screening estimate from a state-policy table — verify with the county assessor before closing.
Climate risk First Street
- Flood 1/10 Low FEMA zone X (unshaded) · 0% chance over 30 yrs
- Wildfire 4/10 Moderate
- Heat 7/10 Severe 8 d/yr ≥109°F today · 25 d/yr by 30 yrs out
- Wind 4/10 Moderate 22% chance of damaging wind over 30 yrs
- Air quality 4/10 Moderate 4 unhealthy d/yr today · 5 by 30 yrs out
Nearby sold comps map
Loading sold comps map…
Walkable amenities ~0.75 mi
Loading nearby amenities…
Taxation est. · year 1
- Rental income
- $37,176
- − Mortgage interest
- −$19,325
- − Property taxes
- −$10,690
- − Insurance
- −$1,725
- − Repairs & maintenance
- −$2,974
- − Management
- −$2,974
- − HOA
- −$1,104
- − Depreciation
- −$10,036
- Taxable loss
- −$11,653
- Est. tax savings @ 24.0%
- +$2,797
- After-tax cash flow
- $-3,064/yr
For passive investors: Depreciation is non-cash, so a rental often shows a tax loss while cash-flowing — sheltering income. Rental losses are passive: they offset passive income freely, and up to $25,000/yr can offset ordinary (W-2) income if you actively participate and your MAGI is under $100k (phasing out to $0 by $150k); unused losses carry forward. On sale, claimed depreciation is recaptured at up to 25%, and gains may owe capital-gains tax (a 1031 exchange can defer both). Figures are a year-1 estimate at your 24.0% rate — not tax advice; consult a CPA.
Schools (NCES district)
- District
- Denton ISD
- NCES district ID
- 4816740
- Math proficiency
- 36% ▼ -18.00%
- Reading proficiency
- 43% ▼ -9.00%
- Median HH income
- $58,913
- Composite
- 34.91/100
- National rank
- #5075
- State rank
- #383 of 826 in TX
Livability — Paloma Creek South
- Score
- 60/100
- State rank
- #1039
- US rank
- #18503
Category grades
Schools grade is shown separately in the Schools card above.
Census & demographics
- Census place
- Paloma Creek South, TX
- County
- Denton County · 901,654 people
- Metro
- Dallas-Fort Worth-Arlington, TX
- Population (ZIP)
- 72,710
- Household income
- $126,635
- Rent vs Own
- Severe rent burden
- 829.0
Population outlook (Denton County) Hauer SSP2
- Today (2025)
- 1,053,010 people
- By 2030
- 1,192,269 · +13.2%
- By 2040
- 1,472,920 · +39.9%
- By 2050
- 1,746,506 · +65.9%
- By 2075
- 2,358,497 · +124.0%
- By 2100
- 2,779,183 · +163.9%
Race, ethnicity, and origin ACS 2023
- Neighborhood character
- Highly diverse neighborhood (Simpson 0.74)
- Race & ethnicity
- White 40% Hispanic / Latino 23% Black 19% Two or more races 15% Asian 12% Native American 1%
- Hispanic origin (detail)
- Mexican 17%
- Common ancestry
- Lithuanian 2% Italian 2% Slovak 1%
- Foreign-born
- 19% · Canada, South Korea, China
- Languages at home
- 71% English-only · Spanish 15% Other Asian/Pacific 5% Other Indo-European 4%
Political lean MEDSL · Denton
- 2024 margin
- R (+13.2) · D 42.7% · R 55.8% · Other 1.5%
- 2008→2024 swing
- +11.0pp toward D · 2008: -24.2pp · 2024: -13.2pp
- All cycles
- 2024: R+13.2 2020: R+8.1 2016: R+20.2 2012: R+31.7 2008: R+24.2
Not yet ingested
- Civics
- —
Market trends
- HPI YoY
- ▼ -85.41%
- Current HPI
- 249.755
- Rent YoY
- ▼ -1.50%
- Metro
- Dallas-Fort Worth-Arlington, TX
- State GDP YoY
- ▲ 3.95%
- F500 in state
- 110
Industry mix (Fortune 500 HQ in TX)
| Industry | F500 HQs | Revenue |
|---|---|---|
| Energy | 16 | $1,198B |
|
||
| Technology | 5 | $198B |
|
||
| Engineering / Construction | 4 | $72B |
|
||
| Energy Services | 3 | $60B |
|
||
| Utilities | 3 | $41B |
|
||
| Healthcare | 2 | $330B |
|
||
Price history
-25.4% since first listed17 events — show timeline
- 2026-04-10 Price Changed $372,040 HARMLS
- 2026-02-26 Listed $393,000 HARMLS
- 2025-07-31 Listing Removed — NTREIS
- 2025-06-27 Price Changed $508,000 NTREIS
- 2025-05-28 Price Changed $515,000 NTREIS
- 2025-05-08 Price Changed $518,000 NTREIS
- 2025-04-10 Listed $525,000 NTREIS
- 2023-12-05 Sold (Public Records) — Public Records
- 2023-12-04 Sold (MLS) — NTREIS
- 2023-11-05 Pending — NTREIS
- 2023-10-30 Contingent — NTREIS
- 2023-10-26 Price Changed $463,000 NTREIS
- 2023-09-14 Price Changed $473,000 NTREIS
- 2023-08-31 Price Changed $481,000 NTREIS
- 2023-07-27 Price Changed $491,000 NTREIS
- 2023-07-11 Listed $499,000 NTREIS
- 2023-06-14 Sold (Public Records) — Public Records
Property tax history
+40.3%/yrLatest (2025): $10,690 · -6.2% YoY. Source: county tax records.
Cash-flow waterfall
monthlySold comps — $/sqft
last 12 mo · ≤1 miLoading sold comps…