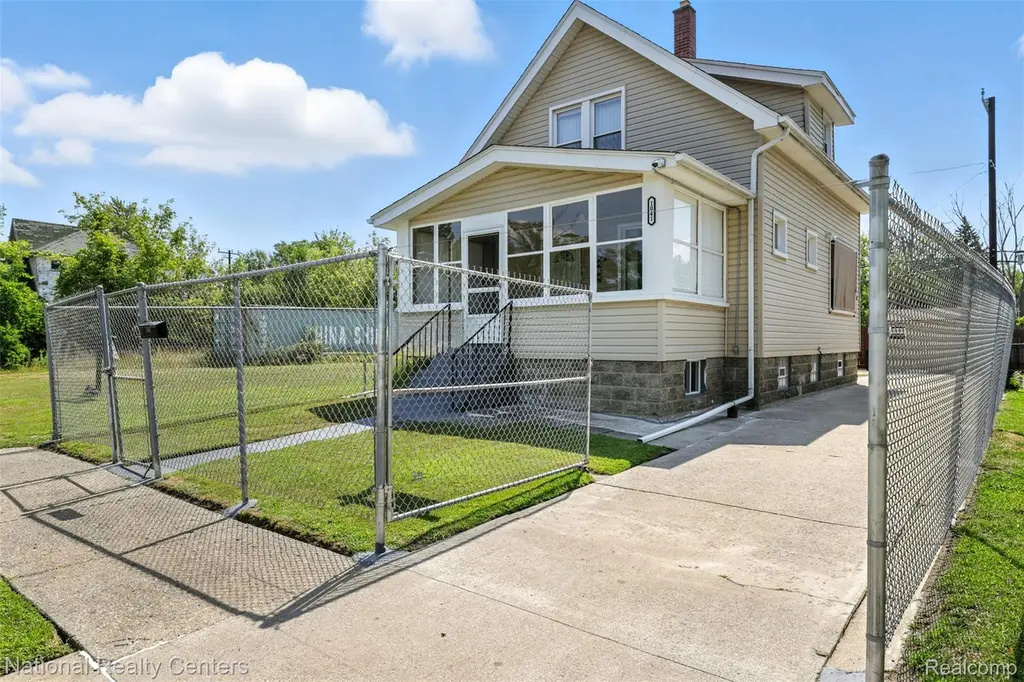
1041 Adeline St · Detroit, MI
Flood risk 1/10 · Minimal
- FEMA flood zone
- X (unshaded)
- Chance of flooding over 30 yrs
- 0.0%
- Est. flood insurance / yr
- $473 – $860
Fire risk 1/10 · Minimal
- Est. fire insurance / yr
- $784 – $1,456
Heat risk 3/10 · Minor
- Hot days now (above 97°F)
- 7 days/yr
- Hot days in 30 yrs
- 15 days/yr
Wind risk 2/10 · Minimal
- Chance of severe wind over 30 yrs
- —
Air-quality risk 4/10 · Minor
- Unhealthy air days now
- 4 days/yr
- Unhealthy air days in 30 yrs
- 6 days/yr
Risk factors via First Street. Map © Google.
Why this score? — see what drove the D+ grade
The composite is a weighted blend of 9 inputs, each scored 0–100. Each bar is that input's sub-score; the figure is the points it added to the 100-point composite (weight × sub-score).
- Cash flow +16.8/30.0
- ARV discount +12.9/15.0
- DSCR +5.2/10.0
- 1% rule +4.6/10.0
- Livability +3.7/5.0
- Rent growth +2.5/5.0
- Condition / age +2.5/5.0
- Schools +1.3/10.0
- Appreciation +0.0/10.0
$139,900
🖨 Deal sheet 📄 Offer letter ✓ Due diligence
Listing remarks MLS
Opportunity meets location in the heart of Detroit’s Woodward Corridor. A move-in-ready home perfectly positioned between Downtown Detroit energy and the charm of neighboring Ferndale and Royal Oak. Whether you work in the city, love local culture, or want quick access to everything without paying premium suburb prices, this address delivers. Inside, you will find thoughtful updates that blend classic Detroit character with modern comfort. Bright living spaces, clean finishes, and an efficient layout make everyday living simple and inviting. It is the kind of home that feels easy to maintain, easy to enjoy, easy to call your own. Outside, you are minutes from Woodward Avenue, major freeways, local restaurants, nightlife, parks, and the ongoing investment transforming this corridor. This is an area where momentum is real and growth is visible. Why rent when you can own a location this connected? If you have been waiting for a home that balances price, position, and potential, this is: 1041 Adeline Street. Smart move. Strong location. Detroit living done right.
Key facts
- Thoughtful updates
- Bright living spaces
- Local restaurants
Tags
Neighborhood map
What this means for you Summary
Snapshot
- This is a 3-bed/1.0-bath single-family listed at $140k.
Deal economics
- At list price, monthly cash flow is $90 ($1k/yr) — positive.
- The deal already cash-flows at list — no discount required.
- To meet the 1% rule (rent ≥ 1% of price), the offer needs to be $134k (4.3% below list).
- Recommended offer: $127k (9.0% below list) — sets the bar for market timing.
- Cap rate 7.1% vs local median 10.2% in Detroit — below-typical yield; the buyer is paying a premium for something (appreciation thesis, condition, location) that the cap rate doesn't capture.
Location & tenants
- Location reads 73/100 on livability (#218 in MI) — a middle-class / working-renter tenant base. Strengths: amenities A+, commute A+, cost of living A+; Watch: schools F, crime F, employment F.
- Detroit Public Schools Community District (urban): math 10% / reading 24% proficiency, ranked #499 of 540 in MI (top 92%) — low school quality limits family demand, transient renter base, plan for 1-2y turnover; 90% free/reduced lunch — lower-income household profile, screen leases tightly.
- Market conditions: 216 active listings in the ZIP; 27 comparable units currently listed for rent nearby; rentals at typical pace (median 25d on market — plan ~3-4 weeks tenant-placement turnaround); lower-income renter base — watch delinquency; 2,639 units permitted in Wayne County in 2024 (1,216 in 5+ unit buildings).
- This rent runs 42% of the median local income ($38k/yr) — at the standard rent-burdened threshold; future hikes will face affordability resistance.
Forward outlook
- Local home prices are declining (-3.0%/yr); year-one equity from $967 of loan paydown is wiped out by about $4k of value loss. Plan a longer hold.
- Wayne County population projected at -17% by 2050 — secular population decline; favor cash flow + early exit over multi-decade hold.
Negotiation context
- It's been on market 119 days — a 9% lower offer ($127k) is reasonable based on typical stale-listing flexibility.
- 14 sale attempts since 9y ago with the ask held roughly flat each time — persistent listings suggest the price (not the market) is what's stuck; bring a comps-based counter.
Risks & watch-outs
- Watch-outs: built in 1919 — expect roof / HVAC / electrical / plumbing capex.
Questions for the listing agent
- It's been on market 119 days. Have you received any prior offers? Is the seller open to a 9% concession, seller financing, or rate buy-down credit?
- Built in 1919 — when were the roof, HVAC, electrical panel, plumbing, and water heater last replaced?
- Why hasn't it sold? Are there any deal-killer items the seller is aware of (foundation, flood, title, zoning, code violations)?
- Is there a deadline driving the sale (1031 exchange, divorce, estate, relocation)? That informs how much negotiation room exists.
- Schools are F-rated, which usually means shorter tenancies and higher turnover. Who's the typical renter profile here, and what's been the actual vacancy rate?
- Crime grade is F in this area — have there been break-ins, vandalism, or insurance claims at this property in the last 3 years? What carrier currently insures it and at what premium?
- The area grade is low — what's the realistic commute time and amenity access for the typical tenant pool here? Any planned neighborhood developments (good or bad) we should know about?
- What's the average days-on-market for RENTAL listings here right now (not sales)? A rising rental-DOM trend means longer vacancies and softer asking-rent achievability than the comps imply.
- What's the recent tenant-quality profile in this submarket — average credit score on applications, eviction rate, late-payment / NSF rate, and stable-employment percentage? A property-management company in the area should have these aggregated.
- How much new for-sale + rental construction is in the pipeline within 1–3 miles? Heavy new supply typically softens prices + rents 12–24 months out; constrained supply supports both.
Investment metrics
- 1% rule
- 0.96% ✗
- Cap rate
- 7.07%
- Cash-on-cash
- 2.77%
- DSCR
- 1.12
- GRM
- 8.7
CMA / ARV
- ARV (median comp)
- $158,978
- List price
- $139,900
- Delta
- -12.00%
- Verdict
- UNDERPRICED
- Comps
- 20 within 1.0 mi
Show comp detail 3 sales within ~0.75 mi
| Address | Dist | Beds/Ba | Sqft | Sold | Price | $/sf | Match |
|---|---|---|---|---|---|---|---|
| 1051 Fernhill St | 0.06mi | 3/1.0 | 1,012 (+14%) | 21mo | $22,500 | $22 | 56 |
| 541 E Bennett Ave | 0.68mi | 3/1.0 | 844 (-4%) | 7mo | $165,000 | $195 | 55 |
| 384 E Chesterfield St | 0.72mi | 3/2.0 | 1,006 (+14%) | 2mo | $252,500 | $251 | 38 |
Match score weights: distance 35% · size 25% · config 20% · recency 20%. Top-matched comps best support the ARV.
Projected returns pro-forma
-3.0% appreciation · 3.0% rent growth · sell at horizon
- IRR
- -11.9%
- Equity multiple
- 0.57×
- Total profit
- $-16,890
- Equity at exit
- $20,860
- IRR
- -2.7%
- Equity multiple
- 0.82×
- Total profit
- $-7,210
- Equity at exit
- $12,096
Cash invested: $39,172 (down + closing). Projections, not guarantees.
Landlord ↔ Tenant lean methodology
- Overall (STATE)
- 62 Landlord-Friendly
- State Michigan
- 62 Landlord-Friendly · EVEN
- County
- — inherits STATE
- City
- — inherits STATE
ZIP-level market 48203
- Home prices YoY
- -23.3%
- Active inventory
- 216
- Price-to-rent
- 8.7×
Monthly cashflow live
- Estimated rent
- $1,338 high interval (Pro) →
- Mortgage (P&I)
- −$734
- Tax est. 1.5%
- −$175 /mo · $2,098/yr
- Insurance
- −$58
- HOA
- −$0
- Vacancy / Maint / Mgmt
- −$281
- Net cashflow
- $90
Break-even live
UW: 25.0% down · 7.5% · 30yr · 1.5% tax · 5.0% vac · 8.0% maint · 8.0% mgmt
Financing live
Cash to close
- Down payment
- $34,975
- Closing costs
- $4,197
- Reserves months
- —
- Total cash needed
- —
Loan-product check · same deal, 3 products live
Conventional
25% down · 7.5% · 30yr
- Down + closing
- —
- Monthly P&I
- —
- Monthly cashflow
- —
- DSCR
- —
- Eligible?
- —
Personal DTI + credit; lowest rate.
DSCR
20% down · 8.5% · 30yr
- Down + closing
- —
- Monthly P&I
- —
- Monthly cashflow
- —
- DSCR
- —
- Eligible?
- —
No personal income docs; deal must DSCR.
Hard money
10% down · 12.0% · 12mo
- Down + closing
- —
- Monthly P&I
- —
- Monthly cashflow
- —
- DSCR
- —
- Eligible?
- —
Short-term bridge; refi at stabilization.
Rent comps 27 comps
| Address | Beds | Baths | Sqft | Rent | $/sqft | DOM | Units | Dist |
|---|---|---|---|---|---|---|---|---|
| 1291 W State Fair Ave Detroit, MI | 1.0–2.0 | 1.0 | 700 | $950 | $1.36 | 12d | 2 | 0.21mi |
| 404 W Golden Gate Highland Park, MI | 2.0 | 1.0 | 1050 | $1,100 | $1.05 | 43d | 1 | 0.73mi |
| 406 W Goldengate St Detroit, MI | 2.0 | 1.0 | 1050 | $1,100 | $1.05 | 43d | 1 | 0.73mi |
| 19703 Keating St Highland Park, MI | 3.0 | 1.0 | 1000 | $1,200 | $1.20 | 16d | 1 | 0.73mi |
| 155 W George Ave Hazel Park, MI | 2.0 | 1.0 | 725 | $1,000 | $1.38 | 24d | 1 | 0.85mi |
| 1561 E Webster St Ferndale, MI | 2.0 | 1.0 | 939 | $1,600 | $1.70 | 24d | 1 | 0.86mi |
| 790 Jewell St Ferndale, MI | 2.0 | 1.0 | 800 | $1,445 | $1.81 | 24d | 1 | 0.91mi |
| 226 Fielding St Ferndale, MI | 2.0 | 1.0 | 1000 | $1,500 | $1.50 | 24d | 1 | 1.07mi |
| 224 Fielding St Ferndale, MI | 2.0 | 1.0 | 1000 | $1,800 | $1.80 | 24d | 1 | 1.08mi |
| 17765 Manderson Rd Unit 8 Highland Park, MI | 2.0 | 1.0 | 1000 | $1,215 | $1.22 | 2d | 1 | 1.08mi |
| 17765 Manderson Rd Unit 14 Highland Park, MI | 2.0 | 1.0 | 1000 | $1,175 | $1.18 | 43d | 1 | 1.08mi |
| 407 E Hayes Ave Hazel Park, MI | 3.0 | 1.0 | 1000 | $1,750 | $1.75 | 24d | 1 | 1.08mi |
| 353 W Webster St Ferndale, MI | 2.0 | 1.0 | 900 | $1,525 | $1.69 | 16d | 1 | 1.09mi |
| 20129 Stratford Rd Unit 2 Detroit, MI | 2.0 | 1.0 | 1100 | $1,223 | $1.11 | 24d | 1 | 1.14mi |
| 931 Covington Dr Unit 202 Highland Park, MI | 2.0 | 2.0 | 550 | $1,400 | $2.55 | 43d | 1 | 1.17mi |
| 20643 Stratford Rd Unit 1 Detroit, MI | 2.0 | 1.5 | 1000 | $1,250 | $1.25 | 43d | 1 | 1.24mi |
| 730 Whitmore Rd Detroit, MI | 1.0–2.0 | 1.0 | 850 | $850 | $1.00 | 43d | 3 | 1.26mi |
| 90 W Meyers Ave Hazel Park, MI | 2.0 | 1.0 | 831 | $1,800 | $2.17 | 24d | 1 | 1.26mi |
| 17449 Manderson Rd Unit 1 Detroit, MI | 2.0 | 1.0 | 750 | $1,150 | $1.53 | 24d | 1 | 1.31mi |
| 1019 E Hayes Ave Unit 1032331P Hazel Park, MI | 3.0 | 1.0 | 1033 | $5,301 | $5.13 | 1d | 1 | 1.35mi |
| 941 Merton Rd Highland Park, MI | 2.0 | 1.0 | 850 | $1,000 | $1.18 | 43d | 1 | 1.37mi |
| 19031 Livernois Unit F Detroit, MI | 2.0 | 2.0 | 1100 | $2,135 | $1.94 | 43d | 1 | 1.45mi |
| 901 Saint Louis St Unit 901-02 Ferndale, MI | 2.0 | 1.0 | 800 | $1,395 | $1.74 | 24d | 1 | 1.47mi |
| 901 Saint Louis St Ferndale, MI | 2.0 | 1.0 | 800 | $1,395 | $1.74 | 43d | 1 | 1.47mi |
| 2023 Ardmore Dr Ferndale, MI | 2.0 | 1.0 | 771 | $1,250 | $1.62 | 24d | 1 | 1.47mi |
| 20038 Santa Rosa Dr Detroit, MI | 3.0 | 1.0 | 927 | $1,300 | $1.40 | 17d | 1 | 1.48mi |
| 1211 E Bernhard Ave Hazel Park, MI | 2.0 | 1.0 | 721 | $1,500 | $2.08 | 24d | 1 | 1.49mi |
Listing history 50 events
-
2026-06-18days on market $139,900 Active 119 DOM
-
2026-06-17days on market $139,900 Active 118 DOM
-
2026-06-15days on market $139,900 Active 116 DOM
-
2026-06-13days on market $139,900 Active 114 DOM
-
2026-06-13days on market $139,900 Active 113 DOM
-
2026-06-09days on market $139,900 Active 110 DOM
-
2026-06-08days on market $139,900 Active 109 DOM
-
2026-06-07statusdays on market $139,900 Active 108 DOM
-
2026-06-04days on market $139,900 Active Under Contract 105 DOM
-
2026-06-03days on market $139,900 Active Under Contract 104 DOM
-
2026-06-01days on market $139,900 Active Under Contract 102 DOM
-
2026-05-31days on market $139,900 Active Under Contract 101 DOM
-
2026-05-06historical Active Under Contract 1081-char remark
Show marketing remark (1075 chars)
Opportunity meets location in the heart of Detroit's Woodward Corridor. A move-in-ready home perfectly positioned between Downtown Detroit energy and the charm of neighboring Ferndale and Royal Oak. Whether you work in the city, love local culture, or want quick access to everything without paying premium suburb prices, this address delivers. Inside, you will find thoughtful updates that blend classic Detroit character with modern comfort. Bright living spaces, clean finishes, and an efficient layout make everyday living simple and inviting. It is the kind of home that feels easy to maintain, easy to enjoy, easy to call your own. Outside, you are minutes from Woodward Avenue, major freeways, local restaurants, nightlife, parks, and the ongoing investment transforming this corridor. This is an area where momentum is real and growth is visible. Why rent when you can own a location this connected? If you have been waiting for a home that balances price, position, and potential, this is: 1041 Adeline Street. Smart move. Strong location. Detroit living done right.
-
2026-05-06historical Accepting Backup Offers 1075-char remark
Show marketing remark (1075 chars)
Opportunity meets location in the heart of Detroit's Woodward Corridor. A move-in-ready home perfectly positioned between Downtown Detroit energy and the charm of neighboring Ferndale and Royal Oak. Whether you work in the city, love local culture, or want quick access to everything without paying premium suburb prices, this address delivers. Inside, you will find thoughtful updates that blend classic Detroit character with modern comfort. Bright living spaces, clean finishes, and an efficient layout make everyday living simple and inviting. It is the kind of home that feels easy to maintain, easy to enjoy, easy to call your own. Outside, you are minutes from Woodward Avenue, major freeways, local restaurants, nightlife, parks, and the ongoing investment transforming this corridor. This is an area where momentum is real and growth is visible. Why rent when you can own a location this connected? If you have been waiting for a home that balances price, position, and potential, this is: 1041 Adeline Street. Smart move. Strong location. Detroit living done right.
-
2026-02-19$139,900 Active 1081-char remark
Show marketing remark (1075 chars)
Opportunity meets location in the heart of Detroit's Woodward Corridor. A move-in-ready home perfectly positioned between Downtown Detroit energy and the charm of neighboring Ferndale and Royal Oak. Whether you work in the city, love local culture, or want quick access to everything without paying premium suburb prices, this address delivers. Inside, you will find thoughtful updates that blend classic Detroit character with modern comfort. Bright living spaces, clean finishes, and an efficient layout make everyday living simple and inviting. It is the kind of home that feels easy to maintain, easy to enjoy, easy to call your own. Outside, you are minutes from Woodward Avenue, major freeways, local restaurants, nightlife, parks, and the ongoing investment transforming this corridor. This is an area where momentum is real and growth is visible. Why rent when you can own a location this connected? If you have been waiting for a home that balances price, position, and potential, this is: 1041 Adeline Street. Smart move. Strong location. Detroit living done right.
-
2026-02-19$139,900 Active 1075-char remark
Show marketing remark (1075 chars)
Opportunity meets location in the heart of Detroit's Woodward Corridor. A move-in-ready home perfectly positioned between Downtown Detroit energy and the charm of neighboring Ferndale and Royal Oak. Whether you work in the city, love local culture, or want quick access to everything without paying premium suburb prices, this address delivers. Inside, you will find thoughtful updates that blend classic Detroit character with modern comfort. Bright living spaces, clean finishes, and an efficient layout make everyday living simple and inviting. It is the kind of home that feels easy to maintain, easy to enjoy, easy to call your own. Outside, you are minutes from Woodward Avenue, major freeways, local restaurants, nightlife, parks, and the ongoing investment transforming this corridor. This is an area where momentum is real and growth is visible. Why rent when you can own a location this connected? If you have been waiting for a home that balances price, position, and potential, this is: 1041 Adeline Street. Smart move. Strong location. Detroit living done right.
-
2026-02-15historical
-
2026-02-15historical
-
2025-08-14$179,995 Active
-
2025-08-14$179,995 Active
-
2021-04-20historical
-
2021-04-20historical
-
2021-02-26price $89,900
-
2021-02-26price $89,900
-
2021-01-28$94,900 Active
-
2021-01-28$94,900 Active
-
2021-01-25historical
-
2021-01-25historical
-
2020-09-11historical
-
2020-09-11historical
-
2020-08-04$74,900 Active
-
2020-08-04historical
-
2020-08-04$74,900 Active
-
2020-08-04historical
-
2020-07-17price $77,500
-
2020-07-16price $77,500
-
2020-06-21price $79,900
-
2020-06-21price $79,900
-
2020-06-14price $84,900
-
2020-06-13price $84,900
-
2020-06-08price $87,900
-
2020-06-08price $87,900
-
2020-05-03$90,000 Active
-
2020-05-02historical
-
2020-05-02$90,000 Active
-
2017-08-21historical
-
2017-08-21historical
-
2017-08-05price $75,000
-
2017-08-05status Active
-
2017-08-04price $75,000
ⓘ Source: listings_history table (triggers on properties + properties_extension) + one-shot
backfill from property_details.listing_events for pre-trigger history.
Climate risk First Street
- Flood 1/10 Low FEMA zone X (unshaded) · 0% chance over 30 yrs
- Wildfire 1/10 Low
- Heat 3/10 Moderate 7 d/yr ≥97°F today · 15 d/yr by 30 yrs out
- Wind 2/10 Low
- Air quality 4/10 Moderate 4 unhealthy d/yr today · 6 by 30 yrs out
Nearby sold comps map
Loading sold comps map…
Walkable amenities ~0.75 mi
Loading nearby amenities…
Taxation est. · year 1
- Rental income
- $16,059
- − Mortgage interest
- −$7,837
- − Property taxes
- −$2,098
- − Insurance
- −$700
- − Repairs & maintenance
- −$1,285
- − Management
- −$1,285
- − Depreciation
- −$4,070
- Taxable loss
- −$1,215
- Est. tax savings @ 24.0%
- +$291
- After-tax cash flow
- $1,377/yr
For passive investors: Depreciation is non-cash, so a rental often shows a tax loss while cash-flowing — sheltering income. Rental losses are passive: they offset passive income freely, and up to $25,000/yr can offset ordinary (W-2) income if you actively participate and your MAGI is under $100k (phasing out to $0 by $150k); unused losses carry forward. On sale, claimed depreciation is recaptured at up to 25%, and gains may owe capital-gains tax (a 1031 exchange can defer both). Figures are a year-1 estimate at your 24.0% rate — not tax advice; consult a CPA.
Schools (NCES district)
- District
- Detroit Public Schools Community District
- NCES district ID
- 2601103
- Math proficiency
- 10% ▼ -2.00%
- Reading proficiency
- 24% ▲ 6.00%
- Median HH income
- $25,815
- Composite
- 13.06/100
- National rank
- #9564
- State rank
- #499 of 540 in MI
Livability — Detroit
- Score
- 73/100
- State rank
- #218
- US rank
- #5427
Category grades
Schools grade is shown separately in the Schools card above.
Census & demographics
- Census place
- Detroit, MI
- County
- Wayne County · 1,562,939 people
- City population
- 572,865
- Metro
- Detroit-Warren-Dearborn, MI
- Population (ZIP)
- 20,049
- Household income
- $38,404
- Rent vs Own
- Severe rent burden
- 1192.0
Population outlook (Wayne County) Hauer SSP2
- Today (2025)
- 1,675,273 people
- By 2030
- 1,620,300 · -3.3%
- By 2040
- 1,502,341 · -10.3%
- By 2050
- 1,384,039 · -17.4%
- By 2075
- 1,124,592 · -32.9%
- By 2100
- 881,193 · -47.4%
Race, ethnicity, and origin ACS 2023
- Neighborhood character
- Predominantly Black (85%)
- Race & ethnicity
- Black 85% White 8% Two or more races 5% Hispanic / Latino 2%
- Common ancestry
- Lithuanian 1%
- Foreign-born
- 2% · Canada
- Languages at home
- 95% English-only · Spanish 3% French/Haitian/Cajun 1%
Political lean MEDSL · Wayne
- 2024 margin
- Strong D (+29.0) · D 62.7% · R 33.7% · Other 3.6%
- 2008→2024 swing
- -20.5pp toward R · 2008: 49.5pp · 2024: 29.0pp
- All cycles
- 2024: D+29.0 2020: D+38.1 2016: D+37.3 2012: D+46.9 2008: D+49.5
Not yet ingested
- Civics
- —
Market trends
- HPI YoY
- ▼ -90.13%
- Current HPI
- 297.0176
- Rent YoY
- —
- Metro
- Detroit-Warren-Dearborn, MI
- State GDP YoY
- ▲ 1.37%
- F500 in state
- 28
Industry mix (Fortune 500 HQ in MI)
| Industry | F500 HQs | Revenue |
|---|---|---|
| Automotive Parts | 3 | $48B |
|
||
| Automotive | 2 | $372B |
|
||
| Chemicals | 1 | $45B |
|
||
| Automotive Retail | 1 | $29B |
|
||
| Healthcare / Medical Devices | 1 | $23B |
|
||
| Automotive Technology | 1 | $20B |
|
||
Price history
+79.4% since first listed43 events — show timeline
- 2026-05-06 Contingent — REALCOMP
- 2026-05-06 Contingent — MiRealSource-MiMLS
- 2026-02-19 Listed $139,900 MiRealSource-MiMLS
- 2026-02-19 Listed $139,900 REALCOMP
- 2026-02-15 Listing Removed — REALCOMP
- 2026-02-15 Listing Removed — MiRealSource-MiMLS
- 2025-08-14 Listed $179,995 REALCOMP
- 2025-08-14 Listed $179,995 MiRealSource-MiMLS
- 2021-04-20 Listing Removed — REALCOMP
- 2021-04-20 Listing Removed — MiRealSource-MiMLS
- 2021-02-26 Price Changed $89,900 MiRealSource-MiMLS
- 2021-02-26 Price Changed $89,900 REALCOMP
- 2021-01-28 Listed $94,900 MiRealSource-MiMLS
- 2021-01-28 Listed $94,900 REALCOMP
- 2021-01-25 Coming Soon — MiRealSource-MiMLS
- 2021-01-25 Coming Soon — REALCOMP
- 2020-09-11 Listing Removed — REALCOMP
- 2020-09-11 Listing Removed — MiRealSource-MiMLS
- 2020-08-04 Listed $74,900 MiRealSource-MiMLS
- 2020-08-04 Listing Removed — MiRealSource-MiMLS
- 2020-08-04 Listed $74,900 REALCOMP
- 2020-08-04 Listing Removed — REALCOMP
- 2020-07-17 Price Changed $77,500 MiRealSource-MiMLS
- 2020-07-16 Price Changed $77,500 REALCOMP
- 2020-06-21 Price Changed $79,900 MiRealSource-MiMLS
- 2020-06-21 Price Changed $79,900 REALCOMP
- 2020-06-14 Price Changed $84,900 MiRealSource-MiMLS
- 2020-06-13 Price Changed $84,900 REALCOMP
- 2020-06-08 Price Changed $87,900 MiRealSource-MiMLS
- 2020-06-08 Price Changed $87,900 REALCOMP
- 2020-05-03 Listed $90,000 REALCOMP
- 2020-05-02 Coming Soon — REALCOMP
- 2020-05-02 Listed $90,000 MiRealSource-MiMLS
- 2017-08-21 Listing Removed — REALCOMP
- 2017-08-21 Listing Removed — MiRealSource-MiMLS
- 2017-08-05 Price Changed $75,000 MiRealSource-MiMLS
- 2017-08-05 Relisted — MiRealSource-MiMLS
- 2017-08-04 Price Changed $75,000 REALCOMP
- 2017-08-04 Relisted — REALCOMP
- 2017-04-29 Listing Removed — MiRealSource-MiMLS
- 2017-04-28 Listing Removed — REALCOMP
- 2017-03-27 Listed $78,000 MiRealSource-MiMLS
- 2017-03-27 Listed $78,000 REALCOMP
Property tax history
-14.0%/yrLatest (2025): $130 · +4.0% YoY. Source: county tax records.
Cash-flow waterfall
monthlySold comps — $/sqft
last 12 mo · ≤1 miLoading sold comps…