72 Chestnut St · Franklin, NH
Flood risk 1/10 · Minimal
- FEMA flood zone
- X (unshaded)
- Chance of flooding over 30 yrs
- 0.0%
- Est. flood insurance / yr
- $473 – $860
Fire risk 3/10 · Minor
- Est. fire insurance / yr
- $507 – $941
Heat risk 3/10 · Minor
- Hot days now (above 93°F)
- 7 days/yr
- Hot days in 30 yrs
- 16 days/yr
Wind risk 4/10 · Minor
- Chance of severe wind over 30 yrs
- 10.0%
Air-quality risk 1/10 · Minimal
- Unhealthy air days now
- 0 days/yr
- Unhealthy air days in 30 yrs
- 0 days/yr
Risk factors via First Street. Map © Google.
Why this score? — see what drove the B- grade
The composite is a weighted blend of 9 inputs, each scored 0–100. Each bar is that input's sub-score; the figure is the points it added to the 100-point composite (weight × sub-score).
- Cash flow +30.0/30.0
- 1% rule +10.0/10.0
- DSCR +10.0/10.0
- ARV discount +7.5/15.0
- Livability +3.4/5.0
- Rent growth +2.5/5.0
- Condition / age +2.5/5.0
- Schools +1.9/10.0
- Appreciation +0.0/10.0
$100,000
🖨 Deal sheet (PDF) 📄 Offer letter ✓ Due diligence
Listing remarks
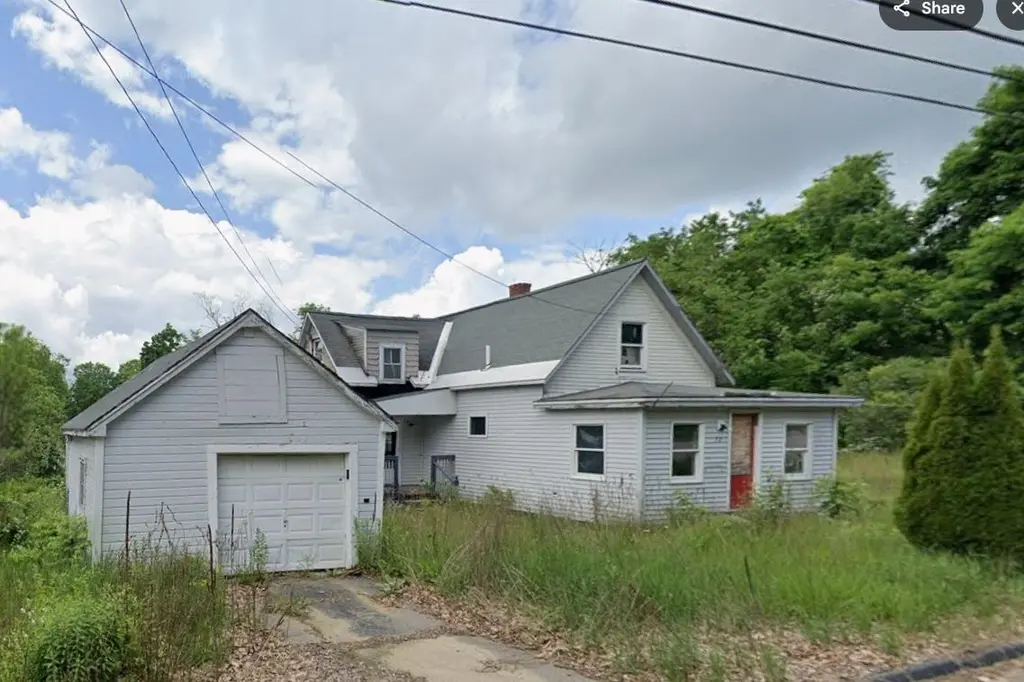
Non-livable, rehab or renovation property. This home will require significant TLC to bring it back to life. Opportunity for investors, contractors, or flippers seeking their next project. Located in a walkable neighborhood, the property sits just minutes from downtown Franklin, Webster Lake, and the region’s new whitewater park, making it an excellent long-term investment once restored. Franklin continues to attract buyers and renters due to its lower taxes, strong rental demand, and quick access to I-93, offering an affordable entry point into the Lakes Region with convenient access to outdoor recreation and community amenities. Whether you’re looking to renovate and resell or
Key facts
- Community amenities
- 0.43 acre lot
- 2 garage spots
Tags
Property features AI
Exterior
- Parking: 2-car garage
- Utilities: Public water; Public sewer; Electric: Other; Internet: None
- Home design: Other / Rehab Needed architectural style; White exterior
- Construction: Built in 1913; Wood frame construction; Asphalt shingle roof
- Exterior features: Neighborhood lot setting; Dirt driveway; Road access: paved public road with frontage
Interior
- Bathrooms: 1 full bathroom
- Heating & cooling: Forced air heating; Cooling: Other
- Interior features: 7 rooms; Basement present with interior access and concrete floor
Neighborhood map
What this means for you Summary
Snapshot
- This is a 3-bed/1.0-bath single-family listed at $100k.
Deal economics
- At list price, monthly cash flow is $683 ($8k/yr) — positive.
- The deal already cash-flows at list — no discount required.
- Meets the 1% rule at list price ($2k rent vs $100k).
- Cap rate 14.5% vs local median 2.3% in Franklin — top-decile yield for the area; either an underpriced asset or a hidden risk that comps aren't pricing in. Stress-test before assuming the spread holds.
Location & tenants
- Location reads 68/100 on livability (#56 in NH) — a middle-class / working-renter tenant base. Strengths: crime A+, cost of living A+, housing A+; Watch: health & safety C-, amenities F, commute F.
- Franklin School District (town): math 14% / reading 29% proficiency, ranked #97 of 98 in NH (top 99%) — low school quality limits family demand, transient renter base, plan for 1-2y turnover.
- Zoned schools: Paul A. Smith School (math 22% / reading 24%, grade F, #241 of 263 statewide, top 92%, 287 students, 60% FRL); Franklin Middle School (math 11% / reading 30%, grade F, #88 of 96 statewide, top 93%, 378 students, 61% FRL); Franklin High School (math 30% / reading 50%, grade F, #59 of 90 statewide, top 69%, 270 students, 44% FRL) — zoned schools at 55% FRL track the district average.
- Market conditions: 40 active listings in the ZIP; 6 comparable units currently listed for rent nearby; rentals at typical pace (median 26d on market — plan ~3-4 weeks tenant-placement turnaround); 380 units permitted in Merrimack County in 2024 (28 in 5+ unit buildings).
Forward outlook
- Local home prices are declining (-3.0%/yr); year-one equity from $691 of loan paydown is wiped out by about $3k of value loss. Plan a longer hold.
- Merrimack County population projected to shrink 5% by 2050 — rents likely to lag national; underwrite the cash flow, not the appreciation.
- At projected returns (-3.0% appreciation + 3.0% rent growth), your $28k cash investment doubles in ~5 years — after that, you're playing with house money.
Negotiation context
- Only 1 days on market — expect competitive offers; lowballing is unlikely to land.
Risks & watch-outs
- Watch-outs: property tax is 2.7% of price; built in 1913 — expect roof / HVAC / electrical / plumbing capex.
Questions for the listing agent
- Built in 1913 — when were the roof, HVAC, electrical panel, plumbing, and water heater last replaced?
- Property tax is high relative to price — has the assessment been appealed recently, and will the sale trigger a re-assessment?
- Is there a deadline driving the sale (1031 exchange, divorce, estate, relocation)? That informs how much negotiation room exists.
- Schools are F-rated, which usually means shorter tenancies and higher turnover. Who's the typical renter profile here, and what's been the actual vacancy rate?
- What's the average days-on-market for RENTAL listings here right now (not sales)? A rising rental-DOM trend means longer vacancies and softer asking-rent achievability than the comps imply.
- What's the recent tenant-quality profile in this submarket — average credit score on applications, eviction rate, late-payment / NSF rate, and stable-employment percentage? A property-management company in the area should have these aggregated.
- How much new for-sale + rental construction is in the pipeline within 1–3 miles? Heavy new supply typically softens prices + rents 12–24 months out; constrained supply supports both.
Investment metrics
- 1% rule
- 1.86% ✓
- Cap rate
- 14.49%
- Cash-on-cash
- 29.28%
- DSCR
- 2.30
- GRM
- 4.5
CMA / ARV
- ARV (on-the-fly)
- $367,770
- Comps found
- 12
Show comp detail 12 sales within ~0.75 mi
| Address | Dist | Beds/Ba | Sqft | Sold | Price | $/sf | Match |
|---|---|---|---|---|---|---|---|
| 193 Kendall St | 0.27mi | 3/2.0 | 1,229 (-0%) | 6mo | $460,000 | $374 | 78 |
| 72 Chestnut St | 0.00mi | 3/1.0 | 1,065 (-13%) | 1mo | $120,000 | $113 | 77 |
| 189 Kendall St | 0.27mi | 3/2.0 | 1,229 (-0%) | 8mo | $473,000 | $385 | 76 |
| 30 Duffy St | 0.28mi | 3/2.0 | 1,260 (+2%) | 7mo | $364,000 | $289 | 73 |
| Piper St Lot 4 | 0.36mi | 3/2.0 | 1,288 (+5%) | 2mo | $550,000 | $427 | 70 |
| 16 Spring St | 0.47mi | 3/1.0 | 1,248 (+2%) | 9mo | $315,000 | $252 | 68 |
| 605 Central St | 0.17mi | 3/1.5 | 1,337 (+9%) | 9mo | $280,000 | $209 | 68 |
| 42 Woodrow Ave | 0.32mi | 3/2.0 | 1,152 (-6%) | 6mo | $345,000 | $299 | 65 |
| 180 Kendall St | 0.21mi | 3/1.5 | 1,080 (-12%) | 6mo | $360,000 | $333 | 63 |
| 16 Liberty Ave | 0.65mi | 3/1.5 | 1,215 (-1%) | 7mo | $375,000 | $309 | 60 |
| 18 Highland Ave | 0.45mi | 3/1.0 | 1,073 (-13%) | 3mo | $270,000 | $252 | 56 |
| 5 Evans Ct | 0.67mi | 3/1.5 | 1,361 (+11%) | 2mo | $269,900 | $198 | 47 |
Match score weights: distance 35% · size 25% · config 20% · recency 20%. Top-matched comps best support the ARV.
Projected returns pro-forma
-3.0% appreciation · 3.0% rent growth · sell at horizon
- IRR
- 23.8%
- Equity multiple
- 1.98×
- Total profit
- $27,403
- Equity at exit
- $14,910
- IRR
- 31.7%
- Equity multiple
- 3.87×
- Total profit
- $80,260
- Equity at exit
- $8,646
Cash invested: $28,000 (down + closing). Projections, not guarantees.
Landlord ↔ Tenant lean methodology
- Overall (STATE)
- 56 Moderately Landlord-Leaning
- State New Hampshire
- 56 Moderately Landlord-Leaning · D+1
- County
- — inherits STATE
- City
- — inherits STATE
ZIP-level market 03235
- Home prices YoY
- -9.7%
- Active inventory
- 40
- Price-to-rent
- 4.5×
Monthly cashflow live
- Estimated rent
- $1,864 high interval (Pro) →
- Mortgage (P&I)
- −$524
- Tax from tax record
- −$223 /mo · $2,680/yr
- Insurance
- −$42
- HOA
- −$0
- Vacancy / Maint / Mgmt
- −$391
- Net cashflow
- $683
Break-even live
Sensitivity live
| Price | -10% $740 | -5% $712 | +0% $683 | +5% $655 | +10% $627 |
|---|---|---|---|---|---|
| Rent | -10% $536 | -5% $610 | +0% $683 | +5% $757 | +10% $831 |
| Rate | -1.0pp $734 | -0.5pp $709 | base $683 | +0.5pp $657 | +1.0pp $631 |
UW: 25.0% down · 7.5% · 30yr · 1.5% tax · 5.0% vac · 8.0% maint · 8.0% mgmt
Financing live
Cash to close
- Down payment
- $25,000
- Closing costs
- $3,000
- Reserves months
- —
- Total cash needed
- —
Loan-product check · same deal, 3 products live
Conventional
25% down · 7.5% · 30yr
- Down + closing
- —
- Monthly P&I
- —
- Monthly cashflow
- —
- DSCR
- —
- Eligible?
- —
Personal DTI + credit; lowest rate.
DSCR
20% down · 8.5% · 30yr
- Down + closing
- —
- Monthly P&I
- —
- Monthly cashflow
- —
- DSCR
- —
- Eligible?
- —
No personal income docs; deal must DSCR.
Hard money
10% down · 12.0% · 12mo
- Down + closing
- —
- Monthly P&I
- —
- Monthly cashflow
- —
- DSCR
- —
- Eligible?
- —
Short-term bridge; refi at stabilization.
Rent comps 6 comps
| Address | Beds | Baths | Sqft | Rent | $/sqft | DOM | Units | Dist |
|---|---|---|---|---|---|---|---|---|
| 672 Central St Unit A Franklin, NH | 3.0 | 1.0 | 1100 | $1,950 | $1.77 | 45d | 1 | 0.18mi |
| 20 Canal St Franklin, NH | 2.0 | 1.0 | 758 | $2,995 | $3.95 | 6d | 5 | 0.42mi |
| 76 Terrace Rd Franklin, NH | 2.0 | 1.0 | 750 | $1,675 | $2.23 | 6d | 1 | 0.42mi |
| 97 Franklin St Unit C Franklin, NH | 2.0 | 1.0 | 949 | $1,500 | $1.58 | 26d | 1 | 0.61mi |
| 115 Franklin St Unit 6 Flanders Franklin, NH | 3.0 | 1.0 | 1012 | $1,875 | $1.85 | 6d | 1 | 0.64mi |
| 135 Franklin St Apt A Franklin, NH | 3.0 | 1.0 | 1421 | $2,100 | $1.48 | 45d | 1 | 0.69mi |
Listing history 2 events
-
2026-04-30status Pending
-
2026-04-29$100,000 Active
ⓘ Source: listings_history table (triggers on properties + properties_extension) + one-shot
backfill from property_details.listing_events for pre-trigger history.
Tax reassessment forecast NH · Partial reset (capped growth)
- Current annual tax
- $2,680 · $223/mo
- Projected year-2 tax
- $2,680 · $223/mo
- Expected delta
- $0/yr ($0/mo · 0.0%)
ⓘ Screening estimate from a state-policy table — verify with the county assessor before closing.
Climate risk First Street
- Flood 1/10 Low FEMA zone X (unshaded) · 0% chance over 30 yrs
- Wildfire 3/10 Moderate
- Heat 3/10 Moderate 7 d/yr ≥93°F today · 16 d/yr by 30 yrs out
- Wind 4/10 Moderate 10% chance of damaging wind over 30 yrs
- Air quality 1/10 Low 0 unhealthy d/yr today · 0 by 30 yrs out
Nearby sold comps map
Loading sold comps map…
Walkable amenities ~0.75 mi
Loading nearby amenities…
Taxation est. · year 1
- Rental income
- $22,370
- − Mortgage interest
- −$5,602
- − Property taxes
- −$2,680
- − Insurance
- −$500
- − Repairs & maintenance
- −$1,790
- − Management
- −$1,790
- − Depreciation
- −$2,909
- Taxable income
- $7,100
- Est. tax owed @ 24.0%
- −$1,704
- After-tax cash flow
- $6,495/yr
For passive investors: Depreciation is non-cash, so a rental often shows a tax loss while cash-flowing — sheltering income. Rental losses are passive: they offset passive income freely, and up to $25,000/yr can offset ordinary (W-2) income if you actively participate and your MAGI is under $100k (phasing out to $0 by $150k); unused losses carry forward. On sale, claimed depreciation is recaptured at up to 25%, and gains may owe capital-gains tax (a 1031 exchange can defer both). Figures are a year-1 estimate at your 24.0% rate — not tax advice; consult a CPA.
Schools (NCES district)
- District
- Franklin School District
- NCES district ID
- 3303090
- Math proficiency
- 14% ▼ -5.00%
- Reading proficiency
- 29% ▼ -3.00%
- Median HH income
- $45,220
- Composite
- 18.64/100
- National rank
- #8892
- State rank
- #97 of 98 in NH
Livability — Franklin
- Score
- 68/100
- State rank
- #56
- US rank
- #9637
Category grades
Schools grade is shown separately in the Schools card above.
Census & demographics
- Census place
- Franklin, NH
- City population
- 8,843
- Population (ZIP)
- 8,843
Population outlook (Merrimack County) Hauer SSP2
- Today (2025)
- 151,287 people
- By 2030
- 151,867 · +0.4%
- By 2040
- 149,927 · -0.9%
- By 2050
- 144,081 · -4.8%
- By 2075
- 132,018 · -12.7%
- By 2100
- 111,733 · -26.1%
Race, ethnicity, and origin ACS 2023
- Neighborhood character
- Predominantly White (94%)
- Race & ethnicity
- White 94% Two or more races 4%
- Common ancestry
- Lithuanian 9% Slovak 6% Subsaharan African 5%
- Foreign-born
- 4% · Canada
- Languages at home
- 95% English-only · Russian/Polish/Slavic 3% French/Haitian/Cajun 1%
Political lean MEDSL · Merrimack
- 2024 margin
- Lean D (+5.2) · D 52.1% · R 46.9% · Other 1.0%
- 2008→2024 swing
- -8.7pp toward R · 2008: 13.9pp · 2024: 5.2pp
- All cycles
- 2024: D+5.2 2020: D+9.8 2016: D+3.1 2012: D+12.7 2008: D+13.9
Not yet ingested
- Civics
- —
Market trends
- HPI YoY
- ▼ -48.30%
- Current HPI
- 449.6758
- Rent YoY
- —
- Metro
- —
- State GDP YoY
- —
- F500 in state
- 0
Price history
2 events — show timeline
- 2026-04-30 Pending — PrimeMLS
- 2026-04-29 Listed $100,000 PrimeMLS
Property tax history
+0.5%/yrLatest (2025): $2,680 · +2.8% YoY. Source: county tax records.
Cash-flow waterfall
monthlySold comps — $/sqft
last 12 mo · ≤1 miLoading sold comps…