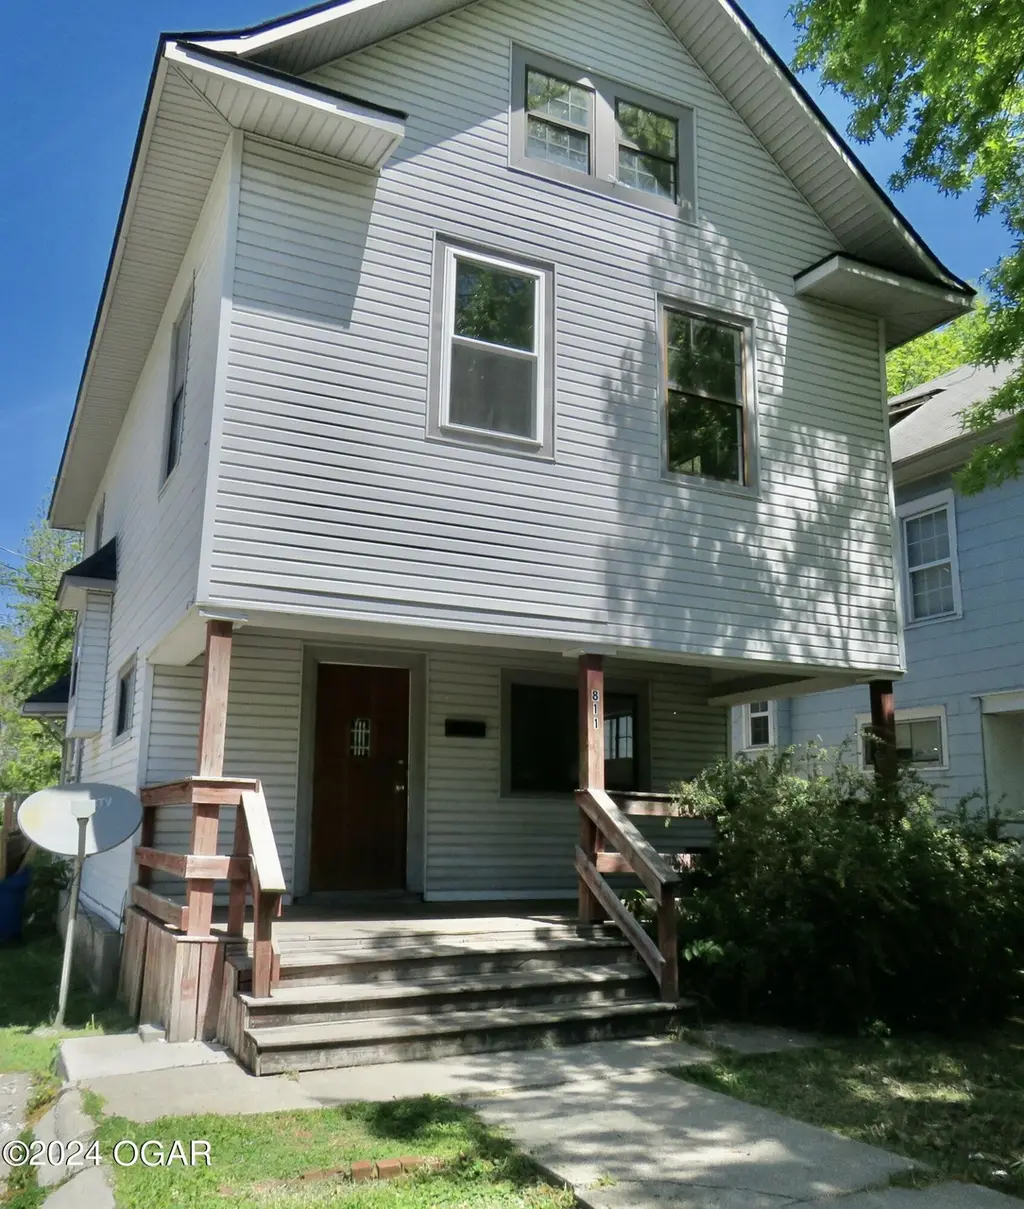
811 W 6th St · Joplin, MO
Flood risk 1/10 · Minimal
- FEMA flood zone
- X (unshaded)
- Chance of flooding over 30 yrs
- 0.0%
- Est. flood insurance / yr
- $507 – $1,088
Fire risk 4/10 · Minor
- Est. fire insurance / yr
- $1,054 – $1,958
Heat risk 5/10 · Moderate
- Hot days now (above 107°F)
- 7 days/yr
- Hot days in 30 yrs
- 20 days/yr
Wind risk 2/10 · Minimal
- Chance of severe wind over 30 yrs
- 2.0%
Air-quality risk 2/10 · Minimal
- Unhealthy air days now
- 1 days/yr
- Unhealthy air days in 30 yrs
- 1 days/yr
Risk factors via First Street. Map © Google.
Why this score? — see what drove the C+ grade
The composite is a weighted blend of 9 inputs, each scored 0–100. Each bar is that input's sub-score; the figure is the points it added to the 100-point composite (weight × sub-score).
- Cash flow +27.1/30.0
- DSCR +9.4/10.0
- ARV discount +7.5/15.0
- 1% rule +6.2/10.0
- Rent growth +3.2/5.0
- Livability +3.2/5.0
- Schools +2.9/10.0
- Condition / age +2.5/5.0
- Appreciation +0.0/10.0
$114,500
🖨 Deal sheet (PDF) 📄 Offer letter ✓ Due diligence
Listing remarks
Welcome to this delightful 4 bedroom 1 bath home, boasting of 1360 finished square feet of space. Upon entering, you'll be greeted by fresh paint that brightens the living room space, complemented by the fresh carpet that adds warmth and coziness throughout. Stay comfortable year-round with the newer HVAC system, ensuring a comfortable environment no matter the season. You will also enjoy peace of mind with the recently installed roof that provides durability and protection for your investment.
Key facts
- Newer hvac system
- 2,178 sq ft lot
- Built 1920
Tags
Property features AI
Exterior
- Parking: No parking
- Utilities: Cable available; Public sewer
- Home design: Single-family residence (freestanding); Residential property
- Construction: Vinyl siding; Above-grade finished area: 1,360; Built with standard foundation
- Exterior features: Covered porch; Privacy fencing; Shingle roof; Level topography; Lot dimensions approximately 32 x 70
Interior
- Kitchen: Electric range; Refrigerator
- Bedrooms: Total rooms: 7
- Flooring: Carpet
- Bathrooms: 1 full bathroom
- Heating & cooling: Electric central heating; Has cooling
- Interior features: Electric range; Refrigerator; Carpet flooring; Partial unfinished basement; Fireplace: none
Neighborhood map
What this means for you Summary
Snapshot
- This is a 4-bed/1.0-bath other listed at $114k.
Deal economics
- At list price, monthly cash flow is $326 ($4k/yr) — positive.
- The deal already cash-flows at list — no discount required.
- Meets the 1% rule at list price ($1k rent vs $114k).
- Recommended offer: $111k (3.0% below list) — sets the bar for market timing.
- Cap rate 9.7% vs local median 5.1% in Joplin — top-decile yield for the area; either an underpriced asset or a hidden risk that comps aren't pricing in. Stress-test before assuming the spread holds.
Location & tenants
- Location reads 64/100 on livability (#318 in MO) — a middle-class / working-renter tenant base. Strengths: cost of living A+, housing A+; Watch: crime F, amenities F, commute F.
- Joplin Schools (urban): math 30% / reading 39% proficiency, ranked #231 of 324 in MO (top 71%) — families likely to look elsewhere, expect single-tenant / working-renter base with shorter leases.
- Zoned schools: Dover Hill Elementary (351 students, 73% FRL); North Middle (math 26% / reading 35%, grade F, #283 of 391 statewide, top 74%, 517 students, 65% FRL); Joplin High (math 32% / reading 46%, grade F, #287 of 521 statewide, top 55%, 2,233 students, 50% FRL).
- Market conditions: Rents rising (+3.0%/yr); 378 active listings in the ZIP; 12 comparable units currently listed for rent nearby; rentals at typical pace (median 23d on market — plan ~3-4 weeks tenant-placement turnaround); 602 units permitted in Jasper County in 2024 (0 in 5+ unit buildings).
Forward outlook
- Local home prices are declining (-3.0%/yr); year-one equity from $792 of loan paydown is wiped out by about $3k of value loss. Plan a longer hold.
- At projected returns (-3.0% appreciation + 3.0% rent growth), your $32k cash investment doubles in ~10 years — after that, you're playing with house money.
Negotiation context
- It's been on market 58 days — a 3% lower offer ($111k) is reasonable based on typical stale-listing flexibility.
- 7 sale attempts since 12y ago with the ask held roughly flat each time — persistent listings suggest the price (not the market) is what's stuck; bring a comps-based counter.
Risks & watch-outs
- Watch-outs: built in 1920 — expect roof / HVAC / electrical / plumbing capex.
- Climate carrying-cost: extreme-heat days projected 7→20/yr by 2055 (HVAC capex compounding) — expect insurance premiums to compound above CPI over the hold.
Questions for the listing agent
- It's been on market 58 days. Have you received any prior offers? Is the seller open to a 3% concession, seller financing, or rate buy-down credit?
- Built in 1920 — when were the roof, HVAC, electrical panel, plumbing, and water heater last replaced?
- Is there a deadline driving the sale (1031 exchange, divorce, estate, relocation)? That informs how much negotiation room exists.
- Schools are D-rated, which usually means shorter tenancies and higher turnover. Who's the typical renter profile here, and what's been the actual vacancy rate?
- Crime grade is F in this area — have there been break-ins, vandalism, or insurance claims at this property in the last 3 years? What carrier currently insures it and at what premium?
- What's the average days-on-market for RENTAL listings here right now (not sales)? A rising rental-DOM trend means longer vacancies and softer asking-rent achievability than the comps imply.
- What's the recent tenant-quality profile in this submarket — average credit score on applications, eviction rate, late-payment / NSF rate, and stable-employment percentage? A property-management company in the area should have these aggregated.
- How much new for-sale + rental construction is in the pipeline within 1–3 miles? Heavy new supply typically softens prices + rents 12–24 months out; constrained supply supports both.
Investment metrics
- 1% rule
- 1.12% ✓
- Cap rate
- 9.71%
- Cash-on-cash
- 12.20%
- DSCR
- 1.54
- GRM
- 7.4
CMA / ARV
No comps found within radius.
Projected returns pro-forma
-3.0% appreciation · 2.95% rent growth · sell at horizon
- IRR
- 1.7%
- Equity multiple
- 1.07×
- Total profit
- $2,089
- Equity at exit
- $17,072
- IRR
- 11.2%
- Equity multiple
- 1.88×
- Total profit
- $28,097
- Equity at exit
- $9,900
Cash invested: $32,060 (down + closing). Projections, not guarantees.
Landlord ↔ Tenant lean methodology
- Overall (STATE)
- 81 Strongly Landlord-Friendly
- State Missouri
- 81 Strongly Landlord-Friendly · R+10
- County
- — inherits STATE
- City
- — inherits STATE
ZIP-level market 64801
- Rents YoY
- 3.0%
- Active inventory
- 378
- Price-to-rent
- 7.4×
Monthly cashflow live
- Estimated rent
- $1,284 high interval (Pro) →
- Mortgage (P&I)
- −$600
- Tax from tax record
- −$40 /mo · $484/yr
- Insurance
- −$48
- HOA
- −$0
- Vacancy / Maint / Mgmt
- −$270
- Net cashflow
- $326
Break-even live
Sensitivity live
| Price | -10% $391 | -5% $358 | +0% $326 | +5% $293 | +10% $261 |
|---|---|---|---|---|---|
| Rent | -10% $224 | -5% $275 | +0% $326 | +5% $377 | +10% $427 |
| Rate | -1.0pp $383 | -0.5pp $355 | base $326 | +0.5pp $296 | +1.0pp $266 |
UW: 25.0% down · 7.5% · 30yr · 1.5% tax · 5.0% vac · 8.0% maint · 8.0% mgmt
Financing live
Cash to close
- Down payment
- $28,625
- Closing costs
- $3,435
- Reserves months
- —
- Total cash needed
- —
Loan-product check · same deal, 3 products live
Conventional
25% down · 7.5% · 30yr
- Down + closing
- —
- Monthly P&I
- —
- Monthly cashflow
- —
- DSCR
- —
- Eligible?
- —
Personal DTI + credit; lowest rate.
DSCR
20% down · 8.5% · 30yr
- Down + closing
- —
- Monthly P&I
- —
- Monthly cashflow
- —
- DSCR
- —
- Eligible?
- —
No personal income docs; deal must DSCR.
Hard money
10% down · 12.0% · 12mo
- Down + closing
- —
- Monthly P&I
- —
- Monthly cashflow
- —
- DSCR
- —
- Eligible?
- —
Short-term bridge; refi at stabilization.
Rent comps 12 comps
| Address | Beds | Baths | Sqft | Rent | $/sqft | DOM | Units | Dist |
|---|---|---|---|---|---|---|---|---|
| 524 S Moffet Ave Joplin, MO | 3.0 | 1.0 | 900 | $855 | $0.95 | 22d | 1 | 0.14mi |
| 120 /122 S Pearl Ave #122 Joplin, MO | 3.0 | 2.0 | 1200 | $1,250 | $1.04 | 22d | 1 | 0.40mi |
| 623 W Junge Blvd Joplin, MO | 3.0 | 2.0 | 1217 | $1,500 | $1.23 | 22d | 1 | 0.60mi |
| 101 N Main Street Rd Unit 1806 Joplin, MO | 3.0 | 2.0 | 1386 | $1,300 | $0.94 | 22d | 1 | 0.61mi |
| 211 S Galena Ave Joplin, MO | 3.0 | 2.0 | 1200 | $1,550 | $1.29 | 22d | 1 | 0.91mi |
| 2002 W 11th St Joplin, MO | 3.0 | 1.0 | 1200 | $1,200 | $1.00 | 22d | 1 | 1.08mi |
| 1806 Pennsylvania Ave Joplin, MO | 3.0 | 1.0 | 1295 | $1,050 | $0.81 | 22d | 1 | 1.14mi |
| 1012 Central St Joplin, MO | 3.0 | 2.0 | 1100 | $1,395 | $1.27 | 22d | 1 | 1.16mi |
| 2012 S Connor Ave Joplin, MO | 3.0 | 2.0 | 1379 | $1,595 | $1.16 | 22d | 1 | 1.16mi |
| 1013 Broadway St Joplin, MO | 3.0 | 1.0 | 917 | $995 | $1.09 | 22d | 1 | 1.19mi |
| 2201 S Pearl Ave Joplin, MO | 3.0 | 2.0 | 1487 | $1,475 | $0.99 | 22d | 1 | 1.34mi |
| 2226 S Moffet Ave Joplin, MO | 4.0 | 2.0 | 1818 | $1,600 | $0.88 | 22d | 1 | 1.37mi |
Listing history 33 events
-
2026-06-21days on market $114,500 Active 58 DOM
-
2026-06-19days on market $114,500 Active 56 DOM
-
2026-06-18days on market $114,500 Active 55 DOM
-
2026-06-17days on market $114,500 Active 54 DOM
-
2026-06-16days on market $114,500 Active 53 DOM
-
2026-06-15days on market $114,500 Active 52 DOM
-
2026-06-14days on market $114,500 Active 50 DOM
-
2026-06-13days on market $114,500 Active 49 DOM
-
2026-06-10days on market $114,500 Active 47 DOM
-
2026-06-09days on market $114,500 Active 46 DOM
-
2026-06-08days on market $114,500 Active 45 DOM
-
2026-06-07pricedays on market $114,500 Active 44 DOM
-
2026-06-05days on market $117,270 Active 41 DOM
-
2026-06-03days on market $117,270 Active 40 DOM
-
2026-06-02days on market $117,270 Active 39 DOM
-
2026-06-01days on market $117,270 Active 38 DOM
-
2026-05-31days on market $117,270 Active 37 DOM
-
2026-05-30days on market $117,270 Active 36 DOM
-
2026-04-24$117,270 Active
-
2025-07-01price $121,297
-
2024-09-20price $130,000
-
2024-05-30historical $1,200
-
2024-04-25$1,200
-
2022-11-01status Pending
-
2022-06-22$87,900 Active
-
2022-03-21$99,900
-
2022-03-21$99,900
-
2021-11-12soldstatus
-
2021-10-05$90,000
-
2014-06-09soldstatus
-
2014-05-01$650
-
2006-07-25soldstatus
-
1988-09-26soldstatus
ⓘ Source: listings_history table (triggers on properties + properties_extension) + one-shot
backfill from property_details.listing_events for pre-trigger history.
Tax reassessment forecast MO · Resets to sale price
- Current annual tax
- $484 · $40/mo
- Projected year-2 tax
- $1,111 · $93/mo
- Expected delta
- +$626/yr (+$52/mo · 129.3%)
ⓘ Screening estimate from a state-policy table — verify with the county assessor before closing.
Climate risk First Street
- Flood 1/10 Low FEMA zone X (unshaded) · 0% chance over 30 yrs
- Wildfire 4/10 Moderate
- Heat 5/10 Major 7 d/yr ≥107°F today · 20 d/yr by 30 yrs out
- Wind 2/10 Low 2% chance of damaging wind over 30 yrs
- Air quality 2/10 Low 1 unhealthy d/yr today · 1 by 30 yrs out
Nearby sold comps map
Loading sold comps map…
Walkable amenities ~0.75 mi
Loading nearby amenities…
Taxation est. · year 1
- Rental income
- $15,408
- − Mortgage interest
- −$6,414
- − Property taxes
- −$484
- − Insurance
- −$572
- − Repairs & maintenance
- −$1,233
- − Management
- −$1,233
- − Depreciation
- −$3,331
- Taxable income
- $2,141
- Est. tax owed @ 24.0%
- −$514
- After-tax cash flow
- $3,396/yr
For passive investors: Depreciation is non-cash, so a rental often shows a tax loss while cash-flowing — sheltering income. Rental losses are passive: they offset passive income freely, and up to $25,000/yr can offset ordinary (W-2) income if you actively participate and your MAGI is under $100k (phasing out to $0 by $150k); unused losses carry forward. On sale, claimed depreciation is recaptured at up to 25%, and gains may owe capital-gains tax (a 1031 exchange can defer both). Figures are a year-1 estimate at your 24.0% rate — not tax advice; consult a CPA.
Schools (NCES district)
- District
- Joplin Schools
- NCES district ID
- 2916350
- Math proficiency
- 30% ▼ -3.00%
- Reading proficiency
- 39% ▼ -3.00%
- Median HH income
- $38,648
- Composite
- 28.82/100
- National rank
- #6657
- State rank
- #231 of 324 in MO
Livability — Joplin
- Score
- 64/100
- State rank
- #318
- US rank
- #14578
Category grades
Schools grade is shown separately in the Schools card above.
Census & demographics
- Census place
- Joplin, MO
- County
- Jasper County · 79,035 people
- City population
- 73,303
- Metro
- Joplin, MO
- Population (ZIP)
- 36,287
- Household income
- $52,620
- Rent vs Own
- Severe rent burden
- 1710.0
Population outlook (Jasper County) Hauer SSP2
- Today (2025)
- 120,033 people
- By 2030
- 120,091 · +0.0%
- By 2040
- 119,297 · -0.6%
- By 2050
- 117,705 · -1.9%
- By 2075
- 110,402 · -8.0%
- By 2100
- 99,719 · -16.9%
Race, ethnicity, and origin ACS 2023
- Neighborhood character
- Predominantly White (82%)
- Race & ethnicity
- White 82% Two or more races 8% Hispanic / Latino 6% Black 3% Asian 2% Native American 1%
- Hispanic origin (detail)
- Mexican 4%
- Common ancestry
- Slovak 2% Lithuanian 2% Italian 2%
- Foreign-born
- 4% · Canada
- Languages at home
- 94% English-only · Spanish 3% Other Asian/Pacific 1%
Political lean MEDSL · Jasper
- 2024 margin
- Solid R (+46.8) · D 25.9% · R 72.7% · Other 1.4%
- 2008→2024 swing
- -13.6pp toward R · 2008: -33.2pp · 2024: -46.8pp
- All cycles
- 2024: R+46.8 2020: R+46.2 2016: R+50.8 2012: R+41.0 2008: R+33.2
Not yet ingested
- Civics
- —
Market trends
- HPI YoY
- ▼ -174.15%
- Current HPI
- 248.5056
- Rent YoY
- ▲ 2.95%
- Metro
- Joplin, MO
- State GDP YoY
- ▲ 1.84%
- F500 in state
- 20
Industry mix (Fortune 500 HQ in MO)
| Industry | F500 HQs | Revenue |
|---|---|---|
| Healthcare | 1 | $163B |
|
||
| Insurance | 1 | $21B |
|
||
| Industrial Technology | 1 | $17B |
|
||
| Retail | 1 | $16B |
|
||
| Industrial Distribution | 1 | $10B |
|
||
| Utilities | 1 | $9B |
|
||
Price history
+30.3% since first listed15 events — show timeline
- 2026-04-24 Listed $117,270 OGAR
- 2025-07-01 Price Changed $121,297 OGAR
- 2024-09-20 Price Changed $130,000 OGAR
- 2024-05-30 Rental Removed $1,200 OGAR
- 2024-04-25 Listed for Rent $1,200 OGAR
- 2022-11-01 Pending — SOMO
- 2022-06-22 Listed $87,900 SOMO
- 2022-03-21 Listed $99,900 SOMO
- 2022-03-21 Listed $99,900 OGAR
- 2021-11-12 Sold (MLS) — OGAR
- 2021-10-05 Listed $90,000 OGAR
- 2014-06-09 Sold (MLS) — OGAR
- 2014-05-01 Listed $650 OGAR
- 2006-07-25 Sold (Public Records) — Public Records
- 1988-09-26 Sold (Public Records) — Public Records
Property tax history
+3.5%/yrLatest (2025): $484 · +13.8% YoY. Source: county tax records.
Cash-flow waterfall
monthlySold comps — $/sqft
last 12 mo · ≤1 miLoading sold comps…