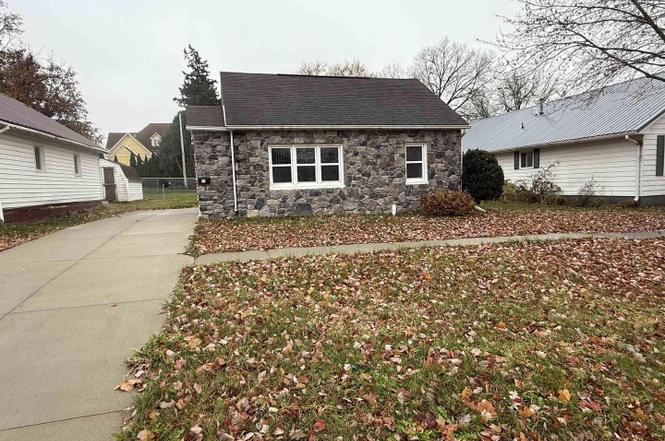
511 W 8th St · Tipton, IA
Flood risk 1/10 · Minimal
- FEMA flood zone
- X (unshaded)
- Chance of flooding over 30 yrs
- 0.0%
- Est. flood insurance / yr
- $507 – $1,088
Fire risk 1/10 · Minimal
- Est. fire insurance / yr
- $902 – $1,676
Heat risk 3/10 · Minor
- Hot days now (above 103°F)
- 7 days/yr
- Hot days in 30 yrs
- 16 days/yr
Wind risk 2/10 · Minimal
- Chance of severe wind over 30 yrs
- —
Air-quality risk 2/10 · Minimal
- Unhealthy air days now
- 1 days/yr
- Unhealthy air days in 30 yrs
- 2 days/yr
Risk factors via First Street. Map © Google.
Why this score? — see what drove the C grade
The composite is a weighted blend of 9 inputs, each scored 0–100. Each bar is that input's sub-score; the figure is the points it added to the 100-point composite (weight × sub-score).
- Cash flow +16.9/30.0
- ARV discount +15.0/15.0
- 1% rule +5.7/10.0
- Schools +5.7/10.0
- DSCR +5.2/10.0
- Livability +4.0/5.0
- Rent growth +2.5/5.0
- Condition / age +2.5/5.0
- Appreciation +0.0/10.0
$75,000
🖨 Deal sheet (PDF) 📄 Offer letter ✓ Due diligence
Listing remarks
Adorable Tipton cottage featuring 2 bedrooms, 1 bath, and a fully fenced yard perfect for pets or play. Enjoy the peace of mind of newer windows and a cozy, easy-to-maintain layout. A great opportunity to own a charming home in a friendly small-town setting! Sold as-is. * * OFFER DEADLINE 11/24 AT 1PM * *
Key facts
- 3,550 sq ft lot
- Built 1948
- Listed 8 days
Neighborhood map
What this means for you Summary
Snapshot
- This is a 2-bed/1.0-bath single-family listed at $75k.
Deal economics
- At list price, monthly cash flow is $49 ($586/yr) — positive.
- The deal already cash-flows at list — no discount required.
- Meets the 1% rule at list price ($799 rent vs $75k).
- Cap rate 7.1% vs local median 1.8% in Tipton — top-decile yield for the area; either an underpriced asset or a hidden risk that comps aren't pricing in. Stress-test before assuming the spread holds.
Location & tenants
- Location reads 79/100 on livability (#111 in IA, #2,123 nationally) — a middle-class / working-renter tenant base. Strengths: crime A+, cost of living A+, housing A+; Watch: amenities F, commute F.
- Tipton Community School District (town): math 62% / reading 72% proficiency, ranked #171 of 289 in IA (top 59%) — acceptable for families but not a draw, mixed tenant base, ~2y average lease.
- Zoned schools: Tipton Elementary School (math 62% / reading 57%, grade B-, #390 of 616 statewide, top 69%, 339 students, 37% FRL); Tipton Middle School (math 66% / reading 73%, grade A, #113 of 246 statewide, top 49%, 292 students, 32% FRL); Tipton High School (math 58% / reading 77%, grade B, #186 of 336 statewide, top 57%, 310 students, 22% FRL).
- Market conditions: 63 active listings in the ZIP; 89 units permitted in Cedar County in 2024 (40 in 5+ unit buildings).
Forward outlook
- Local home prices are declining (-3.0%/yr); year-one equity from $519 of loan paydown is wiped out by about $2k of value loss. Plan a longer hold.
- Cedar County population projected to shrink 9% by 2050 — rents likely to lag national; underwrite the cash flow, not the appreciation.
Negotiation context
- Only 8 days on market — expect competitive offers; lowballing is unlikely to land.
- 9 sale attempts since 13y ago with the ask held roughly flat each time — persistent listings suggest the price (not the market) is what's stuck; bring a comps-based counter.
Risks & watch-outs
- Watch-outs: property tax is 2.5% of price; built in 1948 — expect roof / HVAC / electrical / plumbing capex.
Questions for the listing agent
- Built in 1948 — when were the roof, HVAC, electrical panel, plumbing, and water heater last replaced?
- Property tax is high relative to price — has the assessment been appealed recently, and will the sale trigger a re-assessment?
- Is there a deadline driving the sale (1031 exchange, divorce, estate, relocation)? That informs how much negotiation room exists.
- Schools are B-rated — typically a magnet for longer-tenancy family renters. What's the average tenant stay here, and is there a school-zone premium baked into asking?
- What's the average days-on-market for RENTAL listings here right now (not sales)? A rising rental-DOM trend means longer vacancies and softer asking-rent achievability than the comps imply.
- What's the recent tenant-quality profile in this submarket — average credit score on applications, eviction rate, late-payment / NSF rate, and stable-employment percentage? A property-management company in the area should have these aggregated.
- How much new for-sale + rental construction is in the pipeline within 1–3 miles? Heavy new supply typically softens prices + rents 12–24 months out; constrained supply supports both.
Investment metrics
- 1% rule
- 1.07% ✓
- Cap rate
- 7.07%
- Cash-on-cash
- 2.79%
- DSCR
- 1.12
- GRM
- 7.8
CMA / ARV
- ARV (on-the-fly)
- $104,832
- Comps found
- 2
Show comp detail 2 sales within ~0.75 mi
| Address | Dist | Beds/Ba | Sqft | Sold | Price | $/sf | Match |
|---|---|---|---|---|---|---|---|
| 511 W 8th St | 0.00mi | 2/1.0 | 712 (+6%) | 3mo | $68,000 | $96 | 87 |
| 1014 Sycamore St | 0.29mi | 2/1.0 | 739 (+10%) | 22mo | $115,000 | $156 | 52 |
Match score weights: distance 35% · size 25% · config 20% · recency 20%. Top-matched comps best support the ARV.
Projected returns pro-forma
-3.0% appreciation · 3.0% rent growth · sell at horizon
- IRR
- -11.8%
- Equity multiple
- 0.57×
- Total profit
- $-8,990
- Equity at exit
- $11,183
- IRR
- -2.5%
- Equity multiple
- 0.83×
- Total profit
- $-3,613
- Equity at exit
- $6,485
Cash invested: $21,000 (down + closing). Projections, not guarantees.
Landlord ↔ Tenant lean methodology
- Overall (STATE)
- 83 Strongly Landlord-Friendly
- State Iowa
- 83 Strongly Landlord-Friendly · R+6
- County
- — inherits STATE
- City
- — inherits STATE
ZIP-level market 52772
- Home prices YoY
- -13.7%
- Active inventory
- 63
- Price-to-rent
- 7.8×
Monthly cashflow live
- Estimated rent
- $799 medium interval (Pro) →
- Mortgage (P&I)
- −$393
- Tax from tax record
- −$158 /mo · $1,894/yr
- Insurance
- −$31
- HOA
- −$0
- Vacancy / Maint / Mgmt
- −$168
- Net cashflow
- $49
Break-even live
Sensitivity live
| Price | -10% $91 | -5% $70 | +0% $49 | +5% $28 | +10% $6 |
|---|---|---|---|---|---|
| Rent | -10% $-14 | -5% $17 | +0% $49 | +5% $80 | +10% $112 |
| Rate | -1.0pp $87 | -0.5pp $68 | base $49 | +0.5pp $29 | +1.0pp $10 |
UW: 25.0% down · 7.5% · 30yr · 1.5% tax · 5.0% vac · 8.0% maint · 8.0% mgmt
Financing live
Cash to close
- Down payment
- $18,750
- Closing costs
- $2,250
- Reserves months
- —
- Total cash needed
- —
Loan-product check · same deal, 3 products live
Conventional
25% down · 7.5% · 30yr
- Down + closing
- —
- Monthly P&I
- —
- Monthly cashflow
- —
- DSCR
- —
- Eligible?
- —
Personal DTI + credit; lowest rate.
DSCR
20% down · 8.5% · 30yr
- Down + closing
- —
- Monthly P&I
- —
- Monthly cashflow
- —
- DSCR
- —
- Eligible?
- —
No personal income docs; deal must DSCR.
Hard money
10% down · 12.0% · 12mo
- Down + closing
- —
- Monthly P&I
- —
- Monthly cashflow
- —
- DSCR
- —
- Eligible?
- —
Short-term bridge; refi at stabilization.
Listing history 28 events
-
2026-05-24status Pending
-
2026-05-24status Pending
-
2026-05-22status Pending
-
2026-03-10soldstatus $68,000
-
2026-03-09soldstatus $68,000 Closed
-
2026-03-09soldstatus $68,000 Closed
-
2026-03-09soldstatus $68,000 Closed
-
2026-03-09soldstatus $68,000 Closed
-
2026-02-04status Pending
-
2026-01-27status Active
-
2026-01-08status Pending
-
2026-01-05historical
-
2025-11-25status Pending
-
2025-11-25historical
-
2025-11-25historical
-
2025-11-20$75,000
-
2025-11-20Active
-
2017-10-24soldstatus $67,375
-
2017-10-13soldstatus $67,500
-
2017-10-13soldstatus $67,500
-
2017-10-13soldstatus $67,500
-
2017-10-13soldstatus $67,500
-
2017-04-10$67,500
-
2017-04-10$67,500
-
2017-04-10$67,500
-
2017-04-10$67,500
-
2013-09-03$47,500
-
2013-09-03$47,500
ⓘ Source: listings_history table (triggers on properties + properties_extension) + one-shot
backfill from property_details.listing_events for pre-trigger history.
Tax reassessment forecast IA · Partial reset (capped growth)
- Current annual tax
- $1,894 · $158/mo
- Projected year-2 tax
- $1,894 · $158/mo
- Expected delta
- $0/yr ($0/mo · 0.0%)
ⓘ Screening estimate from a state-policy table — verify with the county assessor before closing.
Climate risk First Street
- Flood 1/10 Low FEMA zone X (unshaded) · 0% chance over 30 yrs
- Wildfire 1/10 Low
- Heat 3/10 Moderate 7 d/yr ≥103°F today · 16 d/yr by 30 yrs out
- Wind 2/10 Low
- Air quality 2/10 Low 1 unhealthy d/yr today · 2 by 30 yrs out
Nearby sold comps map
Loading sold comps map…
Walkable amenities ~0.75 mi
Loading nearby amenities…
Taxation est. · year 1
- Rental income
- $9,589
- − Mortgage interest
- −$4,201
- − Property taxes
- −$1,894
- − Insurance
- −$375
- − Repairs & maintenance
- −$767
- − Management
- −$767
- − Depreciation
- −$2,182
- Taxable loss
- −$598
- Est. tax savings @ 24.0%
- +$143
- After-tax cash flow
- $730/yr
For passive investors: Depreciation is non-cash, so a rental often shows a tax loss while cash-flowing — sheltering income. Rental losses are passive: they offset passive income freely, and up to $25,000/yr can offset ordinary (W-2) income if you actively participate and your MAGI is under $100k (phasing out to $0 by $150k); unused losses carry forward. On sale, claimed depreciation is recaptured at up to 25%, and gains may owe capital-gains tax (a 1031 exchange can defer both). Figures are a year-1 estimate at your 24.0% rate — not tax advice; consult a CPA.
Schools (NCES district)
- District
- Tipton Community School District
- NCES district ID
- 1927870
- Math proficiency
- 62% ▼ -7.00%
- Reading proficiency
- 72% ▲ 5.00%
- Median HH income
- $55,497
- Composite
- 57.37/100
- National rank
- #1079
- State rank
- #171 of 289 in IA
Livability — Tipton
- Score
- 79/100
- State rank
- #111
- US rank
- #2123
Category grades
Schools grade is shown separately in the Schools card above.
Census & demographics
- Census place
- Tipton, IA
- Population (ZIP)
- 5,186
Population outlook (Cedar County) Hauer SSP2
- Today (2025)
- 18,416 people
- By 2030
- 18,294 · -0.7%
- By 2040
- 17,771 · -3.5%
- By 2050
- 16,841 · -8.6%
- By 2075
- 14,503 · -21.2%
- By 2100
- 11,301 · -38.6%
Race, ethnicity, and origin ACS 2023
- Neighborhood character
- Predominantly White (94%)
- Race & ethnicity
- White 94% Two or more races 3% Hispanic / Latino 1%
- Common ancestry
- Portuguese 3% Lithuanian 3% Italian 2%
- Foreign-born
- 1% · Canada
- Languages at home
- 99% English-only · Spanish 1%
Political lean MEDSL · Cedar
- 2024 margin
- Strong R (+21.8) · D 38.4% · R 60.1% · Other 1.5%
- 2008→2024 swing
- -31.4pp toward R · 2008: 9.6pp · 2024: -21.8pp
- All cycles
- 2024: R+21.8 2020: R+17.0 2016: R+18.1 2012: D+4.4 2008: D+9.6
Not yet ingested
- Civics
- —
Market trends
- HPI YoY
- ▼ -32.33%
- Current HPI
- 203.8004
- Rent YoY
- —
- Metro
- —
- State GDP YoY
- ▲ 2.48%
- F500 in state
- 4
Industry mix (Fortune 500 HQ in IA)
| Industry | F500 HQs | Revenue |
|---|---|---|
| Financial Services | 1 | $16B |
|
||
| Retail / Convenience | 1 | $15B |
|
||
Price history
+43.2% since first listed28 events — show timeline
- 2026-05-24 Pending — MRED as Distributed by MLS Grid
- 2026-05-24 Pending — MRED as Distributed by MLS Grid
- 2026-05-22 Pending — MRED as Distributed by MLS Grid
- 2026-03-10 Sold (Public Records) $68,000 Public Records
- 2026-03-09 Sold (MLS) $68,000 MRED as Distributed by MLS Grid
- 2026-03-09 Sold (MLS) $68,000 MRED as Distributed by MLS Grid
- 2026-03-09 Sold (MLS) $68,000 MRED as Distributed by MLS Grid
- 2026-03-09 Sold (MLS) $68,000 MRED as Distributed by MLS Grid
- 2026-02-04 Pending — MRED as Distributed by MLS Grid
- 2026-01-27 Relisted — MRED as Distributed by MLS Grid
- 2026-01-08 Pending — MRED as Distributed by MLS Grid
- 2026-01-05 Listing Removed — MRED as Distributed by MLS Grid
- 2025-11-25 Pending — RMLSA as Distributed by MLS Grid
- 2025-11-25 Listing Removed — RMLSA as Distributed by MLS Grid
- 2025-11-25 Listing Removed — MRED as Distributed by MLS Grid
- 2025-11-20 Listed — RMLSA as Distributed by MLS Grid
- 2025-11-20 Listed $75,000 MRED as Distributed by MLS Grid
- 2017-10-24 Sold (Public Records) $67,375 Public Records
- 2017-10-13 Sold (MLS) $67,500 ICAARMLS
- 2017-10-13 Sold (MLS) $67,500 CRAAR, CDRMLS
- 2017-10-13 Sold (MLS) $67,500 RMLSA as Distributed by MLS Grid
- 2017-10-13 Sold (MLS) $67,500 MRED as Distributed by MLS Grid
- 2017-04-10 Listed $67,500 ICAARMLS
- 2017-04-10 Listed $67,500 CRAAR, CDRMLS
- 2017-04-10 Listed $67,500 RMLSA as Distributed by MLS Grid
- 2017-04-10 Listed $67,500 MRED as Distributed by MLS Grid
- 2013-09-03 Listed $47,500 CRAAR, CDRMLS
- 2013-09-03 Listed $47,500 ICAARMLS
Property tax history
+9.0%/yrLatest (2025): $1,894 · +44.4% YoY. Source: county tax records.
Cash-flow waterfall
monthlySold comps — $/sqft
last 12 mo · ≤1 miLoading sold comps…