710 N Broadway · Kennard, TX
Flood risk 1/10 · Minimal
- FEMA flood zone
- X (unshaded)
- Chance of flooding over 30 yrs
- 0.0%
- Est. flood insurance / yr
- $507 – $1,088
Fire risk 5/10 · Moderate
- Est. fire insurance / yr
- $1,222 – $2,270
Heat risk 7/10 · Major
- Hot days now (above 110°F)
- 7 days/yr
- Hot days in 30 yrs
- 25 days/yr
Wind risk 8/10 · Major
- Chance of severe wind over 30 yrs
- 80.0%
Air-quality risk 1/10 · Minimal
- Unhealthy air days now
- 0 days/yr
- Unhealthy air days in 30 yrs
- 0 days/yr
Risk factors via First Street. Map © Google.
Why this score? — see what drove the D grade
The composite is a weighted blend of 9 inputs, each scored 0–100. Each bar is that input's sub-score; the figure is the points it added to the 100-point composite (weight × sub-score).
- Cash flow +15.3/30.0
- Appreciation +5.6/10.0
- DSCR +4.7/10.0
- 1% rule +3.9/10.0
- Schools +3.8/10.0
- Livability +3.0/5.0
- Rent growth +2.5/5.0
- Condition / age +2.5/5.0
- ARV discount +0.0/15.0
$129,500
🖨 Deal sheet (PDF) 📄 Offer letter ✓ Due diligence
Listing remarks MLS
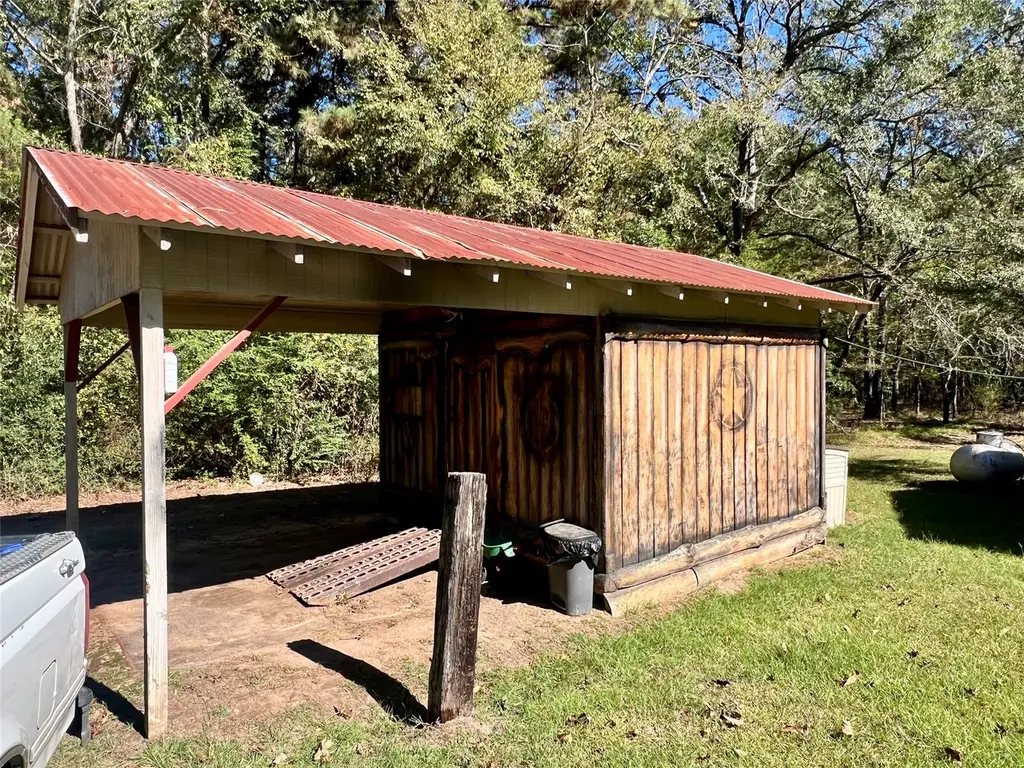
3 BR, 1 bath home on 1.6 acres adjacent to Davy Crockett National Forest. Country living with in town amenities, public water and sewer. Carport with additional storage. Priced to sell!
Key facts
- Public sewer
- 1.6 acres
- Carport
Tags
Neighborhood map
What this means for you Summary
Snapshot
- This is a 3-bed/2.0-bath single-family listed at $130k.
Deal economics
- At list price, monthly cash flow is $48 ($573/yr) — positive.
- The deal already cash-flows at list — no discount required.
- To meet the 1% rule (rent ≥ 1% of price), the offer needs to be $115k (11.3% below list).
- Recommended offer: $114k (12.0% below list) — sets the bar for market timing.
Location & tenants
- Location reads 60/100 on livability (#1,083 in TX) — a middle-class / working-renter tenant base. Strengths: cost of living A+, housing A+; Watch: crime F, amenities F, commute F.
- Kennard ISD (rural): math 45% / reading 40% proficiency, ranked #670 of 1,141 in TX (top 59%) — families likely to look elsewhere, expect single-tenant / working-renter base with shorter leases; 63% free/reduced lunch — lower-income household profile, screen leases tightly.
- Zoned schools: Kennard Isd (math 37% / reading 37%, 258 students, 67% FRL) — zoned schools at 67% FRL track the district average.
- Market conditions: 40 active listings in the ZIP; 3 units permitted in Houston County in 2024 (0 in 5+ unit buildings).
Forward outlook
- In year one you build about $2k of equity ($895 loan paydown + $1k appreciation (1.1% local appreciation)).
- Houston County population projected at -16% by 2050 — secular population decline; favor cash flow + early exit over multi-decade hold.
- At projected returns (1.1% appreciation + 3.0% rent growth), your $36k cash investment doubles in ~9 years — after that, you're playing with house money.
Negotiation context
- It's been on market 233 days — a 12% lower offer ($114k) is reasonable based on typical stale-listing flexibility.
- 2 sale attempts; this cycle's ask has dropped $20k (14%) from the opening price — seller is motivated, your offer sets the floor, not the list.
Risks & watch-outs
- Watch-outs: built in 1947 — expect roof / HVAC / electrical / plumbing capex.
- Climate carrying-cost: severe wind risk, 80% chance of damaging wind over 30y; moderate wildfire risk; extreme-heat days projected 7→25/yr by 2055 (HVAC capex compounding) — expect insurance premiums to compound above CPI over the hold.
Questions for the listing agent
- It's been on market 233 days. Have you received any prior offers? Is the seller open to a 12% concession, seller financing, or rate buy-down credit?
- Built in 1947 — when were the roof, HVAC, electrical panel, plumbing, and water heater last replaced?
- Why hasn't it sold? Are there any deal-killer items the seller is aware of (foundation, flood, title, zoning, code violations)?
- Is there a deadline driving the sale (1031 exchange, divorce, estate, relocation)? That informs how much negotiation room exists.
- Schools are D-rated, which usually means shorter tenancies and higher turnover. Who's the typical renter profile here, and what's been the actual vacancy rate?
- Crime grade is F in this area — have there been break-ins, vandalism, or insurance claims at this property in the last 3 years? What carrier currently insures it and at what premium?
- The area grade is low — what's the realistic commute time and amenity access for the typical tenant pool here? Any planned neighborhood developments (good or bad) we should know about?
- What's the average days-on-market for RENTAL listings here right now (not sales)? A rising rental-DOM trend means longer vacancies and softer asking-rent achievability than the comps imply.
- What's the recent tenant-quality profile in this submarket — average credit score on applications, eviction rate, late-payment / NSF rate, and stable-employment percentage? A property-management company in the area should have these aggregated.
- How much new for-sale + rental construction is in the pipeline within 1–3 miles? Heavy new supply typically softens prices + rents 12–24 months out; constrained supply supports both.
Investment metrics
- 1% rule
- 0.89% ✗
- Cap rate
- 6.74%
- Cash-on-cash
- 1.58%
- DSCR
- 1.07
- GRM
- 9.4
CMA / ARV
- ARV (median comp)
- $106,587
- List price
- $129,500
- Delta
- 21.50%
- Verdict
- OVERPRICED
- Comps
- 4 within 1.0 mi
Show comp detail 2 sales within ~0.75 mi
| Address | Dist | Beds/Ba | Sqft | Sold | Price | $/sf | Match |
|---|---|---|---|---|---|---|---|
| 103 S Broadway | 0.49mi | 3/2.0 | 1,248 (+3%) | 20mo | $139,500 | $112 | 55 |
| 311 Agnes St | 0.33mi | 3/1.0 | 1,344 (+11%) | 17mo | $80,000 | $60 | 48 |
Match score weights: distance 35% · size 25% · config 20% · recency 20%. Top-matched comps best support the ARV.
Projected returns pro-forma
1.14% appreciation · 3.0% rent growth · sell at horizon
- IRR
- 3.4%
- Equity multiple
- 1.18×
- Total profit
- $6,375
- Equity at exit
- $45,184
- IRR
- 7.8%
- Equity multiple
- 1.96×
- Total profit
- $34,903
- Equity at exit
- $60,807
Cash invested: $36,260 (down + closing). Projections, not guarantees.
Landlord ↔ Tenant lean methodology
- Overall (STATE)
- 87 Strongly Landlord-Friendly
- State Texas
- 87 Strongly Landlord-Friendly · R+5
- County
- — inherits STATE
- City
- — inherits STATE
ZIP-level market 75847
- Home prices YoY
- 1.3%
- Active inventory
- 40
- Price-to-rent
- 9.4×
Monthly cashflow live
- Estimated rent
- $1,149 medium interval (Pro) →
- Mortgage (P&I)
- −$679
- Tax from tax record
- −$127 /mo · $1,522/yr
- Insurance
- −$54
- HOA
- −$0
- Vacancy / Maint / Mgmt
- −$241
- Net cashflow
- $48
Break-even live
Sensitivity live
| Price | -10% $121 | -5% $84 | +0% $48 | +5% $11 | +10% $-26 |
|---|---|---|---|---|---|
| Rent | -10% $-43 | -5% $2 | +0% $48 | +5% $93 | +10% $139 |
| Rate | -1.0pp $113 | -0.5pp $81 | base $48 | +0.5pp $14 | +1.0pp $-20 |
UW: 25.0% down · 7.5% · 30yr · 1.5% tax · 5.0% vac · 8.0% maint · 8.0% mgmt
Financing live
Cash to close
- Down payment
- $32,375
- Closing costs
- $3,885
- Reserves months
- —
- Total cash needed
- —
Loan-product check · same deal, 3 products live
Conventional
25% down · 7.5% · 30yr
- Down + closing
- —
- Monthly P&I
- —
- Monthly cashflow
- —
- DSCR
- —
- Eligible?
- —
Personal DTI + credit; lowest rate.
DSCR
20% down · 8.5% · 30yr
- Down + closing
- —
- Monthly P&I
- —
- Monthly cashflow
- —
- DSCR
- —
- Eligible?
- —
No personal income docs; deal must DSCR.
Hard money
10% down · 12.0% · 12mo
- Down + closing
- —
- Monthly P&I
- —
- Monthly cashflow
- —
- DSCR
- —
- Eligible?
- —
Short-term bridge; refi at stabilization.
Listing history 21 events
-
2026-06-19days on market $129,500 Active 233 DOM
-
2026-06-18days on market $129,500 Active 232 DOM
-
2026-06-17days on market $129,500 Active 231 DOM
-
2026-06-16days on market $129,500 Active 230 DOM
-
2026-06-15days on market $129,500 Active 229 DOM
-
2026-06-14days on market $129,500 Active 227 DOM
-
2026-06-13days on market $129,500 Active 226 DOM
-
2026-06-10days on market $129,500 Active 224 DOM
-
2026-06-09days on market $129,500 Active 223 DOM
-
2026-06-08days on market $129,500 Active 222 DOM
-
2026-06-07days on market $129,500 Active 221 DOM
-
2026-06-05days on market $129,500 Active 218 DOM
-
2026-06-03days on market $129,500 Active 217 DOM
-
2026-06-02days on market $129,500 Active 216 DOM
-
2026-06-01days on market $129,500 Active 215 DOM
-
2026-05-31days on market $129,500 Active 214 DOM
-
2026-05-30days on market $129,500 Active 213 DOM
-
2026-05-13price $129,500 185-char remark
Show marketing remark (185 chars)
3 BR, 1 bath home on 1.6 acres adjacent to Davy Crockett National Forest. Country living with in town amenities, public water and sewer. Carport with additional storage. Priced to sell!
-
2026-05-01price $129,500 185-char remark
Show marketing remark (185 chars)
3 BR, 1 bath home on 1.6 acres adjacent to Davy Crockett National Forest. Country living with in town amenities, public water and sewer. Carport with additional storage. Priced to sell!
-
2025-11-04$150,000 Active 185-char remark
Show marketing remark (185 chars)
3 BR, 1 bath home on 1.6 acres adjacent to Davy Crockett National Forest. Country living with in town amenities, public water and sewer. Carport with additional storage. Priced to sell!
-
2025-10-29$150,000 Active 185-char remark
Show marketing remark (185 chars)
3 BR, 1 bath home on 1.6 acres adjacent to Davy Crockett National Forest. Country living with in town amenities, public water and sewer. Carport with additional storage. Priced to sell!
ⓘ Source: listings_history table (triggers on properties + properties_extension) + one-shot
backfill from property_details.listing_events for pre-trigger history.
Tax reassessment forecast TX · Resets to sale price
- Current annual tax
- $1,522 · $127/mo
- Projected year-2 tax
- $2,370 · $197/mo
- Expected delta
- +$848/yr (+$71/mo · 55.7%)
ⓘ Screening estimate from a state-policy table — verify with the county assessor before closing.
Climate risk First Street
- Flood 1/10 Low FEMA zone X (unshaded) · 0% chance over 30 yrs
- Wildfire 5/10 Major
- Heat 7/10 Severe 7 d/yr ≥110°F today · 25 d/yr by 30 yrs out
- Wind 8/10 Severe 80% chance of damaging wind over 30 yrs
- Air quality 1/10 Low 0 unhealthy d/yr today · 0 by 30 yrs out
Nearby sold comps map
Loading sold comps map…
Walkable amenities ~0.75 mi
Loading nearby amenities…
Taxation est. · year 1
- Rental income
- $13,787
- − Mortgage interest
- −$7,254
- − Property taxes
- −$1,522
- − Insurance
- −$648
- − Repairs & maintenance
- −$1,103
- − Management
- −$1,103
- − Depreciation
- −$3,767
- Taxable loss
- −$1,610
- Est. tax savings @ 24.0%
- +$386
- After-tax cash flow
- $959/yr
For passive investors: Depreciation is non-cash, so a rental often shows a tax loss while cash-flowing — sheltering income. Rental losses are passive: they offset passive income freely, and up to $25,000/yr can offset ordinary (W-2) income if you actively participate and your MAGI is under $100k (phasing out to $0 by $150k); unused losses carry forward. On sale, claimed depreciation is recaptured at up to 25%, and gains may owe capital-gains tax (a 1031 exchange can defer both). Figures are a year-1 estimate at your 24.0% rate — not tax advice; consult a CPA.
Schools (NCES district)
- District
- Kennard ISD
- NCES district ID
- 4825470
- Math proficiency
- 45% ▲ 20.00%
- Reading proficiency
- 40% ▲ 10.00%
- Median HH income
- $36,315
- Composite
- 37.6/100
- National rank
- #8840
- State rank
- #670 of 1141 in TX
Livability — Kennard
- Score
- 60/100
- State rank
- #1083
- US rank
- #19135
Category grades
Schools grade is shown separately in the Schools card above.
Census & demographics
- Census place
- Kennard, TX
- Population (ZIP)
- 1,441
Population outlook (Houston County) Hauer SSP2
- Today (2025)
- 21,269 people
- By 2030
- 20,568 · -3.3%
- By 2040
- 19,255 · -9.5%
- By 2050
- 17,980 · -15.5%
- By 2075
- 15,214 · -28.5%
- By 2100
- 11,720 · -44.9%
Race, ethnicity, and origin ACS 2023
- Neighborhood character
- Predominantly White (86%)
- Race & ethnicity
- White 86% Black 7% Two or more races 6%
- Common ancestry
- Serbian 2% Slovak 2% Scotch-Irish 1%
Political lean MEDSL · Houston
- 2024 margin
- Solid R (+55.4) · D 22.1% · R 77.4%
- 2008→2024 swing
- -18.1pp toward R · 2008: -37.3pp · 2024: -55.4pp
- All cycles
- 2024: R+55.4 2020: R+50.3 2016: R+50.9 2012: R+44.3 2008: R+37.3
Not yet ingested
- Civics
- —
Market trends
- HPI YoY
- ▲ 1.14%
- Current HPI
- 87.4575
- Rent YoY
- —
- Metro
- —
- State GDP YoY
- ▲ 3.95%
- F500 in state
- 110
Industry mix (Fortune 500 HQ in TX)
| Industry | F500 HQs | Revenue |
|---|---|---|
| Energy | 16 | $1,198B |
|
||
| Technology | 5 | $198B |
|
||
| Engineering / Construction | 4 | $72B |
|
||
| Energy Services | 3 | $60B |
|
||
| Utilities | 3 | $41B |
|
||
| Healthcare | 2 | $330B |
|
||
Price history
-13.7% since first listed4 events — show timeline
- 2026-05-13 Price Changed $129,500 PAOR
- 2026-05-01 Price Changed $129,500 HARMLS
- 2025-11-04 Listed $150,000 PAOR
- 2025-10-29 Listed $150,000 HARMLS
Property tax history
+6.3%/yrLatest (2025): $1,522 · -2.8% YoY. Source: county tax records.
Cash-flow waterfall
monthlySold comps — $/sqft
last 12 mo · ≤1 miLoading sold comps…