 🏗️ New Construction
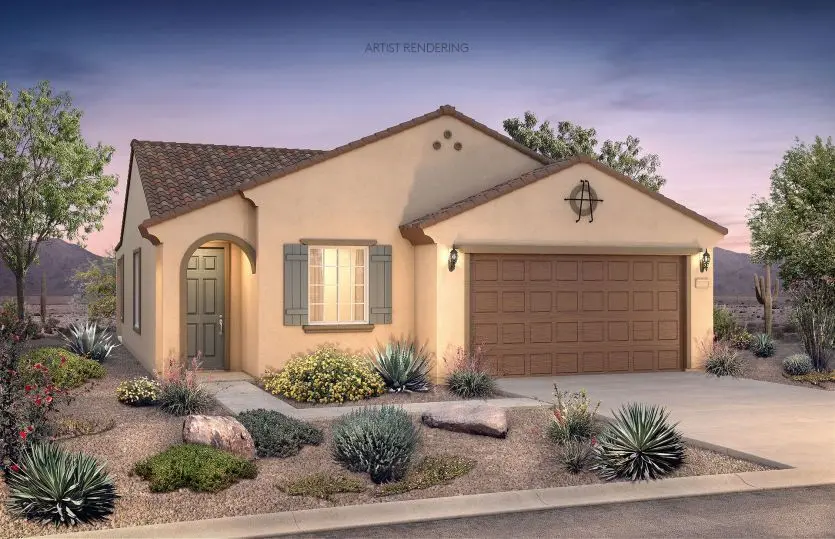
Venture Plan · Buckeye, AZ
Flood risk 1/10 · Minimal
- FEMA flood zone
- X (shaded)
- Chance of flooding over 30 yrs
- 0.0%
- Est. flood insurance / yr
- $507 – $1,088
Fire risk 5/10 · Moderate
- Est. fire insurance / yr
- $610 – $1,132
Heat risk 8/10 · Major
- Hot days now (above 111°F)
- 6 days/yr
- Hot days in 30 yrs
- 16 days/yr
Wind risk 1/10 · Minimal
- Chance of severe wind over 30 yrs
- —
Air-quality risk 2/10 · Minimal
- Unhealthy air days now
- 0 days/yr
- Unhealthy air days in 30 yrs
- 1 days/yr
Risk factors via First Street. Map © Google.
Why this score? — see what drove the F grade
The composite is a weighted blend of 9 inputs, each scored 0–100. Each bar is that input's sub-score; the figure is the points it added to the 100-point composite (weight × sub-score).
- ARV discount +7.5/15.0
- Cash flow +4.7/30.0
- Rent growth +3.4/5.0
- Livability +3.4/5.0
- Schools +2.9/10.0
- Condition / age +2.5/5.0
- 1% rule +0.6/10.0
- DSCR +0.0/10.0
- Appreciation +0.0/10.0
$334,990
🖨 Deal sheet 📄 Offer letter ✓ Due diligence
Listing remarks MLS
The Venture features 2 bedrooms, 2 baths, generous living space and stylish finishes. The large gathering room opens to the covered patio providing abundant natural light and openness. This plan also features an elegant owner's suite with a large walk-in closet.
Key facts
- 2 garage spots
- Listed 953 days
Neighborhood map
What this means for you Summary
Snapshot
- This is a 2-bed/2.0-bath single-family listed at $335k.
Deal economics
- At list price, monthly cash flow is $-1k ($-13k/yr) — negative.
- To cash-flow at today's rent, offer at most $280k (16.3% below list).
- To meet the 1% rule (rent ≥ 1% of price), the offer needs to be $245k (26.8% below list).
- Recommended offer: $245k (26.8% below list) — sets the bar for 1% rule.
Location & tenants
- Location reads 68/100 on livability (#53 in AZ) — a middle-class / working-renter tenant base. Strengths: employment A+, housing A+, crime A; Watch: schools D+, amenities F, commute F.
- Wickenburg Unified District (4236) (rural): math 33% / reading 35% proficiency, ranked #92 of 249 in AZ (top 37%) — families likely to look elsewhere, expect single-tenant / working-renter base with shorter leases.
- Market conditions: Rents rising (+3.4%/yr); 939 active listings in the ZIP; 13 comparable units currently listed for rent nearby; rentals leasing fast (median 5d on market — plan ~1-2 weeks tenant-placement turnaround); high-income renter base; 36,011 units permitted in Maricopa County in 2024 (12,801 in 5+ unit buildings).
Forward outlook
- Local home prices are declining (-3.0%/yr); year-one equity from $3k of loan paydown is wiped out by about $13k of value loss. Plan a longer hold.
- Maricopa County population projected at +38% by 2050 — long-run rental-demand tailwind backs the buy-and-hold thesis.
Negotiation context
- It's been on market 953 days — a 12% lower offer ($295k) is reasonable based on typical stale-listing flexibility.
Risks & watch-outs
- Climate carrying-cost: moderate wildfire risk; extreme-heat days projected 6→16/yr by 2055 (HVAC capex compounding) — expect insurance premiums to compound above CPI over the hold.
Questions for the listing agent
- What do current leases actually rent for vs. the listed asking? Can we see a recent rent roll and the last 12 months of T-12 income?
- It's been on market 953 days. Have you received any prior offers? Is the seller open to a 27% concession, seller financing, or rate buy-down credit?
- Why hasn't it sold? Are there any deal-killer items the seller is aware of (foundation, flood, title, zoning, code violations)?
- Is there a deadline driving the sale (1031 exchange, divorce, estate, relocation)? That informs how much negotiation room exists.
- Schools are D-rated, which usually means shorter tenancies and higher turnover. Who's the typical renter profile here, and what's been the actual vacancy rate?
- The area grade is low — what's the realistic commute time and amenity access for the typical tenant pool here? Any planned neighborhood developments (good or bad) we should know about?
- What's the average days-on-market for RENTAL listings here right now (not sales)? A rising rental-DOM trend means longer vacancies and softer asking-rent achievability than the comps imply.
- What's the recent tenant-quality profile in this submarket — average credit score on applications, eviction rate, late-payment / NSF rate, and stable-employment percentage? A property-management company in the area should have these aggregated.
- How much new for-sale + rental construction is in the pipeline within 1–3 miles? Heavy new supply typically softens prices + rents 12–24 months out; constrained supply supports both.
Investment metrics
- 1% rule
- 0.56% ✗
- Cap rate
- 3.30%
- Cash-on-cash
- -10.70%
- DSCR
- 0.52
- GRM
- 14.9
CMA / ARV
- ARV (median comp)
- $438,863
- List price
- $334,990
- Delta
- -23.67%
- Verdict
- UNDERPRICED
- Comps
- 20 within 1.0 mi
Show comp detail 12 sales within ~0.75 mi
| Address | Dist | Beds/Ba | Sqft | Sold | Price | $/sf | Match |
|---|---|---|---|---|---|---|---|
| 18860 N 262nd Ln | 0.15mi | 2/2.0 | 1,575 (+13%) | 4mo | $455,000 | $289 | 67 |
| 26123 W Oraibi Dr | 0.56mi | 2/2.0 | 1,398 (+0%) | 8mo | $300,000 | $215 | 66 |
| 26651 W Kimberly Way | 0.34mi | 2/2.0 | 1,574 (+13%) | 3mo | $446,990 | $284 | 60 |
| 19794 N 264th Ave | 0.60mi | 2/2.0 | 1,494 (+7%) | 1mo | $340,000 | $228 | 59 |
| 26126 W Piute Ave | 0.54mi | 2/2.0 | 1,261 (-9%) | 2mo | $300,000 | $238 | 58 |
| 18885 N 266th Ave | 0.31mi | 2/2.0 | 1,574 (+13%) | 8mo | $411,900 | $262 | 57 |
| 26797 W Mcrae Dr | 0.49mi | 2/2.0 | 1,575 (+13%) | 0mo | $400,000 | $254 | 55 |
| 26080 W Sequoia Dr | 0.66mi | 3/2.0 (+1) | 1,345 (-3%) | 9mo | $325,000 | $242 | 51 |
| 26820 W Kerry Ln | 0.59mi | 2/2.0 | 1,574 (+13%) | 0mo | $452,700 | $288 | 50 |
| 19667 N 260th Ln | 0.68mi | 3/2.0 (+1) | 1,494 (+7%) | 4mo | $344,000 | $230 | 48 |
| 25920 W Westcott Dr | 0.61mi | 2/2.0 | 1,569 (+13%) | 11mo | $439,000 | $280 | 41 |
| 26938 W Rosemonte Dr | 0.65mi | 2/2.0 | 1,574 (+13%) | 11mo | $393,810 | $250 | 39 |
Match score weights: distance 35% · size 25% · config 20% · recency 20%. Top-matched comps best support the ARV.
Projected returns pro-forma
-3.0% appreciation · 3.41% rent growth · sell at horizon
- IRR
- -35.3%
- Equity multiple
- -0.14×
- Total profit
- $-139,871
- Equity at exit
- $65,436
- IRR
- -44.2%
- Equity multiple
- -0.69×
- Total profit
- $-207,335
- Equity at exit
- $37,945
Cash invested: $122,882 (down + closing). Projections, not guarantees.
Landlord ↔ Tenant lean methodology
- Overall (STATE)
- 87 Strongly Landlord-Friendly
- State Arizona
- 87 Strongly Landlord-Friendly · R+3
- County
- — inherits STATE
- City
- — inherits STATE
ZIP-level market 85396
- Home prices YoY
- -18.8%
- Rents YoY
- 3.4%
- Active inventory
- 939
- Price-to-rent
- 11.4×
Monthly cashflow live
- Estimated rent
- $2,452 high interval (Pro) →
- Mortgage (P&I)
- −$2,301
- Tax est. 1.5%
- −$549 /mo · $6,583/yr
- Insurance
- −$183
- HOA
- −$0
- Vacancy / Maint / Mgmt
- −$515
- Net cashflow
- $-1,096
Break-even live
UW: 25.0% down · 7.5% · 30yr · 1.5% tax · 5.0% vac · 8.0% maint · 8.0% mgmt
Financing live
Cash to close
- Down payment
- $109,716
- Closing costs
- $13,166
- Reserves months
- —
- Total cash needed
- —
Loan-product check · same deal, 3 products live
Conventional
25% down · 7.5% · 30yr
- Down + closing
- —
- Monthly P&I
- —
- Monthly cashflow
- —
- DSCR
- —
- Eligible?
- —
Personal DTI + credit; lowest rate.
DSCR
20% down · 8.5% · 30yr
- Down + closing
- —
- Monthly P&I
- —
- Monthly cashflow
- —
- DSCR
- —
- Eligible?
- —
No personal income docs; deal must DSCR.
Hard money
10% down · 12.0% · 12mo
- Down + closing
- —
- Monthly P&I
- —
- Monthly cashflow
- —
- DSCR
- —
- Eligible?
- —
Short-term bridge; refi at stabilization.
Rent comps 13 comps
| Address | Beds | Baths | Sqft | Rent | $/sqft | DOM | Units | Dist |
|---|---|---|---|---|---|---|---|---|
| 18675 N 268th Ave Buckeye, AZ | 2.0 | 2.0 | 1865 | $1,799 | $0.96 | 44d | 1 | 0.49mi |
| 26087 W Tonto Ln Buckeye, AZ | 2.0 | 2.0 | 1625 | $2,300 | $1.42 | 44d | 1 | 0.69mi |
| 26182 W Tonto Ln Buckeye, AZ | 3.0 | 2.0 | 1625 | $1,695 | $1.04 | 3d | 1 | 0.71mi |
| 26781 W Oraibi Dr Buckeye, AZ | 2.0 | 2.0 | 1561 | $2,000 | $1.28 | 18d | 1 | 0.71mi |
| 26881 W Utopia Rd Buckeye, AZ | 2.0 | 2.0 | 1705 | $3,500 | $2.05 | 1d | 1 | 0.75mi |
| 26731 W Pontiac Dr Buckeye, AZ | 2.0 | 2.0 | 1373 | $1,475 | $1.07 | 3d | 1 | 1.00mi |
| 20669 N 266th Ave Buckeye, AZ | 3.0 | 2.0 | 1612 | $4,200 | $2.61 | 24d | 1 | 1.20mi |
| 26766 W Mohawk Ln Buckeye, AZ | 2.0 | 2.0 | 1375 | $2,500 | $1.82 | 4d | 1 | 1.21mi |
| 26477 W Ross Ave Buckeye, AZ | 3.0 | 2.0 | 1375 | $1,500 | $1.09 | 44d | 1 | 1.24mi |
| 20311 N 271st Ave Buckeye, AZ | 2.0 | 2.0 | 1612 | $3,000 | $1.86 | 1d | 1 | 1.31mi |
| 27389 W Wahalla Ln Buckeye, AZ | 2.0 | 2.5 | 1717 | $3,500 | $2.04 | 1d | 1 | 1.38mi |
| 27013 W Potter Dr Buckeye, AZ | 2.0 | 2.0 | 1612 | $4,200 | $2.61 | 44d | 1 | 1.44mi |
| 26237 W Matthew Dr Buckeye, AZ | 2.0 | 2.0 | 1646 | $3,500 | $2.13 | 1d | 1 | 1.45mi |
Listing history 17 events
-
2026-06-18days on market $334,990 Active 953 DOM
-
2026-06-17days on market $334,990 Active 952 DOM
-
2026-06-16days on market $334,990 Active 951 DOM
-
2026-06-15days on market $334,990 Active 950 DOM
-
2026-06-13days on market $334,990 Active 948 DOM
-
2026-06-13days on market $334,990 Active 947 DOM
-
2026-06-09days on market $334,990 Active 944 DOM
-
2026-06-08days on market $334,990 Active 943 DOM
-
2026-06-07days on market $334,990 Active 942 DOM
-
2026-06-04days on market $334,990 Active 939 DOM
-
2026-06-03days on market $334,990 Active 938 DOM
-
2026-06-02days on market $334,990 Active 937 DOM
-
2026-06-01days on market $334,990 Active 936 DOM
-
2026-05-31days on market $334,990 Active 935 DOM
-
2026-01-02price $334,990 262-char remark
Show marketing remark (262 chars)
The Venture features 2 bedrooms, 2 baths, generous living space and stylish finishes. The large gathering room opens to the covered patio providing abundant natural light and openness. This plan also features an elegant owner's suite with a large walk-in closet.
-
2025-07-04price $332,990 262-char remark
Show marketing remark (262 chars)
The Venture features 2 bedrooms, 2 baths, generous living space and stylish finishes. The large gathering room opens to the covered patio providing abundant natural light and openness. This plan also features an elegant owner's suite with a large walk-in closet.
-
2023-11-08$329,990 Active 262-char remark
Show marketing remark (262 chars)
The Venture features 2 bedrooms, 2 baths, generous living space and stylish finishes. The large gathering room opens to the covered patio providing abundant natural light and openness. This plan also features an elegant owner's suite with a large walk-in closet.
ⓘ Source: listings_history table (triggers on properties + properties_extension) + one-shot
backfill from property_details.listing_events for pre-trigger history.
Climate risk First Street
- Flood 1/10 Low FEMA zone X (shaded) · 0% chance over 30 yrs
- Wildfire 5/10 Major
- Heat 8/10 Severe 6 d/yr ≥111°F today · 16 d/yr by 30 yrs out
- Wind 1/10 Low
- Air quality 2/10 Low 0 unhealthy d/yr today · 1 by 30 yrs out
Nearby sold comps map
Loading sold comps map…
Walkable amenities ~0.75 mi
Loading nearby amenities…
Taxation est. · year 1
- Rental income
- $29,420
- − Mortgage interest
- −$24,583
- − Property taxes
- −$6,583
- − Insurance
- −$2,194
- − Repairs & maintenance
- −$2,354
- − Management
- −$2,354
- − Depreciation
- −$12,767
- Taxable loss
- −$21,415
- Est. tax savings @ 24.0%
- +$5,139
- After-tax cash flow
- $-8,013/yr
For passive investors: Depreciation is non-cash, so a rental often shows a tax loss while cash-flowing — sheltering income. Rental losses are passive: they offset passive income freely, and up to $25,000/yr can offset ordinary (W-2) income if you actively participate and your MAGI is under $100k (phasing out to $0 by $150k); unused losses carry forward. On sale, claimed depreciation is recaptured at up to 25%, and gains may owe capital-gains tax (a 1031 exchange can defer both). Figures are a year-1 estimate at your 24.0% rate — not tax advice; consult a CPA.
Schools (NCES district)
- District
- Wickenburg Unified District (4236)
- NCES district ID
- 0409190
- Math proficiency
- 33% ▼ -10.00%
- Reading proficiency
- 35% ▼ -7.00%
- Median HH income
- $47,369
- Composite
- 29.27/100
- National rank
- #6560
- State rank
- #92 of 249 in AZ
Livability — Buckeye
- Score
- 68/100
- State rank
- #53
- US rank
- #9428
Category grades
Schools grade is shown separately in the Schools card above.
Census & demographics
- Census place
- Buckeye, AZ
- County
- Maricopa County · 4,537,380 people
- City population
- 117,540
- Metro
- Phoenix-Mesa-Chandler, AZ
- Population (ZIP)
- 42,181
- Household income
- $114,056
- Rent vs Own
- Severe rent burden
- 156.0
Population outlook (Maricopa County) Hauer SSP2
- Today (2025)
- 4,979,203 people
- By 2030
- 5,378,229 · +8.0%
- By 2040
- 6,156,598 · +23.6%
- By 2050
- 6,872,376 · +38.0%
- By 2075
- 8,401,270 · +68.7%
- By 2100
- 9,247,439 · +85.7%
Race, ethnicity, and origin ACS 2023
- Neighborhood character
- Diverse neighborhood (Simpson 0.56)
- Race & ethnicity
- White 59% Hispanic / Latino 31% Two or more races 18% Black 4% Asian 2% Native American 1%
- Hispanic origin (detail)
- Mexican 25%
- Common ancestry
- Slovak 4% Portuguese 2% Italian 2%
- Foreign-born
- 8% · Canada, Vietnam
- Languages at home
- 85% English-only · Spanish 12% German/W. Germanic 1% Other Indo-European 1%
Political lean MEDSL · Maricopa
- 2024 margin
- Toss-up / Even · D 47.7% · R 51.2% · Other 1.1%
- 2008→2024 swing
- +7.1pp toward D · 2008: -10.6pp · 2024: -3.5pp
- All cycles
- 2024: R+3.5 2020: D+2.2 2016: R+3.5 2012: R+12.0 2008: R+10.6
Not yet ingested
- Civics
- —
Market trends
- HPI YoY
- ▼ -56.97%
- Current HPI
- 246.4705
- Rent YoY
- ▲ 3.41%
- Metro
- Phoenix-Mesa-Chandler, AZ
- State GDP YoY
- ▲ 4.54%
- F500 in state
- 20
Industry mix (Fortune 500 HQ in AZ)
| Industry | F500 HQs | Revenue |
|---|---|---|
| Technology | 2 | $13B |
|
||
| Mining / Metals | 1 | $23B |
|
||
| Environmental Services | 1 | $16B |
|
||
| Metals / Steel | 1 | $14B |
|
||
| Technology Distribution | 1 | $9B |
|
||
| Homebuilding | 1 | $8B |
|
||
Price history
+1.5% since first listed3 events — show timeline
- 2026-01-02 Price Changed $334,990 Zillow
- 2025-07-04 Price Changed $332,990 Zillow
- 2023-11-08 Listed $329,990 Zillow
Cash-flow waterfall
monthlySold comps — $/sqft
last 12 mo · ≤1 miLoading sold comps…