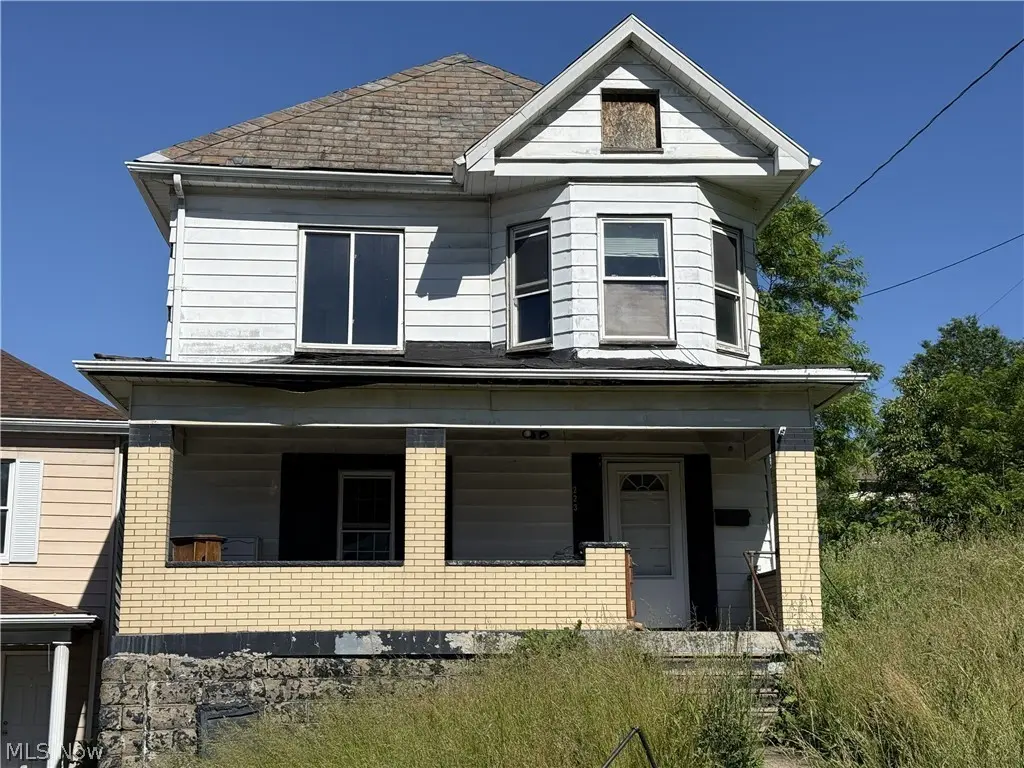
223 Ohio St · Steubenville, OH
Flood risk 1/10 · Minimal
- FEMA flood zone
- X (unshaded)
- Chance of flooding over 30 yrs
- 0.0%
- Est. flood insurance / yr
- $473 – $860
Fire risk 1/10 · Minimal
- Est. fire insurance / yr
- $713 – $1,323
Heat risk 3/10 · Minor
- Hot days now (above 97°F)
- 7 days/yr
- Hot days in 30 yrs
- 18 days/yr
Wind risk 1/10 · Minimal
- Chance of severe wind over 30 yrs
- —
Air-quality risk 2/10 · Minimal
- Unhealthy air days now
- 2 days/yr
- Unhealthy air days in 30 yrs
- 2 days/yr
Risk factors via First Street. Map © Google.
Why this score? — see what drove the B grade
The composite is a weighted blend of 9 inputs, each scored 0–100. Each bar is that input's sub-score; the figure is the points it added to the 100-point composite (weight × sub-score).
- Cash flow +30.0/30.0
- 1% rule +10.0/10.0
- DSCR +10.0/10.0
- ARV discount +7.5/15.0
- Schools +6.0/10.0
- Livability +3.8/5.0
- Rent growth +2.5/5.0
- Condition / age +2.5/5.0
- Appreciation +0.0/10.0
$29,900
🖨 Deal sheet 📄 Offer letter ✓ Due diligence
Listing remarks MLS
Investment opportunity near Franciscan University, highway access and all else Steubenville has to offer! Schedule a tour now!
Key facts
- Convenient location
- Easy highway access
- 3,920 sq ft lot
Tags
Property features AI
Exterior
- Parking: On-street parking
- Utilities: Public water; Public sewer
- Home design: 2 stories; Aluminum siding and brick exterior
- Construction: Built per public records; Asphalt/fiberglass roof
- Exterior features: Public water; Public sewer
Interior
- Bedrooms: 6 total rooms (bedroom count not specified)
- Bathrooms: 2 full bathrooms; 1 main-level bathroom
- Heating & cooling: Forced air heating; Gas heating
- Interior features: Unfinished basement
Neighborhood map
What this means for you Summary
Snapshot
- This is a 3-bed/2.0-bath single-family listed at $30k.
Deal economics
- At list price, monthly cash flow is $708 ($8k/yr) — positive.
- The deal already cash-flows at list — no discount required.
- Meets the 1% rule at list price ($1k rent vs $30k).
- Recommended offer: $29k (1.5% below list) — sets the bar for market timing.
- Cap rate 34.7% vs local median 5.2% in Steubenville — top-decile yield for the area; either an underpriced asset or a hidden risk that comps aren't pricing in. Stress-test before assuming the spread holds.
Location & tenants
- Location reads 76/100 on livability (#214 in OH, #3,318 nationally) — a middle-class / working-renter tenant base. Strengths: schools A+, commute A+, cost of living A+; Watch: amenities F, employment F.
- Steubenville City (urban): math 74% / reading 71% proficiency, ranked #150 of 656 in OH (top 23%) — strong family-tenant draw, lease renewals of 3-5y typical.
- Market conditions: 98 active listings in the ZIP; 1 comparable units currently listed for rent nearby; 2 units permitted in Jefferson County in 2024 (0 in 5+ unit buildings).
Forward outlook
- Local home prices are declining (-3.0%/yr); year-one equity from $207 of loan paydown is wiped out by about $897 of value loss. Plan a longer hold.
- Jefferson County population projected at -19% by 2050 — secular population decline; favor cash flow + early exit over multi-decade hold.
- At projected returns (-3.0% appreciation + 3.0% rent growth), your $8k cash investment doubles in ~2 years — after that, you're playing with house money.
Negotiation context
- It's been on market 18 days — a 2% lower offer ($29k) is reasonable based on typical stale-listing flexibility.
- 6 sale attempts since 4y ago with the ask held roughly flat each time — persistent listings suggest the price (not the market) is what's stuck; bring a comps-based counter.
- Current owner paid $21k; 42% above their basis — modest negotiation headroom, anchor on the comps not their cost.
Questions for the listing agent
- Is there a deadline driving the sale (1031 exchange, divorce, estate, relocation)? That informs how much negotiation room exists.
- Schools are A-rated — typically a magnet for longer-tenancy family renters. What's the average tenant stay here, and is there a school-zone premium baked into asking?
- What's the average days-on-market for RENTAL listings here right now (not sales)? A rising rental-DOM trend means longer vacancies and softer asking-rent achievability than the comps imply.
- What's the recent tenant-quality profile in this submarket — average credit score on applications, eviction rate, late-payment / NSF rate, and stable-employment percentage? A property-management company in the area should have these aggregated.
- How much new for-sale + rental construction is in the pipeline within 1–3 miles? Heavy new supply typically softens prices + rents 12–24 months out; constrained supply supports both.
Investment metrics
- 1% rule
- 3.85% ✓
- Cap rate
- 34.72%
- Cash-on-cash
- 101.53%
- DSCR
- 5.52
- GRM
- 2.2
CMA / ARV
- ARV (on-the-fly)
- $131,384
- Comps found
- 12
Show comp detail 12 sales within ~0.75 mi
| Address | Dist | Beds/Ba | Sqft | Sold | Price | $/sf | Match |
|---|---|---|---|---|---|---|---|
| 1312 Wellesley Ave | 0.36mi | 3/2.0 | 1,470 (-2%) | 5mo | $31,000 | $21 | 77 |
| 1318 Pennsylvania Ave | 0.26mi | 3/1.0 | 1,512 (+1%) | 10mo | $10,000 | $7 | 73 |
| 1810 Mary Ave | 0.31mi | 3/1.0 | 1,538 (+3%) | 7mo | $136,000 | $88 | 71 |
| 1855 Plum St | 0.31mi | 4/2.0 (+1) | 1,468 (-2%) | 9mo | $125,000 | $85 | 70 |
| 305 Murphy Ave | 0.31mi | 3/1.5 | 1,428 (-4%) | 8mo | $130,000 | $91 | 70 |
| 1222 Oregon Ave | 0.37mi | 3/1.0 | 1,424 (-5%) | 3mo | $12,500 | $9 | 69 |
| 1952 Mccauslen Mnr | 0.23mi | 3/2.0 | 1,308 (-12%) | 0mo | $255,000 | $195 | 68 |
| 2012 Fairmont Ave | 0.55mi | 3/1.0 | 1,408 (-6%) | 1mo | $142,500 | $101 | 60 |
| 1219 Oregon Ave | 0.39mi | 3/1.0 | 1,364 (-9%) | 6mo | $120,500 | $88 | 58 |
| 1510 Pennsylvania Ave | 0.20mi | 3/1.0 | 1,281 (-14%) | 8mo | $50,500 | $39 | 56 |
| 1816 Norton Pl | 0.49mi | 3/2.5 | 1,664 (+12%) | 6mo | $287,000 | $172 | 51 |
| 507 Highland Ave | 0.61mi | 2/1.0 (-1) | 1,304 (-13%) | 1mo | $23,000 | $18 | 40 |
Match score weights: distance 35% · size 25% · config 20% · recency 20%. Top-matched comps best support the ARV.
Projected returns pro-forma
-3.0% appreciation · 3.0% rent growth · sell at horizon
- IRR
- —
- Equity multiple
- 5.81×
- Total profit
- $40,282
- Equity at exit
- $4,458
- IRR
- —
- Equity multiple
- 12.13×
- Total profit
- $93,222
- Equity at exit
- $2,585
Cash invested: $8,372 (down + closing). Projections, not guarantees.
Landlord ↔ Tenant lean methodology
- Overall (STATE)
- 73 Landlord-Friendly
- State Ohio
- 73 Landlord-Friendly · R+6
- County
- — inherits STATE
- City
- — inherits STATE
ZIP-level market 43952
- Active inventory
- 98
- Price-to-rent
- 2.2×
Monthly cashflow live
- Estimated rent
- $1,150 medium interval (Pro) →
- Mortgage (P&I)
- −$157
- Tax from tax record
- −$31 /mo · $373/yr
- Insurance
- −$12
- HOA
- −$0
- Vacancy / Maint / Mgmt
- −$242
- Net cashflow
- $708
Break-even live
UW: 25.0% down · 7.5% · 30yr · 1.5% tax · 5.0% vac · 8.0% maint · 8.0% mgmt
Financing live
Cash to close
- Down payment
- $7,475
- Closing costs
- $897
- Reserves months
- —
- Total cash needed
- —
Loan-product check · same deal, 3 products live
Conventional
25% down · 7.5% · 30yr
- Down + closing
- —
- Monthly P&I
- —
- Monthly cashflow
- —
- DSCR
- —
- Eligible?
- —
Personal DTI + credit; lowest rate.
DSCR
20% down · 8.5% · 30yr
- Down + closing
- —
- Monthly P&I
- —
- Monthly cashflow
- —
- DSCR
- —
- Eligible?
- —
No personal income docs; deal must DSCR.
Hard money
10% down · 12.0% · 12mo
- Down + closing
- —
- Monthly P&I
- —
- Monthly cashflow
- —
- DSCR
- —
- Eligible?
- —
Short-term bridge; refi at stabilization.
Rent comps 1 comps
| Address | Beds | Baths | Sqft | Rent | $/sqft | DOM | Units | Dist |
|---|---|---|---|---|---|---|---|---|
| 1646 Ridge Ave Steubenville, OH | 3.0 | 1.0 | 1220 | $700 | $0.57 | 44d | 1 | 0.14mi |
Listing history 14 events
-
2026-06-19days on market $29,900 Active 18 DOM
-
2026-06-18days on market $29,900 Active 17 DOM
-
2026-06-17days on market $29,900 Active 16 DOM
-
2026-06-16days on market $29,900 Active 15 DOM
-
2026-06-15days on market $29,900 Active 14 DOM
-
2026-06-14days on market $29,900 Active 12 DOM
-
2026-06-12days on market $29,900 Active 11 DOM
-
2026-06-09days on market $29,900 Active 8 DOM
-
2026-06-08days on market $29,900 Active 7 DOM
-
2026-06-07days on market $29,900 Active 6 DOM
-
2026-06-05days on market $29,900 Active 4 DOM
-
2026-06-04days on market $29,900 Active 2 DOM
-
2026-06-01remarks 118-char remark
-
2026-06-01$29,900 Active 1 DOM
ⓘ Source: listings_history table (triggers on properties + properties_extension) + one-shot
backfill from property_details.listing_events for pre-trigger history.
Tax reassessment forecast OH · Partial reset (capped growth)
- Current annual tax
- $373 · $31/mo
- Projected year-2 tax
- $420 · $35/mo
- Expected delta
- +$47/yr (+$4/mo · 12.5%)
ⓘ Screening estimate from a state-policy table — verify with the county assessor before closing.
Climate risk First Street
- Flood 1/10 Low FEMA zone X (unshaded) · 0% chance over 30 yrs
- Wildfire 1/10 Low
- Heat 3/10 Moderate 7 d/yr ≥97°F today · 18 d/yr by 30 yrs out
- Wind 1/10 Low
- Air quality 2/10 Low 2 unhealthy d/yr today · 2 by 30 yrs out
Nearby sold comps map
Loading sold comps map…
Walkable amenities ~0.75 mi
Loading nearby amenities…
Taxation est. · year 1
- Rental income
- $13,803
- − Mortgage interest
- −$1,675
- − Property taxes
- −$373
- − Insurance
- −$150
- − Repairs & maintenance
- −$1,104
- − Management
- −$1,104
- − Depreciation
- −$870
- Taxable income
- $8,527
- Est. tax owed @ 24.0%
- −$2,046
- After-tax cash flow
- $6,453/yr
For passive investors: Depreciation is non-cash, so a rental often shows a tax loss while cash-flowing — sheltering income. Rental losses are passive: they offset passive income freely, and up to $25,000/yr can offset ordinary (W-2) income if you actively participate and your MAGI is under $100k (phasing out to $0 by $150k); unused losses carry forward. On sale, claimed depreciation is recaptured at up to 25%, and gains may owe capital-gains tax (a 1031 exchange can defer both). Figures are a year-1 estimate at your 24.0% rate — not tax advice; consult a CPA.
Schools (NCES district)
- District
- Steubenville City
- NCES district ID
- 3904482
- Math proficiency
- 74% ▼ -15.00%
- Reading proficiency
- 71% ▼ -11.00%
- Median HH income
- $29,668
- Composite
- 59.52/100
- National rank
- #920
- State rank
- #150 of 656 in OH
Livability — Steubenville
- Score
- 76/100
- State rank
- #214
- US rank
- #3318
Category grades
Schools grade is shown separately in the Schools card above.
Census & demographics
- Census place
- Steubenville, OH
- County
- Jefferson County · 17,836 people
- City population
- 17,836
- Metro
- Weirton-Steubenville, WV-OH
- Population (ZIP)
- 17,836
- Household income
- $47,624
- Rent vs Own
- Severe rent burden
- 601.0
Population outlook (Jefferson County) Hauer SSP2
- Today (2025)
- 63,481 people
- By 2030
- 61,067 · -3.8%
- By 2040
- 55,860 · -12.0%
- By 2050
- 51,236 · -19.3%
- By 2075
- 41,804 · -34.1%
- By 2100
- 32,344 · -49.0%
Race, ethnicity, and origin ACS 2023
- Neighborhood character
- Predominantly White (76%)
- Race & ethnicity
- White 76% Black 13% Two or more races 6% Hispanic / Latino 4%
- Common ancestry
- Romanian 5% Italian 2% Slovak 2%
- Foreign-born
- 2% · Canada, China
- Languages at home
- 96% English-only · Spanish 2% Other Indo-European 1%
Political lean MEDSL · Jefferson
- 2024 margin
- Solid R (+43.9) · D 27.5% · R 71.4% · Other 1.1%
- 2008→2024 swing
- -44.1pp toward R · 2008: 0.2pp · 2024: -43.9pp
- All cycles
- 2024: R+43.9 2020: R+38.4 2016: R+35.7 2012: R+5.5 2008: D+0.2
Not yet ingested
- Civics
- —
Market trends
- HPI YoY
- ▼ -124.13%
- Current HPI
- 183.5034
- Rent YoY
- —
- Metro
- Weirton-Steubenville, WV-OH
- State GDP YoY
- ▲ 1.98%
- F500 in state
- 48
Industry mix (Fortune 500 HQ in OH)
| Industry | F500 HQs | Revenue |
|---|---|---|
| Insurance | 3 | $145B |
|
||
| Industrial Machinery | 3 | $49B |
|
||
| Financial Services | 3 | $24B |
|
||
| Consumer Goods | 2 | $93B |
|
||
| Aerospace / Defense | 2 | $47B |
|
||
| Utilities | 2 | $33B |
|
||
Price history
+139.2% since first listed21 events — show timeline
- 2026-05-29 Listed $29,900 MLSNOW
- 2025-06-06 Pending — MLSNOW
- 2025-05-28 Sold (MLS) $21,000 MLSNOW
- 2025-05-13 Contingent — MLSNOW
- 2025-04-29 Price Changed $22,500 MLSNOW
- 2025-04-23 Relisted — MLSNOW
- 2025-03-28 Contingent — MLSNOW
- 2025-03-08 Listed $23,000 MLSNOW
- 2024-06-22 Listing Removed — MLSNOW
- 2024-04-02 Contingent — MLSNOW
- 2024-03-07 Price Changed $19,900 MLSNOW
- 2024-02-26 Price Changed $22,000 MLSNOW
- 2024-02-14 Relisted — MLSNOW
- 2024-01-09 Contingent — MLSNOW
- 2023-12-22 Listed $23,000 MLSNOW
- 2023-05-25 Listing Removed — MLSNOW
- 2023-03-31 Price Changed $25,000 MLSNOW
- 2023-02-08 Price Changed $38,500 MLSNOW
- 2022-11-11 Listed $39,000 MLSNOW
- 2021-07-20 Sold (Public Records) $310,000 Public Records
- 1991-01-22 Sold (Public Records) $12,500 Public Records
Property tax history
-1.0%/yrLatest (2025): $373 · +1.5% YoY. Source: county tax records.
Cash-flow waterfall
monthlySold comps — $/sqft
last 12 mo · ≤1 miLoading sold comps…