 Multi-family
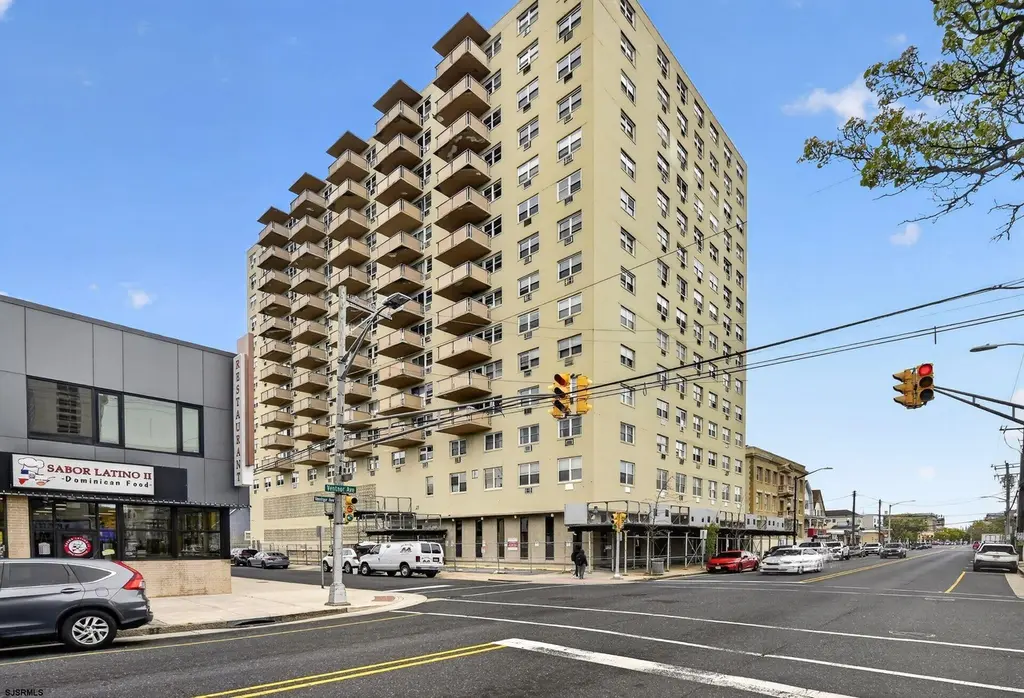
3817 Ventnor Ave · Atlantic City, NJ
Flood risk No data
- FEMA flood zone
- —
- Chance of flooding over 30 yrs
- —
- Est. flood insurance / yr
- —
Fire risk No data
- Est. fire insurance / yr
- —
Heat risk No data
- Hot days now (above threshold)
- —
- Hot days in 30 yrs
- —
Wind risk No data
- Chance of severe wind over 30 yrs
- —
Air-quality risk No data
- Unhealthy air days now
- —
- Unhealthy air days in 30 yrs
- —
Risk factors via First Street. Map © Google.
Why this score? — see what drove the D grade
The composite is a weighted blend of 9 inputs, each scored 0–100. Each bar is that input's sub-score; the figure is the points it added to the 100-point composite (weight × sub-score).
- Cash flow +15.0/30.0
- ARV discount +7.5/15.0
- 1% rule +5.0/10.0
- DSCR +5.0/10.0
- Rent growth +3.9/5.0
- Livability +2.8/5.0
- Condition / age +2.2/5.0
- Schools +1.4/10.0
- Appreciation +0.0/10.0
$149,900
🖨 Deal sheet 📄 Offer letter ✓ Due diligence
Multi-family units
County records classify this as Multi-Family (5+ Unit). Listing-text estimate: 1 unit. estimate disagrees with records
5+ unit building — per-unit beds/baths from public records are typically unavailable; the breakdown below (if shown) is an estimate from the listing text.
Listing remarks MLS
Parking spot available at Landmark Towers. Perfect for current resident or investor looking to rent it out. Located in the Stockton University District. Parking spot is inside the garage.
Key facts
- Steps from the beach
- Garage
- Built 1950
Tags
Property features AI
Finance
- HOA & community: Monthly HOA fee of $922; Adult Community / 55+
Exterior
- Parking: Attached garage (see remarks); Exterior parking (see remarks)
- Utilities: Public water; Public sewer; Electric water heater
- Home design: For sale; Unit 304 (multi-unit building)
- Exterior features: Concrete siding/exterior; Waterfront: No; Lot under 1 acre
Interior
- Flooring: Laminate
- Bathrooms: 2 full bathrooms
- Heating & cooling: Baseboard heating; Hot water heating; Window air conditioning units
- Interior features: Laminate flooring; Laundry/utility room
- Laundry & utility: Laundry/utility room
Neighborhood map
What this means for you Summary
Snapshot
- This is a 2-bed/2.0-bath multifamily listed at $150k. Condition is rated fair.
Deal economics
- At list price, monthly cash flow is $4k ($42k/yr) — positive.
- The deal already cash-flows at list — no discount required.
- Meets the 1% rule at list price ($7k rent vs $150k).
- Recommended offer: $145k (3.0% below list) — sets the bar for market timing.
- Cap rate 34.5% vs local median 3.7% in Atlantic City — top-decile yield for the area; either an underpriced asset or a hidden risk that comps aren't pricing in. Stress-test before assuming the spread holds.
Location & tenants
- Location reads 55/100 on livability (#525 in NJ) — a working-class tenant base; expect higher turnover. Strengths: health & safety A; Watch: commute D, schools F, crime F.
- Atlantic City School District (urban): math 9% / reading 26% proficiency, ranked #454 of 472 in NJ (top 96%) — low school quality limits family demand, transient renter base, plan for 1-2y turnover; 85% free/reduced lunch — lower-income household profile, screen leases tightly.
- Market conditions: Rents rising fast (+5.5%/yr); 482 active listings in the ZIP; 40 comparable units currently listed for rent nearby; rentals at typical pace (median 21d on market — plan ~3-4 weeks tenant-placement turnaround); lower-income renter base — watch delinquency; 672 units permitted in Atlantic County in 2024 (258 in 5+ unit buildings).
- At $6,946/mo this rent would consume 203% of the median local household income ($41k/yr) (locally 3414% of renters already pay >50% of income on rent) — very limited rent-growth headroom before tenants either downsize or default.
Forward outlook
- Local home prices are declining (-3.0%/yr); year-one equity from $1k of loan paydown is wiped out by about $4k of value loss. Plan a longer hold.
- Atlantic County population projected at -12% by 2050 — secular population decline; favor cash flow + early exit over multi-decade hold.
- At projected returns (-3.0% appreciation + 5.5% rent growth), your $42k cash investment doubles in ~2 years — after that, you're playing with house money.
Negotiation context
- It's been on market 31 days — a 3% lower offer ($145k) is reasonable based on typical stale-listing flexibility.
- 9 sale attempts since 5y ago with the ask held roughly flat each time — persistent listings suggest the price (not the market) is what's stuck; bring a comps-based counter.
Risks & watch-outs
- Watch-outs: built in 1950 — expect roof / HVAC / electrical / plumbing capex.
Questions for the listing agent
- It's been on market 31 days. Have you received any prior offers? Is the seller open to a 3% concession, seller financing, or rate buy-down credit?
- Have any recent inspections been done? Can we get a copy of the seller's disclosures and any deferred-maintenance estimates?
- Built in 1950 — when were the roof, HVAC, electrical panel, plumbing, and water heater last replaced?
- What does the HOA fee cover, when was the last increase, and are there any pending special assessments or reserve-fund shortfalls?
- Is there a deadline driving the sale (1031 exchange, divorce, estate, relocation)? That informs how much negotiation room exists.
- Schools are F-rated, which usually means shorter tenancies and higher turnover. Who's the typical renter profile here, and what's been the actual vacancy rate?
- Crime grade is F in this area — have there been break-ins, vandalism, or insurance claims at this property in the last 3 years? What carrier currently insures it and at what premium?
- The area grade is low — what's the realistic commute time and amenity access for the typical tenant pool here? Any planned neighborhood developments (good or bad) we should know about?
- What's the average days-on-market for RENTAL listings here right now (not sales)? A rising rental-DOM trend means longer vacancies and softer asking-rent achievability than the comps imply.
- What's the recent tenant-quality profile in this submarket — average credit score on applications, eviction rate, late-payment / NSF rate, and stable-employment percentage? A property-management company in the area should have these aggregated.
- How much new apartment / multifamily construction is in the pipeline within 1–3 miles? Heavy new supply (>2% of stock underway) typically softens rents 12–24 months out; light construction supports rent growth.
Investment metrics
- 1% rule
- 4.63% ✓
- Cap rate
- 34.55%
- Cash-on-cash
- 100.91%
- DSCR
- 5.49
- GRM
- 1.8
CMA / ARV
No comps found within radius.
Show comp detail 4 sales within ~0.75 mi
| Address | Dist | Beds/Ba | Sqft | Sold | Price | $/sf | Match |
|---|---|---|---|---|---|---|---|
| 1 N Parker Ave | 0.10mi | 2/2.0 | — | 2mo | $295,000 | — | 81 |
| 213 N Montpelier Ave | 0.51mi | 2/2.0 | 2,100 | 13mo | $295,000 | $140 | 53 |
| 24 N Montpelier Ave | 0.42mi | 3/— (+1) | 3,450 | 21mo | $425,000 | $123 | 46 |
| 3536 Pacific Ave | 0.26mi | 3/6.0 (+1) | 7,055 | 15mo | $1,435,000 | $203 | 43 |
Match score weights: distance 35% · size 25% · config 20% · recency 20%. Top-matched comps best support the ARV.
Projected returns pro-forma
-3.0% appreciation · 5.52% rent growth · sell at horizon
- IRR
- —
- Equity multiple
- 6.22×
- Total profit
- $219,226
- Equity at exit
- $22,351
- IRR
- —
- Equity multiple
- 14.37×
- Total profit
- $561,095
- Equity at exit
- $12,961
Cash invested: $41,972 (down + closing). Projections, not guarantees.
Landlord ↔ Tenant lean methodology
- Overall (STATE)
- 21 Tenant-Leaning
- State New Jersey
- 21 Tenant-Leaning · D+6
- County
- — inherits STATE
- City
- — inherits STATE
ZIP-level market 08401
- Home prices YoY
- -7.0%
- Rents YoY
- 5.5%
- Active inventory
- 482
- Price-to-rent
- 3.6×
Monthly cashflow live
- Estimated rent
- $6,946 high interval (Pro) →
- Mortgage (P&I)
- −$786
- Tax est. 1.5%
- −$187 /mo · $2,248/yr
- Insurance
- −$62
- HOA
- −$922
- Vacancy / Maint / Mgmt
- −$1,459
- Net cashflow
- $3,529
Break-even live
2-unit breakdown (identical units grouped — click to expand)
| Units | Beds | Baths | Est. rent |
|---|---|---|---|
| 2× units | 2 | 2 | $6,946 |
| #1 | 2 | 2 | $3,473 |
| #2 | 2 | 2 | $3,473 |
| Total (2 units) | $6,946 | ||
UW: 25.0% down · 7.5% · 30yr · 1.5% tax · 5.0% vac · 8.0% maint · 8.0% mgmt
Financing live
Cash to close
- Down payment
- $37,475
- Closing costs
- $4,497
- Reserves months
- —
- Total cash needed
- —
Loan-product check · same deal, 3 products live
Conventional
25% down · 7.5% · 30yr
- Down + closing
- —
- Monthly P&I
- —
- Monthly cashflow
- —
- DSCR
- —
- Eligible?
- —
Personal DTI + credit; lowest rate.
DSCR
20% down · 8.5% · 30yr
- Down + closing
- —
- Monthly P&I
- —
- Monthly cashflow
- —
- DSCR
- —
- Eligible?
- —
No personal income docs; deal must DSCR.
Hard money
10% down · 12.0% · 12mo
- Down + closing
- —
- Monthly P&I
- —
- Monthly cashflow
- —
- DSCR
- —
- Eligible?
- —
Short-term bridge; refi at stabilization.
Rent comps 40 comps
| Address | Beds | Baths | Sqft | Rent | $/sqft | DOM | Units | Dist |
|---|---|---|---|---|---|---|---|---|
| 3809 Ventnor Ave #6 Atlantic City, NJ | 3.0 | 1.0 | 1500 | $2,100 | $1.40 | 21d | 1 | 0.02mi |
| 3817 Ventnor Ave #1001 Atlantic City, NJ | 2.0 | 1.0 | — | $1,900 | — | 13d | 1 | 0.03mi |
| 3812 Ventnor Ave Unit 3 Atlantic City, NJ | 3.0 | 1.0 | — | $2,100 | — | 21d | 1 | 0.05mi |
| 3939 Ventnor Ave Unit A7 Atlantic City, NJ | 2.0 | 1.0 | — | $1,800 | — | 21d | 1 | 0.08mi |
| 2 Elberon Ave Unit 1 Atlantic City, NJ | 2.0 | 1.0 | — | $1,400 | — | 21d | 1 | 0.08mi |
| 3917 Winchester Ave Atlantic City, NJ | 3.0 | 1.5 | — | $2,500 | — | 21d | 1 | 0.11mi |
| 3813 Atlantic Ave Unit 1309001P Atlantic City, NJ | 1.0 | 2.0 | 592 | $4,333 | $7.32 | 13d | 1 | 0.13mi |
| 3829 Atlantic Ave Unit 10 Atlantic City, NJ | 1.0 | 1.0 | — | $3,500 | — | 21d | 1 | 0.13mi |
| 36 S Dover Ave Unit B Atlantic City, NJ | 2.0 | 1.0 | — | $1,600 | — | 21d | 1 | 0.13mi |
| 36 Chelsea Ct Atlantic City, NJ | 3.0 | 2.5 | 2100 | $3,300 | $1.57 | 13d | 1 | 0.14mi |
| 3636 Winchester Ave Atlantic City, NJ | 3.0 | 1.0 | 1094 | $1,995 | $1.82 | 21d | 1 | 0.14mi |
| 3625 Winchester Ave Unit 3 Atlantic City, NJ | 3.0 | 1.0 | — | $2,100 | — | 21d | 1 | 0.16mi |
| 19 S Windsor Ave Unit B4 Atlantic City, NJ | 1.0 | 1.0 | — | $6,000 | — | 21d | 1 | 0.18mi |
| 21 S Windsor Ave Unit b1 Atlantic City, NJ | 2.0 | 1.0 | 640 | $1,650 | $2.58 | 13d | 1 | 0.18mi |
| 108 Lincoln Pl Apt A4 Atlantic City, NJ | 2.0 | 1.0 | 800 | $5,000 | $6.25 | 21d | 1 | 0.19mi |
| 108 Lincoln Pl Apt B1 Atlantic City, NJ | 3.0 | 1.0 | — | $6,000 | — | 21d | 1 | 0.19mi |
| 3816 South Blvd Atlantic City, NJ | 2.0 | 1.0 | — | $2,500 | — | 21d | 1 | 0.20mi |
| 3914 South Blvd Atlantic City, NJ | 2.0 | 2.5 | 1700 | $3,400 | $2.00 | 21d | 1 | 0.20mi |
| 119 Saint Davids Pl Atlantic City, NJ | 1.0 | 1.0 | — | $12,000 | — | 21d | 1 | 0.20mi |
| 3851 Boardwalk Atlantic City, NJ | 2.0 | 1.0–2.0 | 785 | $27,500 | $35.03 | 21d | 5 | 0.22mi |
| 21 N Laclede Pl Atlantic City, NJ | 3.0 | 1.0 | 1200 | $2,000 | $1.67 | 21d | 1 | 0.23mi |
| 38 N Boston Ave Unit B Atlantic City, NJ | 2.0 | 2.0 | 800 | $2,400 | $3.00 | 13d | 1 | 0.30mi |
| 101 S Raleigh Ave Atlantic City, NJ | 2.0 | 1.0 | 735 | $18,750 | $25.51 | 13d | 7 | 0.33mi |
| 115 N Delancy Pl Apt B Atlantic City, NJ | 3.0 | 2.0 | — | $2,000 | — | 21d | 1 | 0.34mi |
| 121 N Kingston Ave Unit 2 Atlantic City, NJ | 3.0 | 1.5 | — | $2,950 | — | 13d | 1 | 0.43mi |
| 100 N Chelsea Ave Unit 1 Atlantic City, NJ | 3.0 | 1.0 | 1200 | $15,000 | $12.50 | 21d | 1 | 0.47mi |
| 512 N Harrisburg Ave Atlantic City, NJ | 3.0 | 2.0 | 1156 | $2,800 | $2.42 | 13d | 1 | 0.48mi |
| 3101 Boardwalk Unit 2115/ 2111-2 Atlantic City, NJ | 2.0 | 3.0 | — | $28,000 | — | 21d | 1 | 0.48mi |
| 3101 Boardwalk Unit 1210-2 Atlantic City, NJ | 1.0 | 1.5 | — | $2,000 | — | 21d | 1 | 0.48mi |
| 3101 Boardwalk Unit 2704-1 Atlantic City, NJ | 1.0 | 2.0 | — | $18,000 | — | 13d | 1 | 0.48mi |
| 3101 Boardwalk Unit 811-2 Atlantic City, NJ | 1.0 | 1.5 | — | $10,000 | — | 21d | 1 | 0.51mi |
| 3101 Boardwalk Unit 1110-2 Atlantic City, NJ | 1.0 | 1.5 | 872 | $14,500 | $16.63 | 21d | 1 | 0.51mi |
| 3101 Boardwalk Unit 3103-2 Atlantic City, NJ | 2.0 | 2.0 | — | $22,500 | — | 21d | 1 | 0.51mi |
| 100 S Berkley Sq Unit 4H Atlantic City, NJ | 2.0 | 2.0 | 1520 | $3,200 | $2.11 | 21d | 1 | 0.51mi |
| 101 S Plaza Pl #1012 Atlantic City, NJ | 1.0 | 1.0 | — | $2,500 | — | 21d | 1 | 0.53mi |
| 34 N Montgomery Ave Atlantic City, NJ | 2.0 | 2.0 | — | $22,000 | — | 13d | 1 | 0.57mi |
| 107 N Brighton Ave Atlantic City, NJ | 3.0 | 1.0 | — | $2,400 | — | 13d | 1 | 0.61mi |
| 2834 Atlantic Ave Atlantic City, NJ | 1.0 | 1.0 | 639 | $1,675 | $2.62 | 21d | 3 | 0.61mi |
| 2834 Atlantic Ave Atlantic City, NJ | 1.0 | 1.0 | 823 | $1,688 | $2.05 | 13d | 3 | 0.61mi |
| 4800 Ventnor Ave #1 Ventnor City, NJ | 3.0 | 2.0 | — | $2,550 | — | 21d | 1 | 0.63mi |
HOA detail
- Monthly dues
- $922 · $11,064/yr
Listing history 24 events
-
2026-06-01days on market $149,900 Active 31 DOM
-
2026-05-31days on market $149,900 Active 30 DOM
-
2026-05-30days on market $149,900 Active 29 DOM
-
2026-04-30$149,900 Active 1348-char remark
-
2026-01-08historical 187-char remark
Show marketing remark (187 chars)
Parking spot available at Landmark Towers. Perfect for current resident or investor looking to rent it out. Located in the Stockton University District. Parking spot is inside the garage.
-
2025-07-07$8,900 Active 187-char remark
Show marketing remark (187 chars)
Parking spot available at Landmark Towers. Perfect for current resident or investor looking to rent it out. Located in the Stockton University District. Parking spot is inside the garage.
-
2025-05-02historical $1,900
-
2025-04-01$1,900
-
2025-04-01price $1,900
-
2024-10-17historical $1,950
-
2024-10-14$1,950
-
2024-06-12historical $3,000
-
2024-06-11price $3,000
-
2024-06-07$1,995
-
2024-06-07historical $1,995
-
2024-05-05$1,995
-
2024-01-05soldstatus $155,000 Sold
Show marketing remark (203 chars)
Call Allison Vitella 917-860-45888 for Showings Location location location. Live one block from the beach and boardwalk. 2 bed/2 bath condo with open concept kitchen/living room. Balcony with Ocean View.
-
2023-11-27historical Under Contract
Show marketing remark (203 chars)
Call Allison Vitella 917-860-45888 for Showings Location location location. Live one block from the beach and boardwalk. 2 bed/2 bath condo with open concept kitchen/living room. Balcony with Ocean View.
-
2023-03-06$155,000 Active
Show marketing remark (203 chars)
Call Allison Vitella 917-860-45888 for Showings Location location location. Live one block from the beach and boardwalk. 2 bed/2 bath condo with open concept kitchen/living room. Balcony with Ocean View.
-
2021-06-29soldstatus $87,000 Sold
-
2021-06-16historical Under Contract
-
2021-05-24status Active
-
2021-04-09historical Under Contract
-
2021-01-08$95,000 Active
ⓘ Source: listings_history table (triggers on properties + properties_extension) + one-shot
backfill from property_details.listing_events for pre-trigger history.
Nearby sold comps map
Loading sold comps map…
Walkable amenities ~0.75 mi
Loading nearby amenities…
Taxation est. · year 1
- Rental income
- $83,352
- − Mortgage interest
- −$8,397
- − Property taxes
- −$2,248
- − Insurance
- −$750
- − Repairs & maintenance
- −$6,668
- − Management
- −$6,668
- − HOA
- −$11,064
- − Depreciation
- −$4,361
- Taxable income
- $43,196
- Est. tax owed @ 24.0%
- −$10,367
- After-tax cash flow
- $31,986/yr
For passive investors: Depreciation is non-cash, so a rental often shows a tax loss while cash-flowing — sheltering income. Rental losses are passive: they offset passive income freely, and up to $25,000/yr can offset ordinary (W-2) income if you actively participate and your MAGI is under $100k (phasing out to $0 by $150k); unused losses carry forward. On sale, claimed depreciation is recaptured at up to 25%, and gains may owe capital-gains tax (a 1031 exchange can defer both). Figures are a year-1 estimate at your 24.0% rate — not tax advice; consult a CPA.
Condition & rehab AI · 12 photos
This 2-bedroom, 2-bathroom apartment in a multi-family building requires moderate repairs and maintenance to improve its condition and value.
Repairs flagged
- Minor Kitchen cabinets — Slight wear
- Minor Kitchen appliances — Red refrigerator
Value-add opportunities
- Resale Paint interior walls — Fresh paint enhances curb appeal
- Resale Replace kitchen appliances — Modern appliances improve functionality
- Both Landscaping — Landscaping enhances curb appeal and adds value
Renovation cost estimate screening
| Repair item | Severity | Est. cost |
|---|---|---|
| Kitchen cabinets · Slight wear | Minor | $500–3,000 |
| Kitchen appliances · Red refrigerator | Minor | $500–3,000 |
| Total estimated repair cost · 2 items | $1,000–6,000 |
Value-add ROI direction
- Resale Paint interior walls — Fresh paint enhances curb appeal ↑
- Resale Replace kitchen appliances — Modern appliances improve functionality ↑
- Both Landscaping — Landscaping enhances curb appeal and adds value ↑
ⓘ Cost ranges are severity-bucket heuristics (US national rule-of-thumb). Get contractor quotes + a written scope before underwriting a rehab budget.
Schools (NCES district)
- District
- Atlantic City School District
- NCES district ID
- 3400960
- Math proficiency
- 9% ▼ -12.00%
- Reading proficiency
- 26% ▼ -6.00%
- Median HH income
- $27,842
- Composite
- 13.66/100
- National rank
- #9504
- State rank
- #454 of 472 in NJ
Livability — Atlantic City
- Score
- 55/100
- State rank
- #525
- US rank
- #23095
Category grades
Schools grade is shown separately in the Schools card above.
Census & demographics
- Census place
- Atlantic City, NJ
- County
- Atlantic County · 143,611 people
- City population
- 38,925
- Metro
- Atlantic City-Hammonton, NJ
- Population (ZIP)
- 38,925
- Household income
- $41,126
- Rent vs Own
- Severe rent burden
- 3414.0
Population outlook (Atlantic County) Hauer SSP2
- Today (2025)
- 268,948 people
- By 2030
- 264,497 · -1.7%
- By 2040
- 252,261 · -6.2%
- By 2050
- 237,846 · -11.6%
- By 2075
- 210,650 · -21.7%
- By 2100
- 180,234 · -33.0%
Race, ethnicity, and origin ACS 2023
- Neighborhood character
- Highly diverse neighborhood (Simpson 0.75)
- Race & ethnicity
- Hispanic / Latino 32% Black 32% Asian 16% White 16% Two or more races 11% Native American 2%
- Hispanic origin (detail)
- Mexican 10% Puerto Rican 8% Dominican 8%
- Common ancestry
- Romanian 1% Scotch-Irish 1%
- Foreign-born
- 29% · Canada, Vietnam, Jamaica
- Languages at home
- 52% English-only · Spanish 30% Other Indo-European 8% Vietnamese 3%
Political lean MEDSL · Atlantic
- 2024 margin
- Toss-up / Even · D 47.7% · R 50.7% · Other 1.6%
- 2008→2024 swing
- -18.1pp toward R · 2008: 15.1pp · 2024: -3.0pp
- All cycles
- 2024: R+3.0 2020: D+6.7 2016: D+6.2 2012: D+17.2 2008: D+15.1
Not yet ingested
- Civics
- —
Market trends
- HPI YoY
- ▼ -26.82%
- Current HPI
- 353.7827
- Rent YoY
- ▲ 5.52%
- Metro
- Atlantic City-Hammonton, NJ
- State GDP YoY
- ▲ 2.05%
- F500 in state
- 34
Industry mix (Fortune 500 HQ in NJ)
| Industry | F500 HQs | Revenue |
|---|---|---|
| Consumer Goods | 3 | $31B |
|
||
| Pharmaceuticals | 2 | $153B |
|
||
| Technology | 2 | $21B |
|
||
| Insurance | 2 | $20B |
|
||
| Healthcare | 2 | $19B |
|
||
| Financial Services | 1 | $70B |
|
||
Price history
+57.8% since first listed22 events — show timeline
- 2026-06-01 Listing Removed — SJSRMLS
- 2026-04-30 Listed $149,900 SJSRMLS
- 2026-01-08 Listing Removed — SJSRMLS
- 2025-07-07 Listed $8,900 SJSRMLS
- 2025-05-02 Rental Removed $1,900 TURBOTENANT
- 2025-04-01 Listed for Rent $1,900 TURBOTENANT
- 2025-04-01 Price Changed $1,900 TURBOTENANT
- 2024-10-17 Rental Removed $1,950 RENTALBEAST
- 2024-10-14 Listed for Rent $1,950 RENTALBEAST
- 2024-06-12 Rental Removed $3,000 SJSRMLS
- 2024-06-11 Price Changed $3,000 SJSRMLS
- 2024-06-07 Listed for Rent $1,995 SJSRMLS
- 2024-06-07 Rental Removed $1,995 SJSRMLS
- 2024-05-05 Listed for Rent $1,995 SJSRMLS
- 2024-01-05 Sold (MLS) $155,000 NJMLS
- 2023-11-27 Contingent — NJMLS
- 2023-03-06 Listed $155,000 NJMLS
- 2021-06-29 Sold (MLS) $87,000 NJMLS
- 2021-06-16 Contingent — NJMLS
- 2021-05-24 Relisted — NJMLS
- 2021-04-09 Contingent — NJMLS
- 2021-01-08 Listed $95,000 NJMLS
Cash-flow waterfall
monthlySold comps — $/sqft
last 12 mo · ≤1 miLoading sold comps…