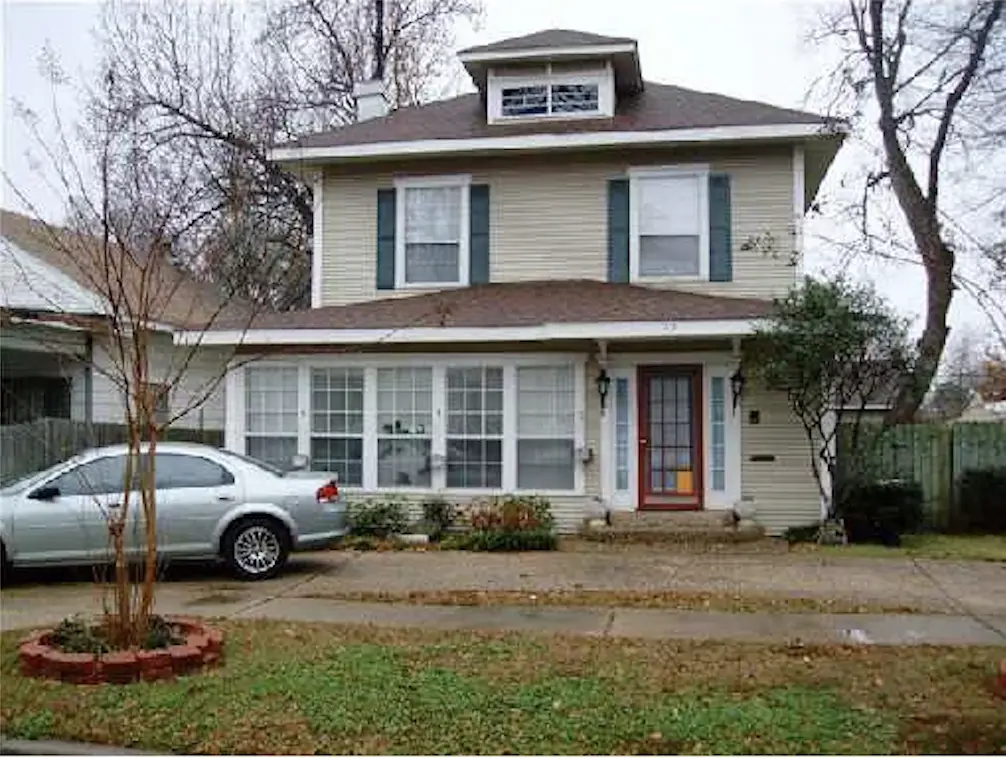
1113 Dalzell St · Shreveport, LA
Flood risk 1/10 · Minimal
- FEMA flood zone
- X (unshaded)
- Chance of flooding over 30 yrs
- 0.0%
- Est. flood insurance / yr
- $507 – $1,088
Fire risk 1/10 · Minimal
- Est. fire insurance / yr
- $1,269 – $2,357
Heat risk 7/10 · Major
- Hot days now (above 110°F)
- 7 days/yr
- Hot days in 30 yrs
- 22 days/yr
Wind risk 6/10 · Moderate
- Chance of severe wind over 30 yrs
- 66.0%
Air-quality risk 2/10 · Minimal
- Unhealthy air days now
- 1 days/yr
- Unhealthy air days in 30 yrs
- 1 days/yr
Risk factors via First Street. Map © Google.
Why this score? — see what drove the F grade
The composite is a weighted blend of 9 inputs, each scored 0–100. Each bar is that input's sub-score; the figure is the points it added to the 100-point composite (weight × sub-score).
- Cash flow +7.4/30.0
- Rent growth +3.4/5.0
- Livability +3.0/5.0
- Condition / age +2.5/5.0
- Schools +2.2/10.0
- 1% rule +1.6/10.0
- DSCR +1.6/10.0
- ARV discount +0.0/15.0
- Appreciation +0.0/10.0
$195,500
🖨 Deal sheet (PDF) 📄 Offer letter ✓ Due diligence
Listing remarks
This 2955 square foot single family home has 4 bedrooms and 2.5 bathrooms.
Key facts
- Built 2010
- Listed 58 days
Property features AI
Exterior
- Home design: Built in 2010
Interior
- Kitchen: Island; Refrigerator
- Interior features: Fireplace; Sunroom; Porch
Neighborhood map
What this means for you Summary
Snapshot
- This is a 4-bed/2.0-bath single-family listed at $196k.
Deal economics
- At list price, monthly cash flow is $-250 ($-3k/yr) — negative.
- To cash-flow at today's rent, offer at most $151k (22.6% below list).
- To meet the 1% rule (rent ≥ 1% of price), the offer needs to be $130k (33.5% below list).
- Recommended offer: $130k (33.5% below list) — sets the bar for 1% rule.
Location & tenants
- Location reads 59/100 on livability (#270 in LA) — a working-class tenant base; expect higher turnover. Strengths: cost of living A+, housing A; Watch: crime F, amenities F, commute F.
- Caddo Parish (urban): math 21% / reading 32% proficiency, ranked #53 of 98 in LA (top 54%) — low school quality limits family demand, transient renter base, plan for 1-2y turnover; 64% free/reduced lunch — lower-income household profile, screen leases tightly.
- Zoned schools: Caddo Parish Middle Magnet School (math 79% / reading 93%, grade A+, #1 of 218 statewide, top 0%, 1,003 students, 23% FRL); C.E. Byrd High School (math 44% / reading 55%, grade D, #37 of 265 statewide, top 14%, 1,526 students, 43% FRL) — zoned schools average 33% FRL vs 64% district-wide (31 pts lower); this property's tenant base skews higher-income than the district average.
- Zoned-school proficiency averages 68% at this address vs 26% district-wide (+41 pts) — the actual schools serving this property are materially stronger than the Caddo Parish average implies; a family-tenant draw the district grade alone would hide.
- Market conditions: Rents rising (+3.6%/yr); 147 active listings in the ZIP; 12 comparable units currently listed for rent nearby; rentals at typical pace (median 23d on market — plan ~3-4 weeks tenant-placement turnaround); 42% of comp listings sitting > 30 days — soft ceiling on asking rent; 221 units permitted in Caddo Parish in 2024 (0 in 5+ unit buildings).
Forward outlook
- Local home prices are declining (-3.0%/yr); year-one equity from $1k of loan paydown is wiped out by about $6k of value loss. Plan a longer hold.
- Caddo County population projected at -15% by 2050 — secular population decline; favor cash flow + early exit over multi-decade hold.
Negotiation context
- It's been on market 58 days — a 3% lower offer ($190k) is reasonable based on typical stale-listing flexibility.
Risks & watch-outs
- Climate carrying-cost: major wind risk, 66% chance of damaging wind over 30y; extreme-heat days projected 7→22/yr by 2055 (HVAC capex compounding) — expect insurance premiums to compound above CPI over the hold.
Questions for the listing agent
- What do current leases actually rent for vs. the listed asking? Can we see a recent rent roll and the last 12 months of T-12 income?
- It's been on market 58 days. Have you received any prior offers? Is the seller open to a 34% concession, seller financing, or rate buy-down credit?
- Is there a deadline driving the sale (1031 exchange, divorce, estate, relocation)? That informs how much negotiation room exists.
- Schools are D-rated, which usually means shorter tenancies and higher turnover. Who's the typical renter profile here, and what's been the actual vacancy rate?
- Crime grade is F in this area — have there been break-ins, vandalism, or insurance claims at this property in the last 3 years? What carrier currently insures it and at what premium?
- The area grade is low — what's the realistic commute time and amenity access for the typical tenant pool here? Any planned neighborhood developments (good or bad) we should know about?
- What's the average days-on-market for RENTAL listings here right now (not sales)? A rising rental-DOM trend means longer vacancies and softer asking-rent achievability than the comps imply.
- What's the recent tenant-quality profile in this submarket — average credit score on applications, eviction rate, late-payment / NSF rate, and stable-employment percentage? A property-management company in the area should have these aggregated.
- How much new for-sale + rental construction is in the pipeline within 1–3 miles? Heavy new supply typically softens prices + rents 12–24 months out; constrained supply supports both.
Investment metrics
- 1% rule
- 0.66% ✗
- Cap rate
- 4.76%
- Cash-on-cash
- -5.48%
- DSCR
- 0.76
- GRM
- 12.5
CMA / ARV
- ARV (on-the-fly)
- $160,740
- Comps found
- 11
Show comp detail 11 sales within ~0.75 mi
| Address | Dist | Beds/Ba | Sqft | Sold | Price | $/sf | Match |
|---|---|---|---|---|---|---|---|
| 1111 Prospect St | 0.11mi | 4/2.5 | 1,876 (-11%) | 4mo | $150,000 | $80 | 71 |
| 927 Boulevard St | 0.27mi | 4/2.0 | 2,332 (+10%) | 1mo | $179,900 | $77 | 69 |
| 742 Columbia St | 0.60mi | 5/2.0 (+1) | 2,060 (-3%) | 1mo | $114,900 | $56 | 62 |
| 728 Rutherford St | 0.68mi | 4/2.0 | 1,957 (-8%) | 7mo | $149,000 | $76 | 50 |
| 2324 Scovell Ct | 0.63mi | 3/1.0 (-1) | 2,032 (-4%) | 12mo | $17,500 | $9 | 45 |
| 3120 Thornhill Ave | 0.66mi | 3/2.5 (-1) | 2,015 (-5%) | 14mo | $260,000 | $129 | 43 |
| 852 Dalzell St | 0.35mi | 3/2.0 (-1) | 2,360 (+12%) | 20mo | $195,000 | $83 | 43 |
| 2418 Pinehurst Blvd | 0.75mi | 3/2.0 (-1) | 1,885 (-11%) | 15mo | $13,000 | $7 | 30 |
| 648 Wichita | 0.73mi | 3/2.0 (-1) | 1,809 (-14%) | 13mo | $74,900 | $41 | 26 |
| 2530 Creswell Ave | 0.70mi | 3/3.5 (-1) | 2,400 (+14%) | 13mo | $69,900 | $29 | 23 |
| 553 Prospect St | 0.73mi | 3/2.0 (-1) | 1,801 (-15%) | 20mo | $150,000 | $83 | 20 |
Match score weights: distance 35% · size 25% · config 20% · recency 20%. Top-matched comps best support the ARV.
Projected returns pro-forma
-3.0% appreciation · 3.56% rent growth · sell at horizon
- IRR
- -25.1%
- Equity multiple
- 0.14×
- Total profit
- $-46,904
- Equity at exit
- $29,150
- IRR
- -19.7%
- Equity multiple
- -0.07×
- Total profit
- $-58,413
- Equity at exit
- $16,903
Cash invested: $54,740 (down + closing). Projections, not guarantees.
Landlord ↔ Tenant lean methodology
- Overall (STATE)
- 90 Strongly Landlord-Friendly
- State Louisiana
- 90 Strongly Landlord-Friendly · R+12
- County
- — inherits STATE
- City
- — inherits STATE
ZIP-level market 71104
- Home prices YoY
- -32.2%
- Rents YoY
- 3.6%
- Active inventory
- 147
- Price-to-rent
- 12.5×
Monthly cashflow live
- Estimated rent
- $1,299 high interval (Pro) →
- Mortgage (P&I)
- −$1,025
- Tax from tax record
- −$170 /mo · $2,041/yr
- Insurance
- −$81
- HOA
- −$0
- Vacancy / Maint / Mgmt
- −$273
- Net cashflow
- $-250
Break-even live
Sensitivity live
| Price | -10% $-140 | -5% $-195 | +0% $-250 | +5% $-306 | +10% $-361 |
|---|---|---|---|---|---|
| Rent | -10% $-353 | -5% $-302 | +0% $-250 | +5% $-199 | +10% $-148 |
| Rate | -1.0pp $-152 | -0.5pp $-200 | base $-250 | +0.5pp $-301 | +1.0pp $-352 |
UW: 25.0% down · 7.5% · 30yr · 1.5% tax · 5.0% vac · 8.0% maint · 8.0% mgmt
Financing live
Cash to close
- Down payment
- $48,875
- Closing costs
- $5,865
- Reserves months
- —
- Total cash needed
- —
Loan-product check · same deal, 3 products live
Conventional
25% down · 7.5% · 30yr
- Down + closing
- —
- Monthly P&I
- —
- Monthly cashflow
- —
- DSCR
- —
- Eligible?
- —
Personal DTI + credit; lowest rate.
DSCR
20% down · 8.5% · 30yr
- Down + closing
- —
- Monthly P&I
- —
- Monthly cashflow
- —
- DSCR
- —
- Eligible?
- —
No personal income docs; deal must DSCR.
Hard money
10% down · 12.0% · 12mo
- Down + closing
- —
- Monthly P&I
- —
- Monthly cashflow
- —
- DSCR
- —
- Eligible?
- —
Short-term bridge; refi at stabilization.
Rent comps 12 comps
| Address | Beds | Baths | Sqft | Rent | $/sqft | DOM | Units | Dist |
|---|---|---|---|---|---|---|---|---|
| 2811 Samford Ave Shreveport, LA | 3.0 | 1.0 | 1612 | $850 | $0.53 | 15d | 1 | 0.32mi |
| 642 Robinson Pl Shreveport, LA | 3.0 | 1.0 | 1500 | $1,275 | $0.85 | 22d | 1 | 0.65mi |
| 2109 Highland Ave Shreveport, LA | 3.0 | 1.0 | 1739 | $1,050 | $0.60 | 45d | 1 | 0.87mi |
| 442 Merrick St Shreveport, LA | 3.0 | 1.5 | 1595 | $1,000 | $0.63 | 45d | 1 | 0.90mi |
| 419 Boulevard St Shreveport, LA | 3.0 | 2.0 | 1852 | $1,100 | $0.59 | 45d | 1 | 0.93mi |
| 320 Stephenson St Shreveport, LA | 3.0 | 2.0 | 1845 | $1,675 | $0.91 | 22d | 1 | 1.26mi |
| 320 Stephenson St Shreveport, LA | 3.0 | 2.0 | 1845 | $1,675 | $0.91 | 15d | 1 | 1.26mi |
| 2401 Darien St Shreveport, LA | 3.0 | 2.0 | 2000 | $1,500 | $0.75 | 15d | 1 | 1.28mi |
| 3827 Baltimore Ave Shreveport, LA | 3.0 | 2.5 | 1650 | $1,650 | $1.00 | 45d | 1 | 1.30mi |
| 222 Stephenson St Shreveport, LA | 3.0 | 2.5 | 2642 | $2,000 | $0.76 | 22d | 1 | 1.34mi |
| 2222 Carleton St Shreveport, LA | 3.0 | 2.0 | 1800 | $750 | $0.42 | 15d | 1 | 1.36mi |
| 3624 Gilbert Dr Shreveport, LA | 3.0 | 3.0 | 2088 | $1,900 | $0.91 | 45d | 1 | 1.36mi |
Listing history 19 events
-
2026-06-21days on market $195,500 Active 58 DOM
-
2026-06-18days on market $195,500 Active 55 DOM
-
2026-06-17days on market $195,500 Active 54 DOM
-
2026-06-16days on market $195,500 Active 53 DOM
-
2026-06-15days on market $195,500 Active 52 DOM
-
2026-06-14days on market $195,500 Active 50 DOM
-
2026-06-13days on market $195,500 Active 49 DOM
-
2026-06-10days on market $195,500 Active 47 DOM
-
2026-06-09days on market $195,500 Active 46 DOM
-
2026-06-08days on market $195,500 Active 45 DOM
-
2026-06-07days on market $195,500 Active 44 DOM
-
2026-06-05days on market $195,500 Active 41 DOM
-
2026-06-03days on market $195,500 Active 40 DOM
-
2026-06-02days on market $195,500 Active 39 DOM
-
2026-06-01days on market $195,500 Active 38 DOM
-
2026-05-31days on market $195,500 Active 37 DOM
-
2026-05-30days on market $195,500 Active 36 DOM
-
2026-04-22$195,500 Active 76-char remark
-
1999-06-02soldstatus
ⓘ Source: listings_history table (triggers on properties + properties_extension) + one-shot
backfill from property_details.listing_events for pre-trigger history.
Tax reassessment forecast LA · Resets to sale price
- Current annual tax
- $2,041 · $170/mo
- Projected year-2 tax
- $2,041 · $170/mo
- Expected delta
- $0/yr ($0/mo · 0.0%)
ⓘ Screening estimate from a state-policy table — verify with the county assessor before closing.
Climate risk First Street
- Flood 1/10 Low FEMA zone X (unshaded) · 0% chance over 30 yrs
- Wildfire 1/10 Low
- Heat 7/10 Severe 7 d/yr ≥110°F today · 22 d/yr by 30 yrs out
- Wind 6/10 Major 66% chance of damaging wind over 30 yrs
- Air quality 2/10 Low 1 unhealthy d/yr today · 1 by 30 yrs out
Nearby sold comps map
Loading sold comps map…
Walkable amenities ~0.75 mi
Loading nearby amenities…
Taxation est. · year 1
- Rental income
- $15,594
- − Mortgage interest
- −$10,951
- − Property taxes
- −$2,041
- − Insurance
- −$978
- − Repairs & maintenance
- −$1,248
- − Management
- −$1,248
- − Depreciation
- −$5,687
- Taxable loss
- −$6,558
- Est. tax savings @ 24.0%
- +$1,574
- After-tax cash flow
- $-1,428/yr
For passive investors: Depreciation is non-cash, so a rental often shows a tax loss while cash-flowing — sheltering income. Rental losses are passive: they offset passive income freely, and up to $25,000/yr can offset ordinary (W-2) income if you actively participate and your MAGI is under $100k (phasing out to $0 by $150k); unused losses carry forward. On sale, claimed depreciation is recaptured at up to 25%, and gains may owe capital-gains tax (a 1031 exchange can defer both). Figures are a year-1 estimate at your 24.0% rate — not tax advice; consult a CPA.
Schools (NCES district)
- District
- Caddo Parish
- NCES district ID
- 2200300
- Math proficiency
- 21% ▼ -33.00%
- Reading proficiency
- 32% ▼ -30.00%
- Median HH income
- $39,227
- Composite
- 22.23/100
- National rank
- #8148
- State rank
- #53 of 98 in LA
Livability — Shreveport
- Score
- 59/100
- State rank
- #270
- US rank
- #19730
Category grades
Schools grade is shown separately in the Schools card above.
Census & demographics
- Census place
- Shreveport, LA
- County
- Caddo Parish · 178,536 people
- City population
- 164,123
- Metro
- Shreveport-Bossier City, LA
- Population (ZIP)
- 12,975
- Household income
- $56,833
- Rent vs Own
- Severe rent burden
- 759.0
Population outlook (Caddo County) Hauer SSP2
- Today (2025)
- 243,190 people
- By 2030
- 237,231 · -2.5%
- By 2040
- 222,502 · -8.5%
- By 2050
- 206,516 · -15.1%
- By 2075
- 165,706 · -31.9%
- By 2100
- 122,262 · -49.7%
Race, ethnicity, and origin ACS 2023
- Neighborhood character
- Diverse neighborhood (Simpson 0.63)
- Race & ethnicity
- White 53% Black 28% Two or more races 10% Hispanic / Latino 10% Asian 3%
- Hispanic origin (detail)
- Mexican 7%
- Common ancestry
- Slovak 6% Lithuanian 4% Scottish 2%
- Foreign-born
- 5% · Canada, Vietnam
- Languages at home
- 90% English-only · Spanish 5% French/Haitian/Cajun 1% Tagalog/Filipino 1%
Political lean MEDSL · Caddo
- 2024 margin
- Toss-up / Even · D 51.6% · R 47.0% · Other 1.4%
- 2008→2024 swing
- +1.6pp toward D · 2008: 3.0pp · 2024: 4.6pp
- All cycles
- 2024: D+4.6 2020: D+6.8 2016: D+4.2 2012: D+4.9 2008: D+3.0
Not yet ingested
- Civics
- —
Market trends
- HPI YoY
- ▼ -49.61%
- Current HPI
- 104.3781
- Rent YoY
- ▲ 3.56%
- Metro
- Shreveport-Bossier City, LA
- State GDP YoY
- ▲ 3.29%
- F500 in state
- 10
Industry mix (Fortune 500 HQ in LA)
| Industry | F500 HQs | Revenue |
|---|---|---|
| Telecommunications | 2 | $23B |
|
||
| Utilities | 1 | $12B |
|
||
| Wholesale / Distribution | 1 | $5B |
|
||
| Advertising | 1 | $2B |
|
||
Price history
2 events — show timeline
- 2026-04-22 Listed $195,500 FSBO.com
- 1999-06-02 Sold (Public Records) — Public Records
Property tax history
+6.9%/yrLatest (2025): $2,041 · +0.4% YoY. Source: county tax records.
Cash-flow waterfall
monthlySold comps — $/sqft
last 12 mo · ≤1 miLoading sold comps…