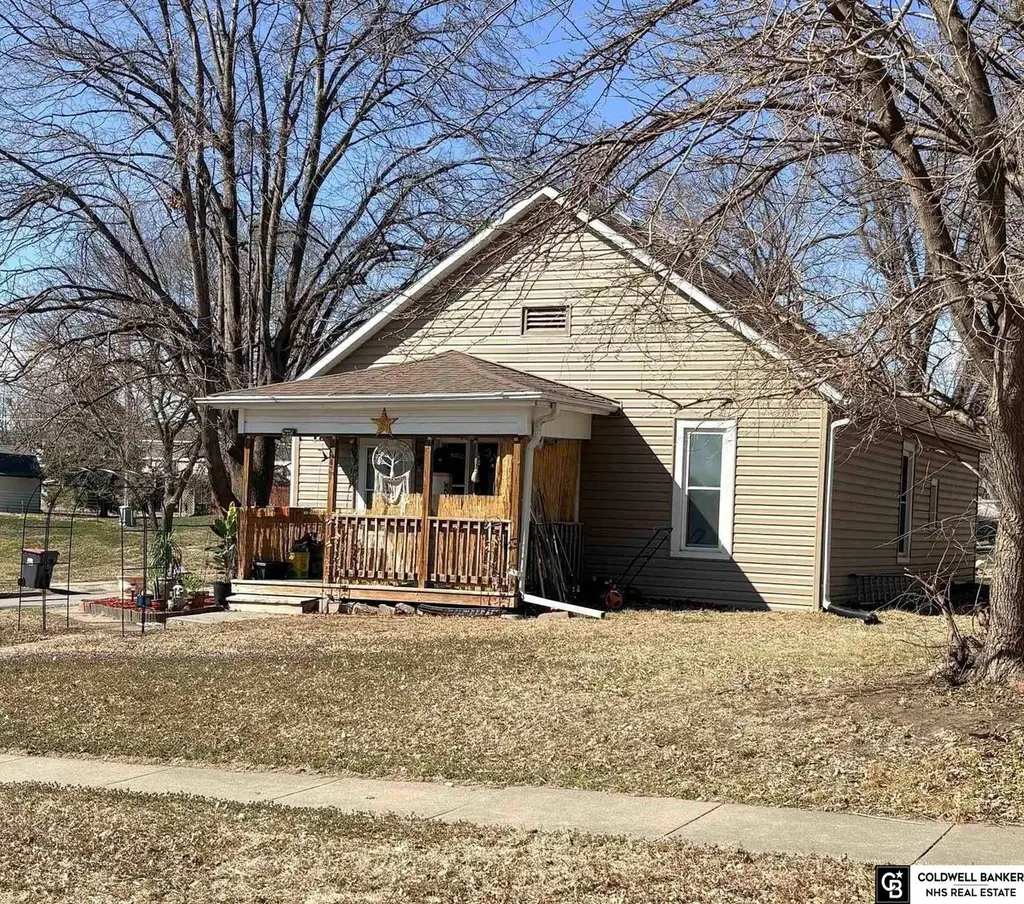
2401 N Chester St · Lincoln, NE
Flood risk 1/10 · Minimal
- FEMA flood zone
- X (unshaded)
- Chance of flooding over 30 yrs
- 0.0%
- Est. flood insurance / yr
- $473 – $860
Fire risk 1/10 · Minimal
- Est. fire insurance / yr
- $1,161 – $2,155
Heat risk 3/10 · Minor
- Hot days now (above 106°F)
- 7 days/yr
- Hot days in 30 yrs
- 16 days/yr
Wind risk 2/10 · Minimal
- Chance of severe wind over 30 yrs
- —
Air-quality risk 1/10 · Minimal
- Unhealthy air days now
- 0 days/yr
- Unhealthy air days in 30 yrs
- 0 days/yr
Risk factors via First Street. Map © Google.
Why this score? — see what drove the D+ grade
The composite is a weighted blend of 9 inputs, each scored 0–100. Each bar is that input's sub-score; the figure is the points it added to the 100-point composite (weight × sub-score).
- ARV discount +15.0/15.0
- Cash flow +12.3/30.0
- Schools +4.4/10.0
- Livability +4.2/5.0
- DSCR +3.7/10.0
- Rent growth +3.5/5.0
- 1% rule +3.2/10.0
- Condition / age +2.5/5.0
- Appreciation +0.0/10.0
$150,000
🖨 Deal sheet 📄 Offer letter ✓ Due diligence
Listing remarks MLS
Welcome to 2401 N. Chester St. This cute 3 bed 1 bath bungalow has many new updates. New water heater, electrical, furnace, windows and siding. Sits on a large corner lot that would provide enough space to build a garage. Easy access to Cornhusker Hwy and the interstate. This property is being sold as is.
Key facts
- New furnace
- New siding
- Large corner lot
Tags
Neighborhood map
What this means for you Summary
Snapshot
- This is a 2-bed/1.0-bath single-family listed at $150k.
Deal economics
- At list price, monthly cash flow is $-27 ($-328/yr) — negative.
- To cash-flow at today's rent, offer at most $145k (3.2% below list).
- To meet the 1% rule (rent ≥ 1% of price), the offer needs to be $123k (18.2% below list).
- Recommended offer: $123k (18.2% below list) — sets the bar for 1% rule.
- Cap rate 6.1% vs local median 3.0% in Lincoln — top-decile yield for the area; either an underpriced asset or a hidden risk that comps aren't pricing in. Stress-test before assuming the spread holds.
Location & tenants
- Location reads 85/100 on livability (#5 in NE, #545 nationally) — a professional / high-income tenant draw. Strengths: amenities A+, cost of living A+, housing A+; Watch: crime D+.
- Lincoln Public Schools (urban): math 50% / reading 53% proficiency, ranked #59 of 111 in NE (top 53%) — acceptable for families but not a draw, mixed tenant base, ~2y average lease.
- Market conditions: Rents rising fast (+4.0%/yr); 366 active listings in the ZIP; 14 comparable units currently listed for rent nearby; rentals lingering (median 44d on market — plan ~5-8 weeks vacancy on turnover, expect pricing pressure); 50% of comp listings sitting > 30 days — soft ceiling on asking rent; 1,940 units permitted in Lancaster County in 2024 (895 in 5+ unit buildings).
Forward outlook
- Local home prices are declining (-3.0%/yr); year-one equity from $1k of loan paydown is wiped out by about $4k of value loss. Plan a longer hold.
- Lancaster County population projected at +37% by 2050 — long-run rental-demand tailwind backs the buy-and-hold thesis.
Negotiation context
- It's been on market 73 days — a 6% lower offer ($141k) is reasonable based on typical stale-listing flexibility.
- 3 sale attempts since 11y ago with the ask held roughly flat each time — persistent listings suggest the price (not the market) is what's stuck; bring a comps-based counter.
- Current owner paid $38k; list at $150k implies a 295% gain — meaningful room to come down on a strong offer.
Risks & watch-outs
- Watch-outs: built in 1900 — expect roof / HVAC / electrical / plumbing capex.
Questions for the listing agent
- What do current leases actually rent for vs. the listed asking? Can we see a recent rent roll and the last 12 months of T-12 income?
- It's been on market 73 days. Have you received any prior offers? Is the seller open to a 18% concession, seller financing, or rate buy-down credit?
- Built in 1900 — when were the roof, HVAC, electrical panel, plumbing, and water heater last replaced?
- Why hasn't it sold? Are there any deal-killer items the seller is aware of (foundation, flood, title, zoning, code violations)?
- Is there a deadline driving the sale (1031 exchange, divorce, estate, relocation)? That informs how much negotiation room exists.
- Schools are A-rated — typically a magnet for longer-tenancy family renters. What's the average tenant stay here, and is there a school-zone premium baked into asking?
- Crime grade is D in this area — have there been break-ins, vandalism, or insurance claims at this property in the last 3 years? What carrier currently insures it and at what premium?
- The area grade is low — what's the realistic commute time and amenity access for the typical tenant pool here? Any planned neighborhood developments (good or bad) we should know about?
- What's the average days-on-market for RENTAL listings here right now (not sales)? A rising rental-DOM trend means longer vacancies and softer asking-rent achievability than the comps imply.
- What's the recent tenant-quality profile in this submarket — average credit score on applications, eviction rate, late-payment / NSF rate, and stable-employment percentage? A property-management company in the area should have these aggregated.
- How much new for-sale + rental construction is in the pipeline within 1–3 miles? Heavy new supply typically softens prices + rents 12–24 months out; constrained supply supports both.
Investment metrics
- 1% rule
- 0.82% ✗
- Cap rate
- 6.07%
- Cash-on-cash
- -0.78%
- DSCR
- 0.97
- GRM
- 10.2
CMA / ARV
- ARV (median comp)
- $206,570
- List price
- $150,000
- Delta
- -27.39%
- Verdict
- UNDERPRICED
- Comps
- 20 within 1.0 mi
Show comp detail 3 sales within ~0.75 mi
| Address | Dist | Beds/Ba | Sqft | Sold | Price | $/sf | Match |
|---|---|---|---|---|---|---|---|
| 2608 N Chester St | 0.16mi | 3/1.0 (+1) | 1,090 (+12%) | 14mo | $162,000 | $149 | 56 |
| 124 W Dawes Ave | 0.41mi | 3/1.0 (+1) | 1,040 (+7%) | 22mo | $185,000 | $178 | 47 |
| 510 Laramie Trl | 0.52mi | 2/1.0 | 832 (-15%) | 12mo | $212,000 | $255 | 40 |
Match score weights: distance 35% · size 25% · config 20% · recency 20%. Top-matched comps best support the ARV.
Projected returns pro-forma
-3.0% appreciation · 4.04% rent growth · sell at horizon
- IRR
- -16.5%
- Equity multiple
- 0.41×
- Total profit
- $-24,759
- Equity at exit
- $22,365
- IRR
- -6.6%
- Equity multiple
- 0.56×
- Total profit
- $-18,394
- Equity at exit
- $12,969
Cash invested: $42,000 (down + closing). Projections, not guarantees.
Landlord ↔ Tenant lean methodology
- Overall (STATE)
- 83 Strongly Landlord-Friendly
- State Nebraska
- 83 Strongly Landlord-Friendly · R+13
- County
- — inherits STATE
- City
- — inherits STATE
ZIP-level market 68521
- Home prices YoY
- -34.1%
- Rents YoY
- 4.0%
- Active inventory
- 366
- Price-to-rent
- 10.2×
Monthly cashflow live
- Estimated rent
- $1,227 high interval (Pro) →
- Mortgage (P&I)
- −$787
- Tax from tax record
- −$147 /mo · $1,767/yr
- Insurance
- −$62
- HOA
- −$0
- Vacancy / Maint / Mgmt
- −$258
- Net cashflow
- $-27
Break-even live
UW: 25.0% down · 7.5% · 30yr · 1.5% tax · 5.0% vac · 8.0% maint · 8.0% mgmt
Financing live
Cash to close
- Down payment
- $37,500
- Closing costs
- $4,500
- Reserves months
- —
- Total cash needed
- —
Loan-product check · same deal, 3 products live
Conventional
25% down · 7.5% · 30yr
- Down + closing
- —
- Monthly P&I
- —
- Monthly cashflow
- —
- DSCR
- —
- Eligible?
- —
Personal DTI + credit; lowest rate.
DSCR
20% down · 8.5% · 30yr
- Down + closing
- —
- Monthly P&I
- —
- Monthly cashflow
- —
- DSCR
- —
- Eligible?
- —
No personal income docs; deal must DSCR.
Hard money
10% down · 12.0% · 12mo
- Down + closing
- —
- Monthly P&I
- —
- Monthly cashflow
- —
- DSCR
- —
- Eligible?
- —
Short-term bridge; refi at stabilization.
Rent comps 14 comps
| Address | Beds | Baths | Sqft | Rent | $/sqft | DOM | Units | Dist |
|---|---|---|---|---|---|---|---|---|
| 535 W Saunders Ave Unit 3 Lincoln, NE | 2.0 | 1.0 | 889 | $945 | $1.06 | 43d | 1 | 0.10mi |
| 2700 N 1st St #2 Lincoln, NE | 2.0 | 1.0 | 897 | $1,095 | $1.22 | 21d | 1 | 0.52mi |
| 2900 N 1st St Lincoln, NE | 2.0–3.0 | 1.0–2.0 | 1061 | $945 | $0.89 | 43d | 3 | 0.63mi |
| 2636 N 4th St Unit 2636 Lincoln, NE | 3.0 | 2.0 | 1060 | $1,595 | $1.50 | 43d | 1 | 0.77mi |
| 2635 N 5th St Unit 2635 Lincoln, NE | 3.0 | 2.0 | 1060 | $1,595 | $1.50 | 43d | 1 | 0.80mi |
| 2521 N 9th St Lincoln, NE | 1.0–2.0 | 1.0–2.0 | 700 | $999 | $1.43 | 13d | 4 | 1.02mi |
| 830 Judson St Lincoln, NE | 3.0 | 1.0 | 816 | $1,700 | $2.08 | 43d | 1 | 1.22mi |
| 4441 N 1st St Lincoln, NE | 3.0 | 1.0–2.0 | 853 | $1,490 | $1.75 | 13d | 39 | 1.25mi |
| North Pointe Villas Lincoln, NE | 3.0 | 1.0–2.0 | 1022 | $1,919 | $1.88 | 13d | 25 | 1.33mi |
| 1205 Adams St Lincoln, NE | 2.0 | 1.0 | 875 | $1,350 | $1.54 | 43d | 1 | 1.39mi |
| 3201 N 12th St Lincoln, NE | 3.0 | 1.0 | 928 | $1,250 | $1.35 | 13d | 1 | 1.41mi |
| 1040 Charleston St Lincoln, NE | 1.0 | 1.0 | 596 | $750 | $1.26 | 43d | 1 | 1.44mi |
| 4231 N 7th St Lincoln, NE | 1.0 | 1.0 | 772 | $1,049 | $1.36 | 13d | 7 | 1.45mi |
| 510 Surfside Dr Lincoln, NE | 3.0 | 1.0–2.0 | 1051 | $1,615 | $1.54 | 13d | 24 | 1.49mi |
Listing history 22 events
-
2026-06-18days on market $150,000 Active 73 DOM
-
2026-06-17days on market $150,000 Active 72 DOM
-
2026-06-16days on market $150,000 Active 71 DOM
-
2026-06-15days on market $150,000 Active 70 DOM
-
2026-06-14days on market $150,000 Active 68 DOM
-
2026-06-10days on market $150,000 Active 65 DOM
-
2026-06-09days on market $150,000 Active 64 DOM
-
2026-06-08days on market $150,000 Active 63 DOM
-
2026-06-07days on market $150,000 Active 62 DOM
-
2026-06-05days on market $150,000 Active 59 DOM
-
2026-06-03days on market $150,000 Active 58 DOM
-
2026-06-02days on market $150,000 Active 57 DOM
-
2026-06-01days on market $150,000 Active 56 DOM
-
2026-05-31days on market $150,000 Active 55 DOM
-
2026-05-30days on market $150,000 Active 54 DOM
-
2026-04-06$150,000 New 309-char remark
Show marketing remark (309 chars)
Welcome to 2401 N. Chester St. This cute 3 bed 1 bath bungalow has many new updates. New water heater, electrical, furnace, windows and siding. Sits on a large corner lot that would provide enough space to build a garage. Easy access to Cornhusker Hwy and the interstate. This property is being sold as is.
-
2026-04-06historical
Show marketing remark (309 chars)
Welcome to 2401 N. Chester St. This cute 3 bed 1 bath bungalow has many new updates. New water heater, electrical, furnace, windows and siding. Sits on a large corner lot that would provide enough space to build a garage. Easy access to Cornhusker Hwy and the interstate. This property is being sold as is.
-
2026-03-23$160,000 New
-
2016-04-27soldstatus $38,000
-
2016-04-27soldstatus $38,000
-
2016-02-27historical
-
2015-12-22$55,000
ⓘ Source: listings_history table (triggers on properties + properties_extension) + one-shot
backfill from property_details.listing_events for pre-trigger history.
Tax reassessment forecast NE · Resets to sale price
- Current annual tax
- $1,767 · $147/mo
- Projected year-2 tax
- $2,595 · $216/mo
- Expected delta
- +$828/yr (+$69/mo · 46.9%)
ⓘ Screening estimate from a state-policy table — verify with the county assessor before closing.
Climate risk First Street
- Flood 1/10 Low FEMA zone X (unshaded) · 0% chance over 30 yrs
- Wildfire 1/10 Low
- Heat 3/10 Moderate 7 d/yr ≥106°F today · 16 d/yr by 30 yrs out
- Wind 2/10 Low
- Air quality 1/10 Low 0 unhealthy d/yr today · 0 by 30 yrs out
Nearby sold comps map
Loading sold comps map…
Walkable amenities ~0.75 mi
Loading nearby amenities…
Taxation est. · year 1
- Rental income
- $14,719
- − Mortgage interest
- −$8,402
- − Property taxes
- −$1,767
- − Insurance
- −$750
- − Repairs & maintenance
- −$1,177
- − Management
- −$1,177
- − Depreciation
- −$4,364
- Taxable loss
- −$2,919
- Est. tax savings @ 24.0%
- +$701
- After-tax cash flow
- $372/yr
For passive investors: Depreciation is non-cash, so a rental often shows a tax loss while cash-flowing — sheltering income. Rental losses are passive: they offset passive income freely, and up to $25,000/yr can offset ordinary (W-2) income if you actively participate and your MAGI is under $100k (phasing out to $0 by $150k); unused losses carry forward. On sale, claimed depreciation is recaptured at up to 25%, and gains may owe capital-gains tax (a 1031 exchange can defer both). Figures are a year-1 estimate at your 24.0% rate — not tax advice; consult a CPA.
Schools (NCES district)
- District
- Lincoln Public Schools
- NCES district ID
- 3172840
- Math proficiency
- 50% ▼ -6.00%
- Reading proficiency
- 53% ▼ -3.00%
- Median HH income
- $50,273
- Composite
- 44.05/100
- National rank
- #2880
- State rank
- #59 of 111 in NE
Livability — Lincoln
- Score
- 85/100
- State rank
- #5
- US rank
- #545
Category grades
Schools grade is shown separately in the Schools card above.
Census & demographics
- Census place
- Lincoln, NE
- County
- Lancaster County · 291,509 people
- City population
- 291,509
- Metro
- Lincoln, NE
- Population (ZIP)
- 37,050
- Household income
- $67,483
- Rent vs Own
- Severe rent burden
- 1500.0
Population outlook (Lancaster County) Hauer SSP2
- Today (2025)
- 352,806 people
- By 2030
- 377,899 · +7.1%
- By 2040
- 428,582 · +21.5%
- By 2050
- 483,103 · +36.9%
- By 2075
- 632,390 · +79.2%
- By 2100
- 759,513 · +115.3%
Race, ethnicity, and origin ACS 2023
- Neighborhood character
- Predominantly White (70%)
- Race & ethnicity
- White 70% Hispanic / Latino 12% Asian 8% Two or more races 7% Black 5%
- Hispanic origin (detail)
- Mexican 7%
- Common ancestry
- Romanian 2% Arab 2% Italian 2%
- Foreign-born
- 15% · Vietnam, Canada, United Kingdom
- Languages at home
- 78% English-only · Spanish 9% Vietnamese 6% Arabic 3%
Political lean MEDSL · Lancaster
- 2024 margin
- Toss-up / Even · D 51.4% · R 47.1% · Other 1.5%
- 2008→2024 swing
- -0.7pp no change · 2008: 5.0pp · 2024: 4.3pp
- All cycles
- 2024: D+4.3 2020: D+7.8 2016: D+0.1 2012: R+1.0 2008: D+5.0
Not yet ingested
- Civics
- —
Market trends
- HPI YoY
- ▼ -124.30%
- Current HPI
- 239.8394
- Rent YoY
- ▲ 4.04%
- Metro
- Lincoln, NE
- State GDP YoY
- ▲ 0.68%
- F500 in state
- 2
Industry mix (Fortune 500 HQ in NE)
| Industry | F500 HQs | Revenue |
|---|---|---|
| Conglomerate | 1 | $371B |
|
||
Price history
+172.7% since first listed7 events — show timeline
- 2026-04-06 Listing Removed — GPRMLS
- 2026-04-06 Listed $150,000 GPRMLS
- 2026-03-23 Listed $160,000 GPRMLS
- 2016-04-27 Sold (Public Records) $38,000 Public Records
- 2016-04-27 Sold (MLS) $38,000 GPRMLS
- 2016-02-27 Listing Removed — GPRMLS
- 2015-12-22 Listed $55,000 GPRMLS
Property tax history
+5.4%/yrLatest (2025): $1,767 · +171.8% YoY. Source: county tax records.
Cash-flow waterfall
monthlySold comps — $/sqft
last 12 mo · ≤1 miLoading sold comps…