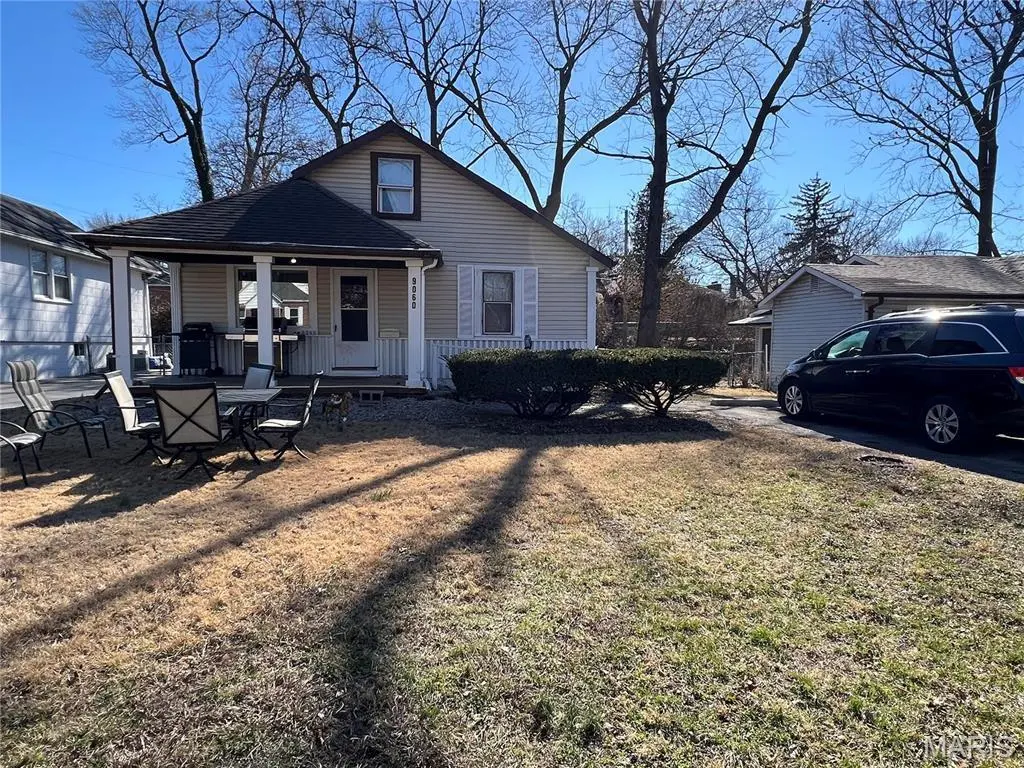
9060 Patrick Dr · St. John, MO
Flood risk 8/10 · Major
- FEMA flood zone
- X (unshaded)
- Chance of flooding over 30 yrs
- 0.99%
- Est. flood insurance / yr
- $473 – $860
Fire risk 1/10 · Minimal
- Est. fire insurance / yr
- $1,054 – $1,958
Heat risk 4/10 · Minor
- Hot days now (above 106°F)
- 7 days/yr
- Hot days in 30 yrs
- 21 days/yr
Wind risk 2/10 · Minimal
- Chance of severe wind over 30 yrs
- 1.0%
Air-quality risk 2/10 · Minimal
- Unhealthy air days now
- 1 days/yr
- Unhealthy air days in 30 yrs
- 3 days/yr
Risk factors via First Street. Map © Google.
Why this score? — see what drove the C grade
The composite is a weighted blend of 9 inputs, each scored 0–100. Each bar is that input's sub-score; the figure is the points it added to the 100-point composite (weight × sub-score).
- Cash flow +22.3/30.0
- ARV discount +15.0/15.0
- DSCR +7.1/10.0
- 1% rule +5.5/10.0
- Rent growth +3.0/5.0
- Livability +2.5/5.0
- Condition / age +2.5/5.0
- Schools +1.7/10.0
- Appreciation +0.0/10.0
$95,000
🖨 Deal sheet 📄 Offer letter ✓ Due diligence
Listing remarks MLS
A well-maintained house located on a quiet street. The house feature a coved front porch. Beautiful flooring through out. A large bedroom in the main floor. There is a recreation area and a second bedroom. The laundry room on the main floor. The property to sold "as-is".
Key facts
- 6,499 sq ft lot
- Built 1925
- Listed 90 days
Neighborhood map
What this means for you Summary
Snapshot
- This is a 1-bed/1.0-bath single-family listed at $95k.
Deal economics
- At list price, monthly cash flow is $100 ($1k/yr) — positive.
- The deal already cash-flows at list — no discount required.
- Meets the 1% rule at list price ($998 rent vs $95k).
- Recommended offer: $86k (9.0% below list) — sets the bar for market timing.
Location & tenants
- Location reads: area grade C — affects rentability + tenant quality, not the cash-flow math above.
- Ritenour (suburban): math 13% / reading 27% proficiency, ranked #304 of 324 in MO (top 94%) — low school quality limits family demand, transient renter base, plan for 1-2y turnover; 66% free/reduced lunch — lower-income household profile, screen leases tightly.
- Market conditions: Rents rising (+2.0%/yr); 118 active listings in the ZIP; 9 comparable units currently listed for rent nearby; rentals at typical pace (median 20d on market — plan ~3-4 weeks tenant-placement turnaround); 920 units permitted in St. Louis County in 2024 (250 in 5+ unit buildings).
Forward outlook
- Local home prices are declining (-3.0%/yr); year-one equity from $657 of loan paydown is wiped out by about $3k of value loss. Plan a longer hold.
Negotiation context
- It's been on market 91 days — a 9% lower offer ($86k) is reasonable based on typical stale-listing flexibility.
- 4 sale attempts since 9y ago with the ask held roughly flat each time — persistent listings suggest the price (not the market) is what's stuck; bring a comps-based counter.
- Current owner paid $10k; list at $95k implies a 850% gain — meaningful room to come down on a strong offer.
Risks & watch-outs
- Watch-outs: flood insurance adds $56/mo; built in 1925 — expect roof / HVAC / electrical / plumbing capex.
- Climate carrying-cost: severe flood risk — expect insurance premiums to compound above CPI over the hold.
Questions for the listing agent
- It's been on market 91 days. Have you received any prior offers? Is the seller open to a 9% concession, seller financing, or rate buy-down credit?
- Built in 1925 — when were the roof, HVAC, electrical panel, plumbing, and water heater last replaced?
- What's the actual annual flood-insurance premium (NFIP or private), and is the property in a SFHA with mandatory coverage?
- Why hasn't it sold? Are there any deal-killer items the seller is aware of (foundation, flood, title, zoning, code violations)?
- Is there a deadline driving the sale (1031 exchange, divorce, estate, relocation)? That informs how much negotiation room exists.
- What's the average days-on-market for RENTAL listings here right now (not sales)? A rising rental-DOM trend means longer vacancies and softer asking-rent achievability than the comps imply.
- What's the recent tenant-quality profile in this submarket — average credit score on applications, eviction rate, late-payment / NSF rate, and stable-employment percentage? A property-management company in the area should have these aggregated.
- How much new for-sale + rental construction is in the pipeline within 1–3 miles? Heavy new supply typically softens prices + rents 12–24 months out; constrained supply supports both.
Investment metrics
- 1% rule
- 1.05% ✓
- Cap rate
- 8.26%
- Cash-on-cash
- 7.03%
- DSCR
- 1.31
- GRM
- 7.9
CMA / ARV
- ARV (median comp)
- $129,620
- List price
- $95,000
- Delta
- -26.71%
- Verdict
- UNDERPRICED
- Comps
- 20 within 1.0 mi
Show comp detail 12 sales within ~0.75 mi
| Address | Dist | Beds/Ba | Sqft | Sold | Price | $/sf | Match |
|---|---|---|---|---|---|---|---|
| 3654 Boswell Ave | 0.10mi | 2/1.0 (+1) | 825 (+10%) | 5mo | $95,000 | $115 | 69 |
| 3630 Brown Rd Rear | 0.31mi | 2/1.0 (+1) | 816 (+9%) | 2mo | $44,900 | $55 | 64 |
| 3534 Calvert Ave | 0.43mi | 2/1.0 (+1) | 720 (-4%) | 7mo | $150,000 | $208 | 62 |
| 8909 Tutwiler Ave | 0.45mi | 2/1.0 (+1) | 792 (+6%) | 8mo | $109,900 | $139 | 58 |
| 3510 Dix Ave | 0.53mi | 1/1.0 | 696 (-7%) | 9mo | $108,000 | $155 | 56 |
| 3926 Edmundson Rd | 0.73mi | 2/1.0 (+1) | 768 (+2%) | 4mo | $59,900 | $78 | 53 |
| 8710 Ezra Dr | 0.63mi | 2/1.5 (+1) | 791 (+6%) | 2mo | $119,900 | $152 | 52 |
| 9014 Tutwiler Ave | 0.37mi | 2/1.0 (+1) | 850 (+14%) | 4mo | $155,000 | $182 | 52 |
| 4436 Brenton Ave | 0.67mi | 2/1.0 (+1) | 780 (+4%) | 9mo | $99,500 | $128 | 50 |
| 9428 Kathlyn Dr | 0.51mi | 2/1.0 (+1) | 816 (+9%) | 9mo | $132,000 | $162 | 49 |
| 3220 Marvin Ave | 0.65mi | 2/1.0 (+1) | 812 (+8%) | 6mo | $99,900 | $123 | 46 |
| 8626 Engler Ave | 0.67mi | 2/2.0 (+1) | 828 (+10%) | 8mo | $145,000 | $175 | 36 |
Match score weights: distance 35% · size 25% · config 20% · recency 20%. Top-matched comps best support the ARV.
Projected returns pro-forma
-3.0% appreciation · 2.04% rent growth · sell at horizon
- IRR
- -10.3%
- Equity multiple
- 0.63×
- Total profit
- $-9,925
- Equity at exit
- $14,165
- IRR
- -2.4%
- Equity multiple
- 0.85×
- Total profit
- $-4,119
- Equity at exit
- $8,214
Cash invested: $26,600 (down + closing). Projections, not guarantees.
Landlord ↔ Tenant lean methodology
- Overall (STATE)
- 81 Strongly Landlord-Friendly
- State Missouri
- 81 Strongly Landlord-Friendly · R+10
- County
- — inherits STATE
- City
- — inherits STATE
ZIP-level market 63114
- Rents YoY
- 2.0%
- Active inventory
- 118
- Price-to-rent
- 7.9×
Monthly cashflow live
- Estimated rent
- $998 high interval (Pro) →
- Mortgage (P&I)
- −$498
- Tax from tax record
- −$95 /mo · $1,134/yr
- Insurance
- −$40
- Flood insurance flood zone
- −$56 /mo · $666/yr
- HOA
- −$0
- Vacancy / Maint / Mgmt
- −$210
- Net cashflow
- $100
Break-even live
UW: 25.0% down · 7.5% · 30yr · 1.5% tax · 5.0% vac · 8.0% maint · 8.0% mgmt
Financing live
Cash to close
- Down payment
- $23,750
- Closing costs
- $2,850
- Reserves months
- —
- Total cash needed
- —
Loan-product check · same deal, 3 products live
Conventional
25% down · 7.5% · 30yr
- Down + closing
- —
- Monthly P&I
- —
- Monthly cashflow
- —
- DSCR
- —
- Eligible?
- —
Personal DTI + credit; lowest rate.
DSCR
20% down · 8.5% · 30yr
- Down + closing
- —
- Monthly P&I
- —
- Monthly cashflow
- —
- DSCR
- —
- Eligible?
- —
No personal income docs; deal must DSCR.
Hard money
10% down · 12.0% · 12mo
- Down + closing
- —
- Monthly P&I
- —
- Monthly cashflow
- —
- DSCR
- —
- Eligible?
- —
Short-term bridge; refi at stabilization.
Rent comps 9 comps
| Address | Beds | Baths | Sqft | Rent | $/sqft | DOM | Units | Dist |
|---|---|---|---|---|---|---|---|---|
| 9987 Sloane Sq Unit 9987A St. Louis, MO | 1.0 | 1.0 | 571 | $695 | $1.22 | 44d | 1 | 0.78mi |
| 9987 Sloane Sq Apt A St. Louis, MO | 1.0 | 1.0 | 571 | $695 | $1.22 | 20d | 1 | 0.78mi |
| 3208 Dix Ave Saint Louis, MO | 2.0 | 1.0 | 656 | $1,235 | $1.88 | 10d | 1 | 0.78mi |
| 8700 Crocus Ln Saint Louis, MO | 1.0 | 1.0 | 700 | $950 | $1.36 | 7d | 2 | 0.78mi |
| 9316 Koenig Cir Berkeley, MO | 2.0 | 1.0 | 720 | $1,150 | $1.60 | 4d | 5 | 1.00mi |
| 3710 Geraldine Ave Apt 3 St Ann, MO | 1.0 | 1.0 | 400 | $675 | $1.69 | 44d | 1 | 1.17mi |
| 3961 Jane Ave Unit 3963 St Ann, MO | 2.0 | 1.0 | 750 | $1,195 | $1.59 | 15d | 1 | 1.33mi |
| 4120 Geraldine Ave St Ann, MO | 1.0 | 1.0 | 540 | $875 | $1.62 | 22d | 1 | 1.40mi |
| 4120 Geraldine Ave St Ann, MO | 1.0 | 1.0 | 540 | $875 | $1.62 | 44d | 1 | 1.40mi |
Listing history 23 events
-
2026-06-18days on market $95,000 Active 91 DOM
-
2026-06-17days on market $95,000 Active 90 DOM
-
2026-06-16days on market $95,000 Active 89 DOM
-
2026-06-15days on market $95,000 Active 88 DOM
-
2026-06-13days on market $95,000 Active 86 DOM
-
2026-06-09days on market $95,000 Active 82 DOM
-
2026-06-08days on market $95,000 Active 81 DOM
-
2026-06-07days on market $95,000 Active 80 DOM
-
2026-06-03days on market $95,000 Active 76 DOM
-
2026-06-02days on market $95,000 Active 75 DOM
-
2026-06-01days on market $95,000 Active 74 DOM
-
2026-05-31days on market $95,000 Active 73 DOM
-
2026-03-20$95,000 Active 288-char remark
Show marketing remark (288 chars)
A well-maintained house located on a quiet street. The house feature a coved front porch. Beautiful flooring through out. A large bedroom in the main floor. There is a recreation area and a second bedroom. The laundry room on the main floor. The property to sold "as-is".
-
2026-03-19historical $95,000 288-char remark
Show marketing remark (288 chars)
A well-maintained house located on a quiet street. The house feature a coved front porch. Beautiful flooring through out. A large bedroom in the main floor. There is a recreation area and a second bedroom. The laundry room on the main floor. The property to sold "as-is".
-
2025-10-08status Active
-
2025-10-06price $99,000
-
2025-07-22$105,000 Active
-
2017-03-16soldstatus $10,000
-
2017-03-15soldstatus Closed
-
2017-03-01status Pending
-
2017-02-27price $10,000
-
2017-02-18$15,000 Active
-
1991-01-02soldstatus $12,000
ⓘ Source: listings_history table (triggers on properties + properties_extension) + one-shot
backfill from property_details.listing_events for pre-trigger history.
Tax reassessment forecast MO · Resets to sale price
- Current annual tax
- $1,134 · $95/mo
- Projected year-2 tax
- $1,134 · $95/mo
- Expected delta
- $0/yr ($0/mo · 0.0%)
ⓘ Screening estimate from a state-policy table — verify with the county assessor before closing.
Climate risk First Street
- Flood 8/10 Severe FEMA zone X (unshaded) · 99% chance over 30 yrs
- Wildfire 1/10 Low
- Heat 4/10 Moderate 7 d/yr ≥106°F today · 21 d/yr by 30 yrs out
- Wind 2/10 Low 100% chance of damaging wind over 30 yrs
- Air quality 2/10 Low 1 unhealthy d/yr today · 3 by 30 yrs out
Nearby sold comps map
Loading sold comps map…
Walkable amenities ~0.75 mi
Loading nearby amenities…
Taxation est. · year 1
- Rental income
- $11,972
- − Mortgage interest
- −$5,321
- − Property taxes
- −$1,134
- − Insurance
- −$1,142
- − Repairs & maintenance
- −$958
- − Management
- −$958
- − Depreciation
- −$2,764
- Taxable loss
- −$304
- Est. tax savings @ 24.0%
- +$73
- After-tax cash flow
- $1,277/yr
For passive investors: Depreciation is non-cash, so a rental often shows a tax loss while cash-flowing — sheltering income. Rental losses are passive: they offset passive income freely, and up to $25,000/yr can offset ordinary (W-2) income if you actively participate and your MAGI is under $100k (phasing out to $0 by $150k); unused losses carry forward. On sale, claimed depreciation is recaptured at up to 25%, and gains may owe capital-gains tax (a 1031 exchange can defer both). Figures are a year-1 estimate at your 24.0% rate — not tax advice; consult a CPA.
Schools (NCES district)
- District
- Ritenour
- NCES district ID
- 2926640
- Math proficiency
- 13% ▼ -14.00%
- Reading proficiency
- 27% ▼ -7.00%
- Median HH income
- $41,410
- Composite
- 17.04/100
- National rank
- #9125
- State rank
- #304 of 324 in MO
Livability — St. John
No livability data for this city. (Only ~50 U.S. cities are tracked.)
Census & demographics
- Census place
- St. John, MO
- County
- Saint Louis County · 888,823 people
- Metro
- St. Louis, MO-IL
- Population (ZIP)
- 33,969
- Household income
- $55,870
- Rent vs Own
- Severe rent burden
- 1595.0
Population outlook (St. Louis County) Hauer SSP2
- Today (2025)
- 1,025,227 people
- By 2030
- 1,028,023 · +0.3%
- By 2040
- 1,020,940 · -0.4%
- By 2050
- 1,007,280 · -1.8%
- By 2075
- 987,277 · -3.7%
- By 2100
- 921,984 · -10.1%
Race, ethnicity, and origin ACS 2023
- Neighborhood character
- Diverse neighborhood (Simpson 0.64)
- Race & ethnicity
- White 50% Black 30% Hispanic / Latino 11% Two or more races 6% Asian 2%
- Hispanic origin (detail)
- Mexican 7%
- Common ancestry
- Lithuanian 3% Italian 2% Romanian 1%
- Foreign-born
- 9% · Canada, Vietnam
- Languages at home
- 84% English-only · Spanish 10% French/Haitian/Cajun 2% Tagalog/Filipino 1%
Political lean MEDSL · St. Louis
- 2024 margin
- Strong D (+23.4) · D 60.8% · R 37.4% · Other 1.7%
- 2008→2024 swing
- +3.5pp toward D · 2008: 19.9pp · 2024: 23.4pp
- All cycles
- 2024: D+23.4 2020: D+24.0 2016: D+16.2 2012: D+13.7 2008: D+19.9
Not yet ingested
- Civics
- —
Market trends
- HPI YoY
- ▼ -276.62%
- Current HPI
- 223.9305
- Rent YoY
- ▲ 2.04%
- Metro
- St. Louis, MO-IL
- State GDP YoY
- ▲ 1.84%
- F500 in state
- 20
Industry mix (Fortune 500 HQ in MO)
| Industry | F500 HQs | Revenue |
|---|---|---|
| Healthcare | 1 | $163B |
|
||
| Insurance | 1 | $21B |
|
||
| Industrial Technology | 1 | $17B |
|
||
| Retail | 1 | $16B |
|
||
| Industrial Distribution | 1 | $10B |
|
||
| Utilities | 1 | $9B |
|
||
Price history
+691.7% since first listed11 events — show timeline
- 2026-03-20 Listed $95,000 MARIS as Distributed by MLS Grid
- 2026-03-19 Coming Soon $95,000 MARIS as Distributed by MLS Grid
- 2025-10-08 Relisted — MARIS as Distributed by MLS Grid
- 2025-10-06 Price Changed $99,000 MARIS as Distributed by MLS Grid
- 2025-07-22 Listed $105,000 MARIS as Distributed by MLS Grid
- 2017-03-16 Sold (Public Records) $10,000 Public Records
- 2017-03-15 Sold (MLS) — MARIS as Distributed by MLS Grid
- 2017-03-01 Pending — MARIS as Distributed by MLS Grid
- 2017-02-27 Price Changed $10,000 MARIS as Distributed by MLS Grid
- 2017-02-18 Listed $15,000 MARIS as Distributed by MLS Grid
- 1991-01-02 Sold (Public Records) $12,000 Public Records
Property tax history
-2.5%/yrLatest (2022): $1,134 · +0.0% YoY. Source: county tax records.
Cash-flow waterfall
monthlySold comps — $/sqft
last 12 mo · ≤1 miLoading sold comps…