 Duplex
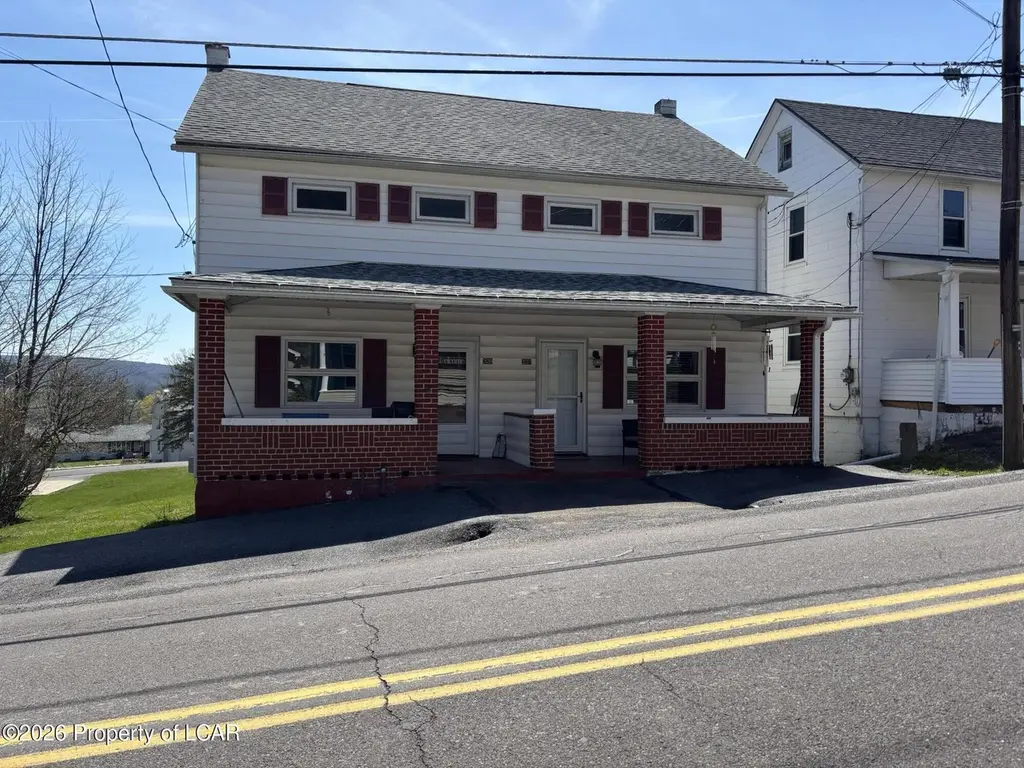
227 229 Hazle St · Nuremberg, PA
Flood risk No data
- FEMA flood zone
- —
- Chance of flooding over 30 yrs
- —
- Est. flood insurance / yr
- —
Fire risk No data
- Est. fire insurance / yr
- —
Heat risk No data
- Hot days now (above threshold)
- —
- Hot days in 30 yrs
- —
Wind risk No data
- Chance of severe wind over 30 yrs
- —
Air-quality risk No data
- Unhealthy air days now
- —
- Unhealthy air days in 30 yrs
- —
Risk factors via First Street. Map © Google.
Why this score? — see what drove the C- grade
The composite is a weighted blend of 9 inputs, each scored 0–100. Each bar is that input's sub-score; the figure is the points it added to the 100-point composite (weight × sub-score).
- Cash flow +21.9/30.0
- Appreciation +9.3/10.0
- DSCR +7.0/10.0
- 1% rule +5.7/10.0
- Livability +3.1/5.0
- Rent growth +2.5/5.0
- Condition / age +2.2/5.0
- Schools +2.0/10.0
- ARV discount +0.0/15.0
$229,900
🖨 Deal sheet (PDF) 📄 Offer letter ✓ Due diligence
Multi-family units
County records classify this as Multi-Family (2-4 Unit). Listing-text estimate: 2 units. confirmed
Listing remarks MLS
Rural Nuremberg setting for this tenant-occupied double with a Beautiful large backyard. Completely remodeled: newer roof(2018), new flooring, new appliances, finished 3rd floor, new programmable digital thermostats, 4 BRs, 1 bath, 3 BRs, 2 baths. #227 $1400/month, #229 side, $780/month. Owner pays water & Sewer.
Key facts
- Modern flooring
- Finished third floor
- Newer roof
Tags
Property features AI
Finance
- Financial info: Annual tax approximately $2,336.30
Exterior
- Utilities: Public water; Public sewer
- Home design: Multi-family residential income property; Aluminum siding
- Construction: Aluminum siding construction
- Exterior features: Lot approximately 100 x 150; Residential zoning
Interior
- Heating & cooling: Electric heating; Propane heating; Baseboard heating
- Interior features: Full unfinished basement
Neighborhood map
What this means for you Summary
Snapshot
- This is a 2 × 4-bed/1.5-bath units multifamily listed at $230k. Condition is rated fair.
Deal economics
- At list price, monthly cash flow is $361 ($4k/yr) — positive. Per door: $180/mo.
- The deal already cash-flows at list — no discount required.
- Meets the 1% rule at list price ($2k rent vs $230k).
- Recommended offer: $226k (1.5% below list) — sets the bar for market timing.
Location & tenants
- Location reads 61/100 on livability (#1,387 in PA) — a middle-class / working-renter tenant base. Strengths: cost of living A+, housing A-; Watch: amenities F, commute F, health & safety F.
- Hazleton Area SD (suburban): math 18% / reading 30% proficiency, ranked #476 of 539 in PA (top 88%) — low school quality limits family demand, transient renter base, plan for 1-2y turnover.
- Zoned schools: Valley El/Ms (math 16% / reading 51%, grade F, #1,081 of 1,518 statewide, top 71%, 911 students, 100% FRL); Hazleton Area Hs (math 53% / reading 8%, grade F, #347 of 437 statewide, top 79%, 3,795 students, 83% FRL) — zoned schools average 91% FRL vs 60% district-wide (32 pts higher); higher-poverty schools than district average — tighter screening recommended.
- Market conditions: 2 active listings in the ZIP; 349 units permitted in Luzerne County in 2024 (16 in 5+ unit buildings).
Forward outlook
- In year one you build about $21k of equity ($2k loan paydown + $20k appreciation (8.6% local appreciation)).
- Luzerne County population projected at +4% by 2050 — modest demand growth; plan on rents tracking national, not racing it.
- At projected returns (8.6% appreciation + 3.0% rent growth), your $64k cash investment doubles in ~3 years — after that, you're playing with house money.
- By year 2, paydown + projected appreciation supports a ~$34k cash-out refi (75% LTV) — recoverable capital for the next deal without selling this one.
Negotiation context
- It's been on market 26 days — a 2% lower offer ($226k) is reasonable based on typical stale-listing flexibility.
- 3 sale attempts since 7y ago with the ask held roughly flat each time — persistent listings suggest the price (not the market) is what's stuck; bring a comps-based counter.
- Current owner paid $158k; 45% above their basis — modest negotiation headroom, anchor on the comps not their cost.
Questions for the listing agent
- Can we see the unit-by-unit rent roll, current vacancy, and any below-market leases? What's the average tenancy length?
- What capital expenditures (roof, boiler, parking lot, exteriors) have been made in the last 5 years, and what's planned in the next 2?
- Have any recent inspections been done? Can we get a copy of the seller's disclosures and any deferred-maintenance estimates?
- Is there a deadline driving the sale (1031 exchange, divorce, estate, relocation)? That informs how much negotiation room exists.
- Schools are F-rated, which usually means shorter tenancies and higher turnover. Who's the typical renter profile here, and what's been the actual vacancy rate?
- What's the average days-on-market for RENTAL listings here right now (not sales)? A rising rental-DOM trend means longer vacancies and softer asking-rent achievability than the comps imply.
- What's the recent tenant-quality profile in this submarket — average credit score on applications, eviction rate, late-payment / NSF rate, and stable-employment percentage? A property-management company in the area should have these aggregated.
- How much new apartment / multifamily construction is in the pipeline within 1–3 miles? Heavy new supply (>2% of stock underway) typically softens rents 12–24 months out; light construction supports rent growth.
Investment metrics
- 1% rule
- 1.07% ✓
- Cap rate
- 8.18%
- Cash-on-cash
- 6.73%
- DSCR
- 1.30
- GRM
- 7.8
CMA / ARV
- ARV (median comp)
- $154,120
- List price
- $229,900
- Delta
- 49.17%
- Verdict
- OVERPRICED
- Comps
- 2 within 1.0 mi
Projected returns pro-forma
8.58% appreciation · 3.0% rent growth · sell at horizon
- IRR
- 26.4%
- Equity multiple
- 2.96×
- Total profit
- $126,385
- Equity at exit
- $183,868
- IRR
- 23.5%
- Equity multiple
- 6.44×
- Total profit
- $350,354
- Equity at exit
- $374,124
Cash invested: $64,372 (down + closing). Projections, not guarantees.
Landlord ↔ Tenant lean methodology
- Overall (STATE)
- 62 Landlord-Friendly
- State Pennsylvania
- 62 Landlord-Friendly · EVEN
- County
- — inherits STATE
- City
- — inherits STATE
ZIP-level market 18241
- Home prices YoY
- 5.2%
- Active inventory
- 2
- Price-to-rent
- 15.5×
Monthly cashflow live
- Estimated rent
- $2,468 medium interval (Pro) →
- Mortgage (P&I)
- −$1,206
- Tax est. 1.5%
- −$287 /mo · $3,448/yr
- Insurance
- −$96
- HOA
- −$0
- Vacancy / Maint / Mgmt
- −$518
- Net cashflow
- $361
Break-even live
Sensitivity live
| Price | -10% $520 | -5% $440 | +0% $361 | +5% $281 | +10% $202 |
|---|---|---|---|---|---|
| Rent | -10% $166 | -5% $263 | +0% $361 | +5% $458 | +10% $556 |
| Rate | -1.0pp $477 | -0.5pp $419 | base $361 | +0.5pp $301 | +1.0pp $241 |
2-unit breakdown (identical units grouped — click to expand)
| Units | Beds | Baths | Est. rent |
|---|---|---|---|
| 2× units | 4 | 1.5 | $2,468 |
| #1 | 4 | 1.5 | $1,234 |
| #2 | 4 | 1.5 | $1,234 |
| Total (2 units) | $2,468 | ||
UW: 25.0% down · 7.5% · 30yr · 1.5% tax · 5.0% vac · 8.0% maint · 8.0% mgmt
Financing live
Cash to close
- Down payment
- $57,475
- Closing costs
- $6,897
- Reserves months
- —
- Total cash needed
- —
Loan-product check · same deal, 3 products live
Conventional
25% down · 7.5% · 30yr
- Down + closing
- —
- Monthly P&I
- —
- Monthly cashflow
- —
- DSCR
- —
- Eligible?
- —
Personal DTI + credit; lowest rate.
DSCR
20% down · 8.5% · 30yr
- Down + closing
- —
- Monthly P&I
- —
- Monthly cashflow
- —
- DSCR
- —
- Eligible?
- —
No personal income docs; deal must DSCR.
Hard money
10% down · 12.0% · 12mo
- Down + closing
- —
- Monthly P&I
- —
- Monthly cashflow
- —
- DSCR
- —
- Eligible?
- —
Short-term bridge; refi at stabilization.
Listing history 7 events
-
2026-05-31status $229,900 Pending 26 DOM
-
2026-05-30days on market $229,900 Active 26 DOM
-
2026-05-04$229,900 Active 347-char remark
-
2022-06-09soldstatus $158,200 320-char remark
Show marketing remark (320 chars)
Rural Nuremberg setting for this tenant-occupied double with a Beautiful large backyard. Completely remodeled: newer roof(2018), new flooring, new appliances, finished 3rd floor, new programmable digital thermostats, 4 BRs, 1 bath, 3 BRs, 2 baths. #227 $1400/month, #229 side, $780/month. Owner pays water & Sewer.
-
2022-04-06$149,900 320-char remark
Show marketing remark (320 chars)
Rural Nuremberg setting for this tenant-occupied double with a Beautiful large backyard. Completely remodeled: newer roof(2018), new flooring, new appliances, finished 3rd floor, new programmable digital thermostats, 4 BRs, 1 bath, 3 BRs, 2 baths. #227 $1400/month, #229 side, $780/month. Owner pays water & Sewer.
-
2019-08-22soldstatus $102,897
Show marketing remark (394 chars)
Quiet Nuremberg setting for this tenant-occupied double. Completely remodeled in 2018: new roof, new flooring, new appliances, refaced kitchen cabinets, new plumbing fixtures & vanities, some new drop ceilings, finished attics, new programmable digital thermostats, completely repainted. #227 side, 4 BRs, 1 bath, $750/month, #229 side, 3 BRs, 2 baths, $675/month. Beautiful big backyard!
-
2019-06-24$99,900
Show marketing remark (394 chars)
Quiet Nuremberg setting for this tenant-occupied double. Completely remodeled in 2018: new roof, new flooring, new appliances, refaced kitchen cabinets, new plumbing fixtures & vanities, some new drop ceilings, finished attics, new programmable digital thermostats, completely repainted. #227 side, 4 BRs, 1 bath, $750/month, #229 side, 3 BRs, 2 baths, $675/month. Beautiful big backyard!
ⓘ Source: listings_history table (triggers on properties + properties_extension) + one-shot
backfill from property_details.listing_events for pre-trigger history.
Nearby sold comps map
Loading sold comps map…
Walkable amenities ~0.75 mi
Loading nearby amenities…
Taxation est. · year 1
- Rental income
- $29,616
- − Mortgage interest
- −$12,878
- − Property taxes
- −$3,448
- − Insurance
- −$1,150
- − Repairs & maintenance
- −$2,369
- − Management
- −$2,369
- − Depreciation
- −$6,688
- Taxable income
- $713
- Est. tax owed @ 24.0%
- −$171
- After-tax cash flow
- $4,160/yr
For passive investors: Depreciation is non-cash, so a rental often shows a tax loss while cash-flowing — sheltering income. Rental losses are passive: they offset passive income freely, and up to $25,000/yr can offset ordinary (W-2) income if you actively participate and your MAGI is under $100k (phasing out to $0 by $150k); unused losses carry forward. On sale, claimed depreciation is recaptured at up to 25%, and gains may owe capital-gains tax (a 1031 exchange can defer both). Figures are a year-1 estimate at your 24.0% rate — not tax advice; consult a CPA.
Condition & rehab AI · 12 photos
This multi-family property requires significant repairs and updates to improve its condition and value. The home is in fair condition with major repairs needed in the kitchen, bathrooms, exterior, flooring, and windows. Painting and updating appliances would significantly increase its resale and rental value.
Repairs flagged
- Major Appliances — Outdated and cluttered
- Major Bathroom — Cluttered and in need of cleaning
- Major Exterior siding — Signs of wear
- Major Flooring — Worn
- Major Paint — Chipped and worn
- Major Windows — Old and may need replacement
- Major Foundation — Uneven and may need repair
Value-add opportunities
- Both Painting and updating appliances — Improves appearance and functionality
- Both Landscaping and curb appeal — Enhances curb appeal and property value
- Both Window replacement — Improves energy efficiency and appearance
Renovation cost estimate screening
| Repair item | Severity | Est. cost |
|---|---|---|
| Appliances · Outdated and cluttered | Major | $15,000–50,000 |
| Bathroom · Cluttered and in need of cleaning | Major | $15,000–50,000 |
| Exterior siding · Signs of wear | Major | $15,000–50,000 |
| Flooring · Worn | Major | $15,000–50,000 |
| Paint · Chipped and worn | Major | $15,000–50,000 |
| Windows · Old and may need replacement | Major | $15,000–50,000 |
| Foundation · Uneven and may need repair | Major | $15,000–50,000 |
| Total estimated repair cost · 7 items | $105,000–350,000 |
Value-add ROI direction
- Both Painting and updating appliances — Improves appearance and functionality ↑
- Both Landscaping and curb appeal — Enhances curb appeal and property value ↑
- Both Window replacement — Improves energy efficiency and appearance ↑
ⓘ Cost ranges are severity-bucket heuristics (US national rule-of-thumb). Get contractor quotes + a written scope before underwriting a rehab budget.
Schools (NCES district)
- District
- Hazleton Area SD
- NCES district ID
- 4211700
- Math proficiency
- 18% ▼ -3.00%
- Reading proficiency
- 30% ▼ -15.00%
- Median HH income
- $42,247
- Composite
- 20.44/100
- National rank
- #8582
- State rank
- #476 of 539 in PA
Livability — Nuremberg
- Score
- 61/100
- State rank
- #1387
- US rank
- #17486
Category grades
Schools grade is shown separately in the Schools card above.
Census & demographics
- Population (ZIP)
- 293
Population outlook (Luzerne County) Hauer SSP2
- Today (2025)
- 319,505 people
- By 2030
- 319,943 · +0.1%
- By 2040
- 322,643 · +1.0%
- By 2050
- 330,817 · +3.5%
- By 2075
- 379,145 · +18.7%
- By 2100
- 431,908 · +35.2%
Race, ethnicity, and origin ACS 2023
- Neighborhood character
- Predominantly White (97%)
- Race & ethnicity
- White 97% Hispanic / Latino 3% Two or more races 3%
- Common ancestry
- Iranian 10% Romanian 6% Danish 5%
- Foreign-born
- 8%
- Languages at home
- 92% English-only · Russian/Polish/Slavic 8%
Political lean MEDSL · Luzerne
- 2024 margin
- R (+19.2) · D 40.0% · R 59.2%
- 2008→2024 swing
- -27.6pp toward R · 2008: 8.4pp · 2024: -19.2pp
- All cycles
- 2024: R+19.2 2020: R+14.4 2016: R+19.6 2012: D+4.8 2008: D+8.4
Not yet ingested
- Civics
- —
Market trends
- HPI YoY
- ▲ 8.58%
- Current HPI
- 174.1427
- Rent YoY
- —
- Metro
- —
- State GDP YoY
- ▲ 1.68%
- F500 in state
- 34
Industry mix (Fortune 500 HQ in PA)
| Industry | F500 HQs | Revenue |
|---|---|---|
| Healthcare | 2 | $309B |
|
||
| Insurance | 2 | $27B |
|
||
| Telecommunications / Media | 1 | $124B |
|
||
| Industrial Distribution | 1 | $22B |
|
||
| Financial Services | 1 | $20B |
|
||
| Chemicals / Materials | 1 | $18B |
|
||
Price history
+130.1% since first listed6 events — show timeline
- 2026-05-30 Pending — LCAR
- 2026-05-04 Listed $229,900 LCAR
- 2022-06-09 Sold (MLS) $158,200 LCAR
- 2022-04-06 Listed $149,900 LCAR
- 2019-08-22 Sold (MLS) $102,897 LCAR
- 2019-06-24 Listed $99,900 LCAR
Cash-flow waterfall
monthlySold comps — $/sqft
last 12 mo · ≤1 miLoading sold comps…