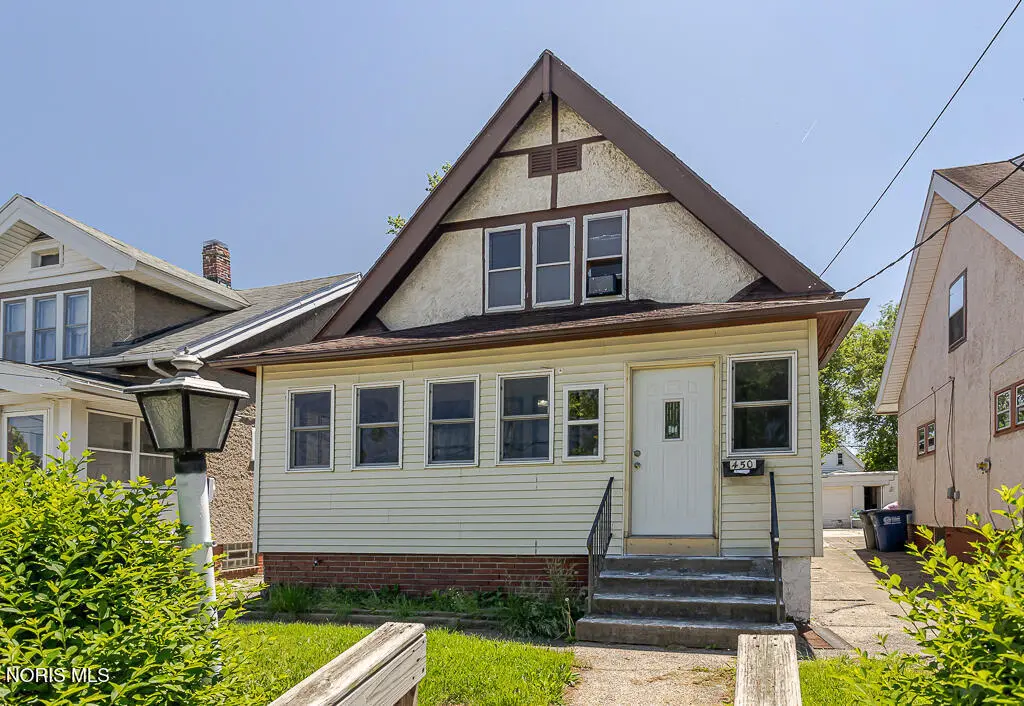
450 2nd St · Toledo, OH
Flood risk 6/10 · Moderate
- FEMA flood zone
- X (unshaded)
- Chance of flooding over 30 yrs
- 0.74%
- Est. flood insurance / yr
- $473 – $860
Fire risk 1/10 · Minimal
- Est. fire insurance / yr
- $713 – $1,323
Heat risk 3/10 · Minor
- Hot days now (above 100°F)
- 7 days/yr
- Hot days in 30 yrs
- 16 days/yr
Wind risk 2/10 · Minimal
- Chance of severe wind over 30 yrs
- —
Air-quality risk 2/10 · Minimal
- Unhealthy air days now
- 1 days/yr
- Unhealthy air days in 30 yrs
- 2 days/yr
Risk factors via First Street. Map © Google.
Why this score? — see what drove the C grade
The composite is a weighted blend of 9 inputs, each scored 0–100. Each bar is that input's sub-score; the figure is the points it added to the 100-point composite (weight × sub-score).
- Cash flow +29.4/30.0
- DSCR +10.0/10.0
- 1% rule +8.0/10.0
- Rent growth +3.8/5.0
- Livability +3.3/5.0
- Condition / age +2.5/5.0
- Schools +1.6/10.0
- ARV discount +0.0/15.0
- Appreciation +0.0/10.0
$84,900
🖨 Deal sheet (PDF) 📄 Offer letter ✓ Due diligence
Listing remarks MLS
This is a great investment property, 3 bed/ 1 bath home. Features enclosed front porch and back mudroom area. Beautiful woodwork trim on main floor. Updates includes new flooring, paint, Furnace/AC '18. New insulation in various areas of home. Newer block windows in basement. Detached garage has extra storage space with attic space above. Home is occupied by a tenant for $1300. Lease is until 8/31/2024.
Key facts
- Ample storage space
- Fresh paint
- Updated flooring
Tags
Property features AI
Exterior
- Parking: Detached 2-car garage; Driveway parking
- Utilities: Electricity available; Natural gas available; Public water; Public sewer (connected)
- Home design: Single-family residential home; Two levels (one story listed as total stories)
- Construction: Vinyl siding
- Exterior features: Enclosed porch; Shingle roof
Interior
- Kitchen: Kitchen on main level (approx. 11 x 9)
- Bedrooms: Third bedroom located on the upper level (approx. 11 x 8); Two additional upper-level rooms (approx. 13 x 10 and 12 x 10) — listed room levels indicate upper level
- Flooring: Vinyl flooring
- Bathrooms: One full bathroom
- Heating & cooling: Forced air heating; Central air conditioning
- Interior features: Seven total rooms; Finished basement; Enclosed porch
- Laundry & utility: Laundry located in the basement
Neighborhood map
What this means for you Summary
Snapshot
- This is a 3-bed/1.0-bath single-family listed at $85k.
Deal economics
- At list price, monthly cash flow is $302 ($4k/yr) — positive.
- The deal already cash-flows at list — no discount required.
- Meets the 1% rule at list price ($1k rent vs $85k).
- Recommended offer: $84k (1.5% below list) — sets the bar for market timing.
- Cap rate 10.6% vs local median 7.6% in Toledo — top-decile yield for the area; either an underpriced asset or a hidden risk that comps aren't pricing in. Stress-test before assuming the spread holds.
Location & tenants
- Location reads 66/100 on livability (#645 in OH) — a middle-class / working-renter tenant base. Strengths: cost of living A+, housing A+, health & safety A+; Watch: amenities C-, crime F, commute F.
- Toledo City (urban): math 15% / reading 24% proficiency, ranked #634 of 656 in OH (top 97%) — low school quality limits family demand, transient renter base, plan for 1-2y turnover; 72% free/reduced lunch — lower-income household profile, screen leases tightly.
- Zoned schools: Navarre Elementary School (math 12% / reading 14%, grade F, #1,429 of 1,584 statewide, top 90%, 428 students, 0% FRL); Waite High School (math 12% / reading 24%, grade F, #687 of 781 statewide, top 88%, 997 students, 0% FRL) — zoned schools average 0% FRL vs 72% district-wide (72 pts lower); this property's tenant base skews higher-income than the district average.
- Market conditions: Rents rising fast (+5.4%/yr); 117 active listings in the ZIP; 40 comparable units currently listed for rent nearby; rentals at typical pace (median 24d on market — plan ~3-4 weeks tenant-placement turnaround); 40% of comp listings sitting > 30 days — soft ceiling on asking rent; lower-income renter base — watch delinquency; 415 units permitted in Lucas County in 2024 (122 in 5+ unit buildings).
- This rent runs 34% of the median local income ($39k/yr) — at the standard rent-burdened threshold; future hikes will face affordability resistance.
Forward outlook
- Local home prices are declining (-3.0%/yr); year-one equity from $587 of loan paydown is wiped out by about $3k of value loss. Plan a longer hold.
- Lucas County population projected at -16% by 2050 — secular population decline; favor cash flow + early exit over multi-decade hold.
- At projected returns (-3.0% appreciation + 5.4% rent growth), your $24k cash investment doubles in ~7 years — after that, you're playing with house money.
Negotiation context
- It's been on market 20 days — a 2% lower offer ($84k) is reasonable based on typical stale-listing flexibility.
- 4 sale attempts since 4y ago with the ask held roughly flat each time — persistent listings suggest the price (not the market) is what's stuck; bring a comps-based counter.
Risks & watch-outs
- Watch-outs: built in 1916 — expect roof / HVAC / electrical / plumbing capex.
- Climate carrying-cost: major flood risk — expect insurance premiums to compound above CPI over the hold.
Questions for the listing agent
- Built in 1916 — when were the roof, HVAC, electrical panel, plumbing, and water heater last replaced?
- Is there a deadline driving the sale (1031 exchange, divorce, estate, relocation)? That informs how much negotiation room exists.
- Schools are D-rated, which usually means shorter tenancies and higher turnover. Who's the typical renter profile here, and what's been the actual vacancy rate?
- Crime grade is F in this area — have there been break-ins, vandalism, or insurance claims at this property in the last 3 years? What carrier currently insures it and at what premium?
- What's the average days-on-market for RENTAL listings here right now (not sales)? A rising rental-DOM trend means longer vacancies and softer asking-rent achievability than the comps imply.
- What's the recent tenant-quality profile in this submarket — average credit score on applications, eviction rate, late-payment / NSF rate, and stable-employment percentage? A property-management company in the area should have these aggregated.
- How much new for-sale + rental construction is in the pipeline within 1–3 miles? Heavy new supply typically softens prices + rents 12–24 months out; constrained supply supports both.
Investment metrics
- 1% rule
- 1.30% ✓
- Cap rate
- 10.56%
- Cash-on-cash
- 15.25%
- DSCR
- 1.68
- GRM
- 6.4
CMA / ARV
- ARV (on-the-fly)
- $64,152
- Comps found
- 12
Show comp detail 12 sales within ~0.75 mi
| Address | Dist | Beds/Ba | Sqft | Sold | Price | $/sf | Match |
|---|---|---|---|---|---|---|---|
| 437 3rd St | 0.04mi | 3/1.0 | 1,188 (0%) | 5mo | $62,500 | $53 | 94 |
| 427 Walden Ave | 0.25mi | 3/2.0 | 1,290 (+9%) | 1mo | $51,000 | $40 | 70 |
| 57 Jay St | 0.62mi | 3/1.0 | 1,109 (-7%) | 1mo | $50,000 | $45 | 59 |
| 31 Nevada St | 0.54mi | 3/2.0 | 1,260 (+6%) | 2mo | $79,900 | $63 | 59 |
| 729 Utah St | 0.65mi | 3/1.0 | 1,116 (-6%) | 1mo | $60,000 | $54 | 59 |
| 150 E Broadway St | 0.46mi | 3/1.0 | 1,048 (-12%) | 1mo | $20,000 | $19 | 58 |
| 302 Parker Ave | 0.46mi | 3/1.0 | 1,330 (+12%) | 7mo | $93,000 | $70 | 53 |
| 136 Steel St | 0.73mi | 4/1.0 (+1) | 1,229 (+4%) | 3mo | $95,000 | $77 | 53 |
| 635 Milton St | 0.67mi | 3/1.0 | 1,096 (-8%) | 4mo | $36,500 | $33 | 52 |
| 1320 Mott Ave | 0.63mi | 4/1.0 (+1) | 1,299 (+9%) | 4mo | $85,400 | $66 | 46 |
| 1012 Idaho St | 0.72mi | 3/1.0 | 1,041 (-12%) | 0mo | $84,900 | $82 | 46 |
| 1133 Nevada St | 0.68mi | 2/1.0 (-1) | 1,044 (-12%) | 4mo | $36,000 | $34 | 40 |
Match score weights: distance 35% · size 25% · config 20% · recency 20%. Top-matched comps best support the ARV.
Projected returns pro-forma
-3.0% appreciation · 5.37% rent growth · sell at horizon
- IRR
- 8.5%
- Equity multiple
- 1.34×
- Total profit
- $8,186
- Equity at exit
- $12,659
- IRR
- 19.7%
- Equity multiple
- 2.83×
- Total profit
- $43,556
- Equity at exit
- $7,341
Cash invested: $23,772 (down + closing). Projections, not guarantees.
Landlord ↔ Tenant lean methodology
- Overall (STATE)
- 73 Landlord-Friendly
- State Ohio
- 73 Landlord-Friendly · R+6
- County
- — inherits STATE
- City
- — inherits STATE
ZIP-level market 43605
- Home prices YoY
- -25.6%
- Rents YoY
- 5.4%
- Active inventory
- 117
- Price-to-rent
- 6.4×
Monthly cashflow live
- Estimated rent
- $1,106 high interval (Pro) →
- Mortgage (P&I)
- −$445
- Tax from tax record
- −$91 /mo · $1,091/yr
- Insurance
- −$35
- HOA
- −$0
- Vacancy / Maint / Mgmt
- −$232
- Net cashflow
- $302
Break-even live
Sensitivity live
| Price | -10% $350 | -5% $326 | +0% $302 | +5% $278 | +10% $254 |
|---|---|---|---|---|---|
| Rent | -10% $215 | -5% $258 | +0% $302 | +5% $346 | +10% $389 |
| Rate | -1.0pp $345 | -0.5pp $324 | base $302 | +0.5pp $280 | +1.0pp $258 |
UW: 25.0% down · 7.5% · 30yr · 1.5% tax · 5.0% vac · 8.0% maint · 8.0% mgmt
Financing live
Cash to close
- Down payment
- $21,225
- Closing costs
- $2,547
- Reserves months
- —
- Total cash needed
- —
Loan-product check · same deal, 3 products live
Conventional
25% down · 7.5% · 30yr
- Down + closing
- —
- Monthly P&I
- —
- Monthly cashflow
- —
- DSCR
- —
- Eligible?
- —
Personal DTI + credit; lowest rate.
DSCR
20% down · 8.5% · 30yr
- Down + closing
- —
- Monthly P&I
- —
- Monthly cashflow
- —
- DSCR
- —
- Eligible?
- —
No personal income docs; deal must DSCR.
Hard money
10% down · 12.0% · 12mo
- Down + closing
- —
- Monthly P&I
- —
- Monthly cashflow
- —
- DSCR
- —
- Eligible?
- —
Short-term bridge; refi at stabilization.
Rent comps 40 comps
| Address | Beds | Baths | Sqft | Rent | $/sqft | DOM | Units | Dist |
|---|---|---|---|---|---|---|---|---|
| 470 2nd St Unit 1 Toledo, OH | 2.0 | 1.0 | 950 | $799 | $0.84 | 44d | 1 | 0.06mi |
| 414 Platt St Unit ST-3 Toledo, OH | 3.0 | 1.0 | 1500 | $1,150 | $0.77 | 24d | 1 | 0.22mi |
| 420 Platt St Toledo, OH | 2.0 | 1.0 | 1499 | $685 | $0.46 | 21d | 1 | 0.23mi |
| 29 Garfield Pl Toledo, OH | 4.0 | 2.0 | 1300 | $1,250 | $0.96 | 14d | 1 | 0.31mi |
| 625 Riverside Dr Toledo, OH | 1.0–2.0 | 1.0–2.0 | 860 | $1,767 | $2.05 | 14d | 37 | 0.38mi |
| 537 Potter St Toledo, OH | 2.0 | 1.0 | 1200 | $625 | $0.52 | 24d | 1 | 0.38mi |
| 653 Oswald St Toledo, OH | 2.0 | 1.0 | 920 | $800 | $0.87 | 44d | 1 | 0.42mi |
| 20 Greenwood Ave Toledo, OH | 3.0 | 1.0 | 1496 | $1,150 | $0.77 | 14d | 1 | 0.47mi |
| 1305 Mott Ave Toledo, OH | 3.0 | 1.0 | 1080 | $1,000 | $0.93 | 44d | 1 | 0.62mi |
| 1306 Mott Ave Toledo, OH | 3.0 | 1.5 | 1282 | $1,149 | $0.90 | 44d | 1 | 0.62mi |
| 200 N St Clair St Toledo, OH | 2.0 | 1.0–2.0 | 835 | $2,550 | $3.05 | 14d | 15 | 0.65mi |
| 1123 Nevada St Toledo, OH | 2.0 | 1.0 | 792 | $900 | $1.14 | 14d | 1 | 0.67mi |
| 221 Licking St Unit 2 Toledo, OH | 3.0 | 1.0 | 1048 | $1,099 | $1.05 | 24d | 1 | 0.71mi |
| 834 Oak St Toledo, OH | 3.0 | 1.0 | 1064 | $900 | $0.85 | 44d | 1 | 0.75mi |
| 513 Adams St Toledo, OH | 1.0–2.0 | 1.0 | 1175 | $1,424 | $1.21 | 14d | 11 | 0.78mi |
| 128 Carbon St Toledo, OH | 3.0 | 1.0 | 1113 | $1,200 | $1.08 | 24d | 1 | 0.79mi |
| 223 Valleywood Dr Toledo, OH | 2.0 | 1.0 | 1098 | $1,099 | $1.00 | 24d | 1 | 0.80mi |
| 724 Plymouth St Toledo, OH | 2.0 | 1.0 | 819 | $750 | $0.92 | 44d | 1 | 0.84mi |
| 1119 N Summit St Toledo, OH | 2.0 | 2.0 | 1226 | $1,750 | $1.43 | 24d | 1 | 0.85mi |
| 1119 N Summit St Toledo, OH | 2.0 | 2.0 | 1500 | $1,890 | $1.26 | 44d | 1 | 0.85mi |
| 1119 N Summit St Toledo, OH | 1.0–2.0 | 1.0–2.0 | 1023 | $1,750 | $1.71 | 14d | 2 | 0.85mi |
| 557 Valleywood Dr Toledo, OH | 3.0 | 1.0 | 848 | $1,100 | $1.30 | 44d | 1 | 0.89mi |
| 908 Forsythe St Unit Upstairs Toledo, OH | 2.0 | 1.0 | 1164 | $900 | $0.77 | 14d | 1 | 0.91mi |
| 908 Forsythe St Unit Downstairs Toledo, OH | 3.0 | 1.0 | 1164 | $950 | $0.82 | 44d | 1 | 0.91mi |
| 946 Butler St Toledo, OH | 2.0 | 1.0 | 944 | $650 | $0.69 | 44d | 1 | 0.92mi |
| 626 Walnut St Toledo, OH | 3.0 | 1.0 | 1088 | $995 | $0.91 | 44d | 1 | 0.92mi |
| 921 Berry St Toledo, OH | 4.0 | 1.0 | 1204 | $1,350 | $1.12 | 14d | 1 | 0.93mi |
| 950 Oak St Unit 1 Toledo, OH | 2.0 | 1.0 | 725 | $700 | $0.97 | 44d | 1 | 0.94mi |
| 1614 Nevada St Toledo, OH | 2.0 | 1.0 | 1172 | $1,000 | $0.85 | 21d | 1 | 0.94mi |
| 1505 Navarre Ave Toledo, OH | 3.0 | 1.0 | 1331 | $1,145 | $0.86 | 44d | 1 | 1.00mi |
| 948 White St Toledo, OH | 3.0 | 1.0 | 1024 | $1,135 | $1.11 | 14d | 1 | 1.01mi |
| 508 Howland Ave Toledo, OH | 3.0 | 1.0 | 840 | $1,000 | $1.19 | 44d | 1 | 1.02mi |
| 337 Broadway St Unit 201 Toledo, OH | 2.0 | 1.0 | 1455 | $1,650 | $1.13 | 24d | 1 | 1.03mi |
| 571 Howland Ave Toledo, OH | 2.0 | 1.0 | 874 | $875 | $1.00 | 44d | 1 | 1.07mi |
| 1106 White St Toledo, OH | 3.0 | 1.0 | 1200 | $1,015 | $0.85 | 14d | 1 | 1.09mi |
| 630 Mulberry St Toledo, OH | 2.0 | 1.0 | 1000 | $950 | $0.95 | 24d | 1 | 1.11mi |
| 1031 N Michigan St Toledo, OH | 3.0 | 2.0 | 1488 | $1,195 | $0.80 | 24d | 1 | 1.16mi |
| 1449 N Huron St Toledo, OH | 4.0 | 2.0 | 1430 | $1,045 | $0.73 | 14d | 1 | 1.18mi |
| 332 14th St Unit 303 Toledo, OH | 3.0 | 1.5 | 1040 | $1,000 | $0.96 | 44d | 1 | 1.21mi |
| 322 14th St Apt 203 Toledo, OH | 3.0 | 1.5 | 1065 | $1,000 | $0.94 | 14d | 1 | 1.22mi |
Listing history 16 events
-
2026-06-18days on market $84,900 Active 20 DOM
-
2026-06-17days on market $84,900 Active 19 DOM
-
2026-06-16days on market $84,900 Active 18 DOM
-
2026-06-15days on market $84,900 Active 17 DOM
-
2026-06-14days on market $84,900 Active 15 DOM
-
2026-06-10days on market $84,900 Active 12 DOM
-
2026-06-09days on market $84,900 Active 11 DOM
-
2026-06-08days on market $84,900 Active 10 DOM
-
2026-06-07days on market $84,900 Active 9 DOM
-
2026-06-05days on market $84,900 Active 6 DOM
-
2026-06-03days on market $84,900 Active 5 DOM
-
2026-06-02days on market $84,900 Active 4 DOM
-
2026-06-01days on market $84,900 Active 3 DOM
-
2026-05-31days on market $84,900 Active 2 DOM
-
2026-05-30remarks 373-char remark
-
2026-05-30$84,900 Active 1 DOM
ⓘ Source: listings_history table (triggers on properties + properties_extension) + one-shot
backfill from property_details.listing_events for pre-trigger history.
Tax reassessment forecast OH · Partial reset (capped growth)
- Current annual tax
- $1,091 · $91/mo
- Projected year-2 tax
- $1,208 · $101/mo
- Expected delta
- +$117/yr (+$10/mo · 10.7%)
ⓘ Screening estimate from a state-policy table — verify with the county assessor before closing.
Climate risk First Street
- Flood 6/10 Major FEMA zone X (unshaded) · 74% chance over 30 yrs
- Wildfire 1/10 Low
- Heat 3/10 Moderate 7 d/yr ≥100°F today · 16 d/yr by 30 yrs out
- Wind 2/10 Low
- Air quality 2/10 Low 1 unhealthy d/yr today · 2 by 30 yrs out
Nearby sold comps map
Loading sold comps map…
Walkable amenities ~0.75 mi
Loading nearby amenities…
Taxation est. · year 1
- Rental income
- $13,269
- − Mortgage interest
- −$4,756
- − Property taxes
- −$1,091
- − Insurance
- −$424
- − Repairs & maintenance
- −$1,062
- − Management
- −$1,062
- − Depreciation
- −$2,470
- Taxable income
- $2,405
- Est. tax owed @ 24.0%
- −$577
- After-tax cash flow
- $3,047/yr
For passive investors: Depreciation is non-cash, so a rental often shows a tax loss while cash-flowing — sheltering income. Rental losses are passive: they offset passive income freely, and up to $25,000/yr can offset ordinary (W-2) income if you actively participate and your MAGI is under $100k (phasing out to $0 by $150k); unused losses carry forward. On sale, claimed depreciation is recaptured at up to 25%, and gains may owe capital-gains tax (a 1031 exchange can defer both). Figures are a year-1 estimate at your 24.0% rate — not tax advice; consult a CPA.
Schools (NCES district)
- District
- Toledo City
- NCES district ID
- 3904490
- Math proficiency
- 15% ▼ -16.00%
- Reading proficiency
- 24% ▼ -13.00%
- Median HH income
- $32,137
- Composite
- 15.76/100
- National rank
- #9276
- State rank
- #634 of 656 in OH
Livability — Toledo
- Score
- 66/100
- State rank
- #645
- US rank
- #11442
Category grades
Schools grade is shown separately in the Schools card above.
Census & demographics
- Census place
- Toledo, OH
- County
- Lucas County · 380,724 people
- City population
- 280,811
- Metro
- Toledo, OH
- Population (ZIP)
- 24,441
- Household income
- $39,118
- Rent vs Own
- Severe rent burden
- 1257.0
Population outlook (Lucas County) Hauer SSP2
- Today (2025)
- 420,751 people
- By 2030
- 410,187 · -2.5%
- By 2040
- 384,019 · -8.7%
- By 2050
- 355,125 · -15.6%
- By 2075
- 291,683 · -30.7%
- By 2100
- 233,670 · -44.5%
Race, ethnicity, and origin ACS 2023
- Neighborhood character
- Diverse neighborhood (Simpson 0.61)
- Race & ethnicity
- White 57% Hispanic / Latino 21% Black 14% Two or more races 14%
- Hispanic origin (detail)
- Mexican 17% Puerto Rican 2%
- Common ancestry
- Romanian 3% Lithuanian 2% Portuguese 1%
- Foreign-born
- 3% · Canada
- Languages at home
- 91% English-only · Spanish 7% Arabic 1%
Political lean MEDSL · Lucas
- 2024 margin
- D (+12.6) · D 55.8% · R 43.2%
- 2008→2024 swing
- -18.9pp toward R · 2008: 31.4pp · 2024: 12.6pp
- All cycles
- 2024: D+12.6 2020: D+16.8 2016: D+17.4 2012: D+30.4 2008: D+31.4
Not yet ingested
- Civics
- —
Market trends
- HPI YoY
- ▼ -47.85%
- Current HPI
- 138.6894
- Rent YoY
- ▲ 5.37%
- Metro
- Toledo, OH
- State GDP YoY
- ▲ 1.98%
- F500 in state
- 48
Industry mix (Fortune 500 HQ in OH)
| Industry | F500 HQs | Revenue |
|---|---|---|
| Insurance | 3 | $145B |
|
||
| Industrial Machinery | 3 | $49B |
|
||
| Financial Services | 3 | $24B |
|
||
| Consumer Goods | 2 | $93B |
|
||
| Aerospace / Defense | 2 | $47B |
|
||
| Utilities | 2 | $33B |
|
||
Price history
+239.6% since first listed17 events — show timeline
- 2026-05-29 Listed $84,900 NORIS
- 2026-02-28 Rental Removed $1,145 TENANTTURNER2
- 2026-02-21 Price Changed $1,145 TENANTTURNER2
- 2026-01-15 Listed for Rent $1,345 TENANTTURNER2
- 2025-10-14 Price Changed $76,000 NORIS
- 2024-02-07 Sold (Public Records) $76,000 Public Records
- 2024-02-05 Sold (MLS) $76,000 NORIS
- 2024-01-30 Pending — NORIS
- 2024-01-23 Contingent — NORIS
- 2024-01-17 Listed $79,900 NORIS
- 2022-09-22 Sold (Public Records) $54,000 Public Records
- 2022-09-12 Sold (MLS) $54,000 NORIS
- 2022-09-12 Price Changed $54,000 NORIS
- 2022-07-25 Contingent — NORIS
- 2022-07-20 Price Changed $52,000 NORIS
- 2022-07-20 Listed $51,000 NORIS
- 2013-07-16 Sold (Public Records) $25,000 Public Records
Property tax history
+3.7%/yrLatest (2025): $1,091 · +3.0% YoY. Source: county tax records.
Cash-flow waterfall
monthlySold comps — $/sqft
last 12 mo · ≤1 miLoading sold comps…