 Multi-family
3220 Chestnut St · Laredo, TX
Flood risk 1/10 · Minimal
- FEMA flood zone
- X (unshaded)
- Chance of flooding over 30 yrs
- 0.0%
- Est. flood insurance / yr
- $507 – $1,088
Fire risk 5/10 · Moderate
- Est. fire insurance / yr
- $1,222 – $2,270
Heat risk 9/10 · Severe
- Hot days now (above 110°F)
- 7 days/yr
- Hot days in 30 yrs
- 23 days/yr
Wind risk 8/10 · Major
- Chance of severe wind over 30 yrs
- 80.0%
Air-quality risk 1/10 · Minimal
- Unhealthy air days now
- 0 days/yr
- Unhealthy air days in 30 yrs
- 0 days/yr
Risk factors via First Street. Map © Google.
Why this score? — see what drove the B- grade
The composite is a weighted blend of 9 inputs, each scored 0–100. Each bar is that input's sub-score; the figure is the points it added to the 100-point composite (weight × sub-score).
- Cash flow +30.0/30.0
- 1% rule +10.0/10.0
- DSCR +10.0/10.0
- ARV discount +7.5/15.0
- Livability +3.7/5.0
- Rent growth +2.5/5.0
- Condition / age +2.2/5.0
- Schools +2.0/10.0
- Appreciation +0.0/10.0
$79,000
🖨 Deal sheet (PDF) 📄 Offer letter ✓ Due diligence
Multi-family units
County records classify this as Multi-Family (2-4 Unit). Listing-text estimate: 1 unit. estimate disagrees with records
Key facts
- 4,287 sq ft lot
- Built 1970
- Listed 27 days
Property features AI
Exterior
- Utilities: Public water
- Home design: Duplex (residential income); 1 story
- Construction: Frame construction; Slab foundation
- Exterior features: Chain link fencing; Level, corner lot; Zoned R-3
Interior
- Flooring: Vinyl
- Bathrooms: 2 full bathrooms
- Heating & cooling: Window unit air conditioning
- Interior features: Electric water heater; Vinyl flooring
Neighborhood map
What this means for you Summary
Snapshot
- This is a 3-bed/2.0-bath multifamily listed at $79k. Condition is rated fair.
Deal economics
- At list price, monthly cash flow is $395 ($5k/yr) — positive.
- The deal already cash-flows at list — no discount required.
- Meets the 1% rule at list price ($1k rent vs $79k).
- Recommended offer: $78k (1.5% below list) — sets the bar for market timing.
- Cap rate 12.3% vs local median 4.1% in Laredo — top-decile yield for the area; either an underpriced asset or a hidden risk that comps aren't pricing in. Stress-test before assuming the spread holds.
Location & tenants
- Location reads 73/100 on livability (#227 in TX) — a middle-class / working-renter tenant base. Strengths: cost of living A+, housing A+, health & safety A+; Watch: crime C-, employment D+, amenities F.
- Laredo ISD (urban): math 21% / reading 29% proficiency, ranked #739 of 826 in TX (top 90%) — low school quality limits family demand, transient renter base, plan for 1-2y turnover; 82% free/reduced lunch — lower-income household profile, screen leases tightly.
- Zoned schools: H B Zachry El (math 17% / reading 32%, grade F, #3,052 of 4,322 statewide, top 74%, 592 students, 95% FRL); Joaquin Cigarroa Middle (math 15% / reading 24%, grade F, #1,445 of 1,662 statewide, top 88%, 1,104 students, 100% FRL); Dr Leo Cigarroa H S (math 21% / reading 21%, grade F, #1,385 of 1,632 statewide, top 85%, 1,472 students, 98% FRL) — zoned schools average 97% FRL vs 82% district-wide (15 pts higher); higher-poverty schools than district average — tighter screening recommended.
- Market conditions: 485 active listings in the ZIP; 15 comparable units currently listed for rent nearby; rentals lingering (median 45d on market — plan ~5-8 weeks vacancy on turnover, expect pricing pressure); 100% of comp listings sitting > 30 days — soft ceiling on asking rent; 1,448 units permitted in Webb County in 2024 (245 in 5+ unit buildings).
Forward outlook
- Local home prices are declining (-3.0%/yr); year-one equity from $546 of loan paydown is wiped out by about $2k of value loss. Plan a longer hold.
- Webb County population projected at +23% by 2050 — long-run rental-demand tailwind backs the buy-and-hold thesis.
- At projected returns (-3.0% appreciation + 3.0% rent growth), your $22k cash investment doubles in ~6 years — after that, you're playing with house money.
Negotiation context
- It's been on market 27 days — a 2% lower offer ($78k) is reasonable based on typical stale-listing flexibility.
Risks & watch-outs
- Climate carrying-cost: severe wind risk, 80% chance of damaging wind over 30y; moderate wildfire risk; extreme-heat days projected 7→23/yr by 2055 (HVAC capex compounding) — expect insurance premiums to compound above CPI over the hold.
Questions for the listing agent
- Have any recent inspections been done? Can we get a copy of the seller's disclosures and any deferred-maintenance estimates?
- Built in 1970 — when were the roof, HVAC, electrical panel, plumbing, and water heater last replaced?
- Is there a deadline driving the sale (1031 exchange, divorce, estate, relocation)? That informs how much negotiation room exists.
- What's the average days-on-market for RENTAL listings here right now (not sales)? A rising rental-DOM trend means longer vacancies and softer asking-rent achievability than the comps imply.
- What's the recent tenant-quality profile in this submarket — average credit score on applications, eviction rate, late-payment / NSF rate, and stable-employment percentage? A property-management company in the area should have these aggregated.
- How much new apartment / multifamily construction is in the pipeline within 1–3 miles? Heavy new supply (>2% of stock underway) typically softens rents 12–24 months out; light construction supports rent growth.
Investment metrics
- 1% rule
- 1.51% ✓
- Cap rate
- 12.30%
- Cash-on-cash
- 21.44%
- DSCR
- 1.95
- GRM
- 5.5
CMA / ARV
No comps found within radius.
Projected returns pro-forma
-3.0% appreciation · 3.0% rent growth · sell at horizon
- IRR
- 14.0%
- Equity multiple
- 1.56×
- Total profit
- $12,386
- Equity at exit
- $11,779
- IRR
- 22.8%
- Equity multiple
- 2.96×
- Total profit
- $43,268
- Equity at exit
- $6,830
Cash invested: $22,120 (down + closing). Projections, not guarantees.
Landlord ↔ Tenant lean methodology
- Overall (STATE)
- 87 Strongly Landlord-Friendly
- State Texas
- 87 Strongly Landlord-Friendly · R+5
- County
- — inherits STATE
- City
- — inherits STATE
ZIP-level market 78046
- Home prices YoY
- -13.0%
- Active inventory
- 485
- Price-to-rent
- 5.5×
Monthly cashflow live
- Estimated rent
- $1,191 high interval (Pro) →
- Mortgage (P&I)
- −$414
- Tax est. 1.5%
- −$99 /mo · $1,185/yr
- Insurance
- −$33
- HOA
- −$0
- Vacancy / Maint / Mgmt
- −$250
- Net cashflow
- $395
Break-even live
Sensitivity live
| Price | -10% $450 | -5% $422 | +0% $395 | +5% $368 | +10% $341 |
|---|---|---|---|---|---|
| Rent | -10% $301 | -5% $348 | +0% $395 | +5% $442 | +10% $489 |
| Rate | -1.0pp $435 | -0.5pp $415 | base $395 | +0.5pp $375 | +1.0pp $354 |
UW: 25.0% down · 7.5% · 30yr · 1.5% tax · 5.0% vac · 8.0% maint · 8.0% mgmt
Financing live
Cash to close
- Down payment
- $19,750
- Closing costs
- $2,370
- Reserves months
- —
- Total cash needed
- —
Loan-product check · same deal, 3 products live
Conventional
25% down · 7.5% · 30yr
- Down + closing
- —
- Monthly P&I
- —
- Monthly cashflow
- —
- DSCR
- —
- Eligible?
- —
Personal DTI + credit; lowest rate.
DSCR
20% down · 8.5% · 30yr
- Down + closing
- —
- Monthly P&I
- —
- Monthly cashflow
- —
- DSCR
- —
- Eligible?
- —
No personal income docs; deal must DSCR.
Hard money
10% down · 12.0% · 12mo
- Down + closing
- —
- Monthly P&I
- —
- Monthly cashflow
- —
- DSCR
- —
- Eligible?
- —
Short-term bridge; refi at stabilization.
Rent comps 15 comps
| Address | Beds | Baths | Sqft | Rent | $/sqft | DOM | Units | Dist |
|---|---|---|---|---|---|---|---|---|
| 3212 Pecan St Laredo, TX | 3.0 | 1.5 | 966 | $1,100 | $1.14 | 45d | 1 | 0.17mi |
| 1419 Reagan Dr Laredo, TX | 3.0 | 2.0 | 884 | $1,500 | $1.70 | 45d | 1 | 0.43mi |
| 3411 Morelos Dr Laredo, TX | 3.0 | 2.0 | 1066 | $1,400 | $1.31 | 45d | 1 | 0.46mi |
| 2901 Thurman St Unit 11 Laredo, TX | 2.0 | 1.0 | 880 | $950 | $1.08 | 45d | 1 | 0.65mi |
| 2901 Thurman St Unit 10 Laredo, TX | 2.0 | 1.0 | 880 | $975 | $1.11 | 45d | 1 | 0.65mi |
| 2603 Palo Blanco St Unit 3 Laredo, TX | 2.0 | 1.0 | 900 | $780 | $0.87 | 45d | 1 | 0.67mi |
| 2603 Palo Blanco St Unit 9 Laredo, TX | 2.0 | 1.0 | 900 | $1,000 | $1.11 | 45d | 1 | 0.67mi |
| 2603 Palo Blanco St Unit 2 Laredo, TX | 2.0 | 1.0 | 900 | $850 | $0.94 | 45d | 1 | 0.67mi |
| 3201 S Ejido Ave Laredo, TX | 2.0 | 2.0 | 909 | $836 | $0.92 | 45d | 1 | 0.69mi |
| 2803 Bayard St #6 Laredo, TX | 2.0 | 1.5 | 960 | $1,200 | $1.25 | 45d | 1 | 0.79mi |
| 3508 Eduardo E Hayes Rd Laredo, TX | 3.0 | 2.5 | 1820 | $2,100 | $1.15 | 45d | 1 | 0.94mi |
| 3310 S Louisiana Ave Unit 3 Laredo, TX | 3.0 | 1.0 | 927 | $1,100 | $1.19 | 45d | 1 | 0.96mi |
| 2005 Cross St Unit 2 Laredo, TX | 2.0 | 1.5 | 988 | $995 | $1.01 | 45d | 1 | 1.10mi |
| 4305 Alina Dr Laredo, TX | 3.0 | 2.5 | 1736 | $1,850 | $1.07 | 45d | 1 | 1.43mi |
| 1021 Savannah Loop Laredo, TX | 3.0 | 2.5 | 1096 | $1,650 | $1.51 | 46d | 1 | 1.48mi |
Listing history 9 events
-
2026-06-10days on market $79,000 Active 27 DOM
-
2026-06-08days on market $79,000 Active 26 DOM
-
2026-06-08days on market $79,000 Active 25 DOM
-
2026-06-07days on market $79,000 Active 24 DOM
-
2026-06-03days on market $79,000 Active 21 DOM
-
2026-06-02days on market $79,000 Active 20 DOM
-
2026-06-01days on market $79,000 Active 19 DOM
-
2026-05-31days on market $79,000 Active 18 DOM
-
2026-05-13$79,000 Active
ⓘ Source: listings_history table (triggers on properties + properties_extension) + one-shot
backfill from property_details.listing_events for pre-trigger history.
Climate risk First Street
- Flood 1/10 Low FEMA zone X (unshaded) · 0% chance over 30 yrs
- Wildfire 5/10 Major
- Heat 9/10 Extreme 7 d/yr ≥110°F today · 23 d/yr by 30 yrs out
- Wind 8/10 Severe 80% chance of damaging wind over 30 yrs
- Air quality 1/10 Low 0 unhealthy d/yr today · 0 by 30 yrs out
Nearby sold comps map
Loading sold comps map…
Walkable amenities ~0.75 mi
Loading nearby amenities…
Taxation est. · year 1
- Rental income
- $14,296
- − Mortgage interest
- −$4,425
- − Property taxes
- −$1,185
- − Insurance
- −$395
- − Repairs & maintenance
- −$1,144
- − Management
- −$1,144
- − Depreciation
- −$2,298
- Taxable income
- $3,705
- Est. tax owed @ 24.0%
- −$889
- After-tax cash flow
- $3,853/yr
For passive investors: Depreciation is non-cash, so a rental often shows a tax loss while cash-flowing — sheltering income. Rental losses are passive: they offset passive income freely, and up to $25,000/yr can offset ordinary (W-2) income if you actively participate and your MAGI is under $100k (phasing out to $0 by $150k); unused losses carry forward. On sale, claimed depreciation is recaptured at up to 25%, and gains may owe capital-gains tax (a 1031 exchange can defer both). Figures are a year-1 estimate at your 24.0% rate — not tax advice; consult a CPA.
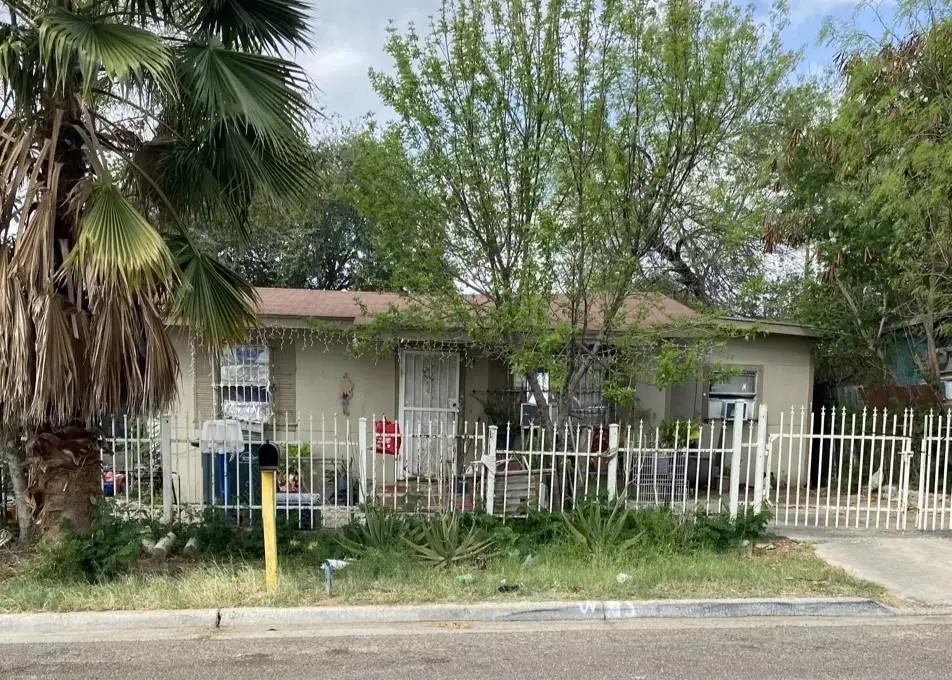
Condition & rehab AI · 10 photos
This property requires moderate renovations, including repairs to the fencing, roof, and landscaping, to improve its condition and value.
Repairs flagged
- Major fencing — Significant rust and damage
- Major landscaping — Overgrown and unkempt
- Major roof — Aged and weathered
Value-add opportunities
- Both paint exterior walls — Enhances curb appeal and value
- Both repair and replace fencing — Improves safety and aesthetics
- Both trim and maintain landscaping — Enhances curb appeal and value
Renovation cost estimate screening
| Repair item | Severity | Est. cost |
|---|---|---|
| fencing · Significant rust and damage | Major | $15,000–50,000 |
| landscaping · Overgrown and unkempt | Major | $15,000–50,000 |
| roof · Aged and weathered | Major | $15,000–50,000 |
| Total estimated repair cost · 3 items | $45,000–150,000 |
Value-add ROI direction
- Both paint exterior walls — Enhances curb appeal and value ↑
- Both repair and replace fencing — Improves safety and aesthetics ↑
- Both trim and maintain landscaping — Enhances curb appeal and value ↑
ⓘ Cost ranges are severity-bucket heuristics (US national rule-of-thumb). Get contractor quotes + a written scope before underwriting a rehab budget.
Schools (NCES district)
- District
- Laredo ISD
- NCES district ID
- 4826790
- Math proficiency
- 21% ▼ -34.00%
- Reading proficiency
- 29% ▼ -13.00%
- Median HH income
- $25,655
- Composite
- 19.7/100
- National rank
- #8724
- State rank
- #739 of 826 in TX
Livability — Laredo
- Score
- 73/100
- State rank
- #227
- US rank
- #5399
Category grades
Schools grade is shown separately in the Schools card above.
Census & demographics
- Census place
- Laredo, TX
- City population
- 67,333
- Population (ZIP)
- 71,965
Population outlook (Webb County) Hauer SSP2
- Today (2025)
- 301,387 people
- By 2030
- 316,307 · +5.0%
- By 2040
- 345,636 · +14.7%
- By 2050
- 370,647 · +23.0%
- By 2075
- 413,907 · +37.3%
- By 2100
- 416,458 · +38.2%
Race, ethnicity, and origin ACS 2023
- Neighborhood character
- Predominantly Hispanic (97%)
- Race & ethnicity
- Hispanic / Latino 97% Two or more races 53% White 2%
- Hispanic origin (detail)
- Mexican 92%
- Foreign-born
- 22% · Canada
- Languages at home
- 9% English-only · Spanish 91%
Political lean MEDSL · Webb
- 2024 margin
- Toss-up / Even · D 48.5% · R 50.7%
- 2008→2024 swing
- -45.6pp toward R · 2008: 43.4pp · 2024: -2.2pp
- All cycles
- 2024: R+2.2 2020: D+23.3 2016: D+51.6 2012: D+54.0 2008: D+43.4
Not yet ingested
- Civics
- —
Market trends
- HPI YoY
- ▼ -29.36%
- Current HPI
- 196.8153
- Rent YoY
- —
- Metro
- —
- State GDP YoY
- ▲ 3.95%
- F500 in state
- 110
Industry mix (Fortune 500 HQ in TX)
| Industry | F500 HQs | Revenue |
|---|---|---|
| Energy | 16 | $1,198B |
|
||
| Technology | 5 | $198B |
|
||
| Engineering / Construction | 4 | $72B |
|
||
| Energy Services | 3 | $60B |
|
||
| Utilities | 3 | $41B |
|
||
| Healthcare | 2 | $330B |
|
||
Price history
1 event — show timeline
- 2026-05-13 Listed $79,000 LAOR
Cash-flow waterfall
monthlySold comps — $/sqft
last 12 mo · ≤1 miLoading sold comps…