 Multi-family
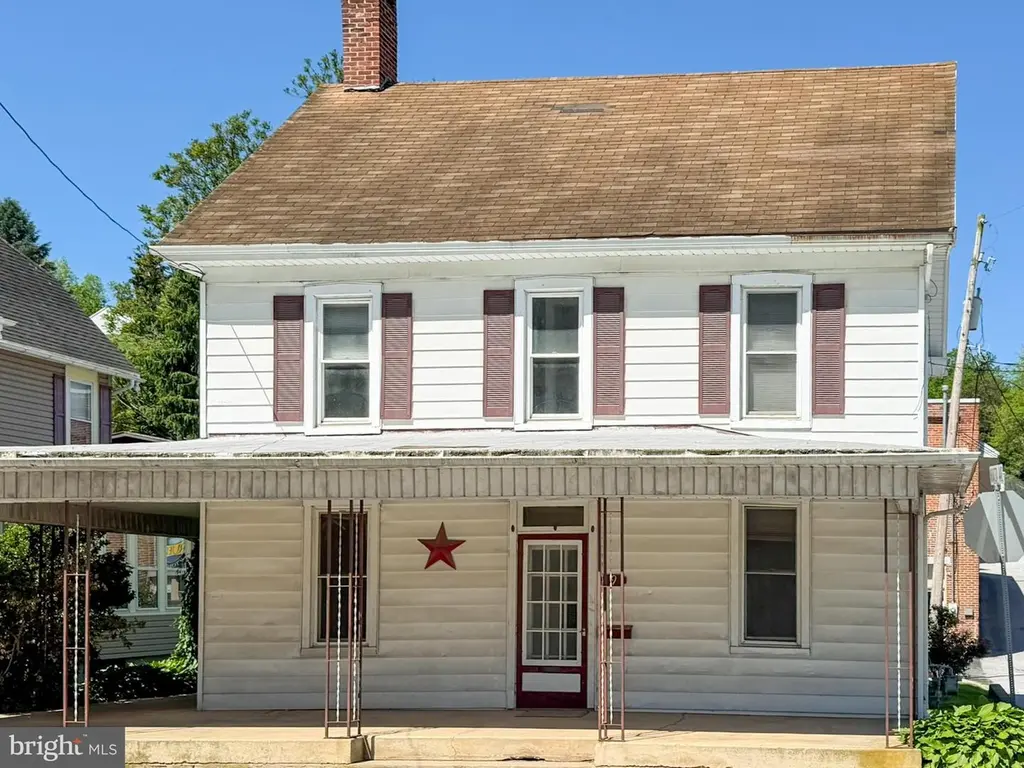
9 Manchester St · Glen Rock, PA
Flood risk 10/10 · Severe
- FEMA flood zone
- AE
- Chance of flooding over 30 yrs
- 0.99%
- Est. flood insurance / yr
- $2,026 – $9,024
Fire risk 3/10 · Minor
- Est. fire insurance / yr
- $511 – $949
Heat risk 5/10 · Moderate
- Hot days now (above 100°F)
- 7 days/yr
- Hot days in 30 yrs
- 16 days/yr
Wind risk 4/10 · Minor
- Chance of severe wind over 30 yrs
- 11.0%
Air-quality risk 3/10 · Minor
- Unhealthy air days now
- 2 days/yr
- Unhealthy air days in 30 yrs
- 4 days/yr
Risk factors via First Street. Map © Google.
Why this score? — see what drove the B grade
The composite is a weighted blend of 9 inputs, each scored 0–100. Each bar is that input's sub-score; the figure is the points it added to the 100-point composite (weight × sub-score).
- Cash flow +30.0/30.0
- 1% rule +10.0/10.0
- DSCR +10.0/10.0
- ARV discount +7.5/15.0
- Schools +4.3/10.0
- Livability +3.5/5.0
- Rent growth +2.5/5.0
- Condition / age +2.5/5.0
- Appreciation +0.0/10.0
$75,000
🖨 Deal sheet 📄 Offer letter ✓ Due diligence
Multi-family units
County records classify this as Multi-Family (2-4 Unit). Listing-text estimate: 1 unit. estimate disagrees with records
Listing remarks
INVESTOR ALERT! This spacious 2-1/2 story home is waiting for its new owner to bring it back to its former glory! Offering over 1900 s. f. of living area on the 2 floor, plus a finished attic, the potential is there for a 4-5 bedroom, 2 bath home in the heart of downtown Glen Rock! The wrap around front porch would give you a front row seat to enjoy the Glen Rock Carolers on Christmas Eve, and you are a very short walk or bike ride away from the Rail Trail! This home was formerly a 2-unit rental property, but current zoning requires a single family use. There is a newer gas boiler, with two-zone heat, and two electric meters. Sold strictly as-is; cash buyers only!
Key facts
- Finished attic
- Two zone heat
- Newer gas boiler
Tags
Property features AI
Finance
- Other: Fee simple ownership; Property condition noted as below average and major rehab needed; Located in a federal flood zone
Exterior
- Parking: On-street parking
- Utilities: Public water; Public sewer
- Home design: Detached structure
- Construction: Aluminum siding; Stone foundation; Asphalt and metal roof; Built year per assessor
- Exterior features: No tidal water
Interior
- Bedrooms: Main level bedroom: 1; First upper level bedrooms: 2; Second upper level bedrooms: 2
- Bathrooms: Main level full bathroom: 1; First upper level full bathroom: 1; Total full bathrooms: 2
- Heating & cooling: Hot water heating; Natural gas heating fuel; Natural gas hot water
- Interior features: Unfinished basement; Living area per assessor
Neighborhood map
What this means for you Summary
Snapshot
- This is a 4-bed/2.0-bath multifamily listed at $75k.
Deal economics
- At list price, monthly cash flow is $796 ($10k/yr) — positive.
- The deal already cash-flows at list — no discount required.
- Meets the 1% rule at list price ($2k rent vs $75k).
Location & tenants
- Location reads 70/100 on livability (#765 in PA) — a middle-class / working-renter tenant base. Strengths: crime A+, cost of living A+, housing A+; Watch: amenities F, commute F, employment D-.
- Southern York County SD (rural): math 39% / reading 58% proficiency, ranked #168 of 539 in PA (top 31%) — families likely to look elsewhere, expect single-tenant / working-renter base with shorter leases; only 18% free/reduced lunch — higher-income household profile.
- Market conditions: 43 active listings in the ZIP; 1,328 units permitted in York County in 2024 (338 in 5+ unit buildings).
Forward outlook
- Local home prices are declining (-3.0%/yr); year-one equity from $519 of loan paydown is wiped out by about $2k of value loss. Plan a longer hold.
- At projected returns (-3.0% appreciation + 3.0% rent growth), your $21k cash investment doubles in ~3 years — after that, you're playing with house money.
Negotiation context
- Only 13 days on market — expect competitive offers; lowballing is unlikely to land.
- Current owner paid $61k; 23% above their basis — modest negotiation headroom, anchor on the comps not their cost.
Risks & watch-outs
- Watch-outs: property tax is 3.3% of price; flood insurance adds $460/mo; built in 1880 — expect roof / HVAC / electrical / plumbing capex.
- Climate carrying-cost: in FEMA flood zone AE (mandatory federal flood insurance); extreme-heat days projected 7→16/yr by 2055 (HVAC capex compounding) — expect insurance premiums to compound above CPI over the hold.
Questions for the listing agent
- Built in 1880 — when were the roof, HVAC, electrical panel, plumbing, and water heater last replaced?
- Property tax is high relative to price — has the assessment been appealed recently, and will the sale trigger a re-assessment?
- What's the actual annual flood-insurance premium (NFIP or private), and is the property in a SFHA with mandatory coverage?
- Is there a deadline driving the sale (1031 exchange, divorce, estate, relocation)? That informs how much negotiation room exists.
- Schools are B-rated — typically a magnet for longer-tenancy family renters. What's the average tenant stay here, and is there a school-zone premium baked into asking?
- What's the average days-on-market for RENTAL listings here right now (not sales)? A rising rental-DOM trend means longer vacancies and softer asking-rent achievability than the comps imply.
- What's the recent tenant-quality profile in this submarket — average credit score on applications, eviction rate, late-payment / NSF rate, and stable-employment percentage? A property-management company in the area should have these aggregated.
- How much new apartment / multifamily construction is in the pipeline within 1–3 miles? Heavy new supply (>2% of stock underway) typically softens rents 12–24 months out; light construction supports rent growth.
Investment metrics
- 1% rule
- 3.19% ✓
- Cap rate
- 26.39%
- Cash-on-cash
- 71.77%
- DSCR
- 4.19
- GRM
- 2.6
CMA / ARV
No comps found within radius.
Projected returns pro-forma
-3.0% appreciation · 3.0% rent growth · sell at horizon
- IRR
- 42.9%
- Equity multiple
- 2.85×
- Total profit
- $38,904
- Equity at exit
- $11,183
- IRR
- 49.0%
- Equity multiple
- 5.80×
- Total profit
- $100,701
- Equity at exit
- $6,485
Cash invested: $21,000 (down + closing). Projections, not guarantees.
Landlord ↔ Tenant lean methodology
- Overall (STATE)
- 62 Landlord-Friendly
- State Pennsylvania
- 62 Landlord-Friendly · EVEN
- County
- — inherits STATE
- City
- — inherits STATE
ZIP-level market 17327
- Home prices YoY
- -4.9%
- Active inventory
- 43
- Price-to-rent
- 5.2×
Monthly cashflow live
- Estimated rent
- $2,390 medium interval (Pro) →
- Mortgage (P&I)
- −$393
- Tax from tax record
- −$208 /mo · $2,491/yr
- Insurance
- −$31
- Flood insurance flood zone
- −$460 /mo · $5,525/yr
- HOA
- −$0
- Vacancy / Maint / Mgmt
- −$502
- Net cashflow
- $796
Break-even live
2-unit breakdown (identical units grouped — click to expand)
| Units | Beds | Baths | Est. rent |
|---|---|---|---|
| 2× units | 2 | 1 | $2,390 |
| #1 | 2 | 1 | $1,195 |
| #2 | 2 | 1 | $1,195 |
| Total (2 units) | $2,390 | ||
UW: 25.0% down · 7.5% · 30yr · 1.5% tax · 5.0% vac · 8.0% maint · 8.0% mgmt
Financing live
Cash to close
- Down payment
- $18,750
- Closing costs
- $2,250
- Reserves months
- —
- Total cash needed
- —
Loan-product check · same deal, 3 products live
Conventional
25% down · 7.5% · 30yr
- Down + closing
- —
- Monthly P&I
- —
- Monthly cashflow
- —
- DSCR
- —
- Eligible?
- —
Personal DTI + credit; lowest rate.
DSCR
20% down · 8.5% · 30yr
- Down + closing
- —
- Monthly P&I
- —
- Monthly cashflow
- —
- DSCR
- —
- Eligible?
- —
No personal income docs; deal must DSCR.
Hard money
10% down · 12.0% · 12mo
- Down + closing
- —
- Monthly P&I
- —
- Monthly cashflow
- —
- DSCR
- —
- Eligible?
- —
Short-term bridge; refi at stabilization.
Listing history 11 events
-
2026-06-13pricestatusdays on market $75,000 Pending 13 DOM
-
2026-06-10days on market $89,900 Active 12 DOM
-
2026-06-09days on market $89,900 Active 11 DOM
-
2026-06-08days on market $89,900 Active 10 DOM
-
2026-06-07days on market $89,900 Active 9 DOM
-
2026-06-03days on market $89,900 Active 5 DOM
-
2026-06-02days on market $89,900 Active 4 DOM
-
2026-06-01days on market $89,900 Active 3 DOM
-
2026-05-31days on market $89,900 Active 2 DOM
-
2026-05-30remarks 678-char remark
-
2026-05-30$89,900 Active 1 DOM
ⓘ Source: listings_history table (triggers on properties + properties_extension) + one-shot
backfill from property_details.listing_events for pre-trigger history.
Tax reassessment forecast PA · Partial reset (capped growth)
- Current annual tax
- $2,491 · $208/mo
- Projected year-2 tax
- $2,491 · $208/mo
- Expected delta
- $0/yr ($0/mo · 0.0%)
ⓘ Screening estimate from a state-policy table — verify with the county assessor before closing.
Climate risk First Street
- Flood 10/10 Extreme FEMA zone AE · 99% chance over 30 yrs
- Wildfire 3/10 Moderate
- Heat 5/10 Major 7 d/yr ≥100°F today · 16 d/yr by 30 yrs out
- Wind 4/10 Moderate 11% chance of damaging wind over 30 yrs
- Air quality 3/10 Moderate 2 unhealthy d/yr today · 4 by 30 yrs out
Nearby sold comps map
Loading sold comps map…
Walkable amenities ~0.75 mi
Loading nearby amenities…
Taxation est. · year 1
- Rental income
- $28,680
- − Mortgage interest
- −$4,201
- − Property taxes
- −$2,491
- − Insurance
- −$5,900
- − Repairs & maintenance
- −$2,294
- − Management
- −$2,294
- − Depreciation
- −$2,182
- Taxable income
- $9,317
- Est. tax owed @ 24.0%
- −$2,236
- After-tax cash flow
- $7,310/yr
For passive investors: Depreciation is non-cash, so a rental often shows a tax loss while cash-flowing — sheltering income. Rental losses are passive: they offset passive income freely, and up to $25,000/yr can offset ordinary (W-2) income if you actively participate and your MAGI is under $100k (phasing out to $0 by $150k); unused losses carry forward. On sale, claimed depreciation is recaptured at up to 25%, and gains may owe capital-gains tax (a 1031 exchange can defer both). Figures are a year-1 estimate at your 24.0% rate — not tax advice; consult a CPA.
Schools (NCES district)
- District
- Southern York County SD
- NCES district ID
- 4222380
- Math proficiency
- 39% ▼ -15.00%
- Reading proficiency
- 58% ▼ -15.00%
- Median HH income
- $70,881
- Composite
- 43.46/100
- National rank
- #3005
- State rank
- #168 of 539 in PA
Livability — Glen Rock
- Score
- 70/100
- State rank
- #765
- US rank
- #7663
Category grades
Schools grade is shown separately in the Schools card above.
Census & demographics
- Census place
- Glen Rock, PA
- Population (ZIP)
- 8,228
Population outlook (York County) Hauer SSP2
- Today (2025)
- 454,205 people
- By 2030
- 457,407 · +0.7%
- By 2040
- 457,529 · +0.7%
- By 2050
- 448,261 · -1.3%
- By 2075
- 427,388 · -5.9%
- By 2100
- 384,218 · -15.4%
Race, ethnicity, and origin ACS 2023
- Neighborhood character
- Predominantly White (92%)
- Race & ethnicity
- White 92% Two or more races 6% Hispanic / Latino 5%
- Common ancestry
- Lithuanian 2% Slovak 2% Romanian 2%
- Foreign-born
- 2% · Canada
- Languages at home
- 97% English-only · Spanish 1% Tagalog/Filipino 1% Other Indo-European 1%
Political lean MEDSL · York
- 2024 margin
- Strong R (+25.3) · D 36.9% · R 62.1%
- 2008→2024 swing
- -11.7pp toward R · 2008: -13.6pp · 2024: -25.3pp
- All cycles
- 2024: R+25.3 2020: R+24.6 2016: R+29.3 2012: R+21.2 2008: R+13.6
Not yet ingested
- Civics
- —
Market trends
- HPI YoY
- ▼ -13.22%
- Current HPI
- 257.102
- Rent YoY
- —
- Metro
- —
- State GDP YoY
- ▲ 1.68%
- F500 in state
- 34
Industry mix (Fortune 500 HQ in PA)
| Industry | F500 HQs | Revenue |
|---|---|---|
| Healthcare | 2 | $309B |
|
||
| Insurance | 2 | $27B |
|
||
| Telecommunications / Media | 1 | $124B |
|
||
| Industrial Distribution | 1 | $22B |
|
||
| Financial Services | 1 | $20B |
|
||
| Chemicals / Materials | 1 | $18B |
|
||
Price history
+266.9% since first listed3 events — show timeline
- 2026-05-29 Listed $89,900 BRIGHT MLS
- 1989-05-25 Sold (Public Records) $61,000 Public Records
- 1986-10-17 Sold (Public Records) $24,500 Public Records
Property tax history
+1.5%/yrLatest (2025): $2,491 · +0.0% YoY. Source: county tax records.
Cash-flow waterfall
monthlySold comps — $/sqft
last 12 mo · ≤1 miLoading sold comps…