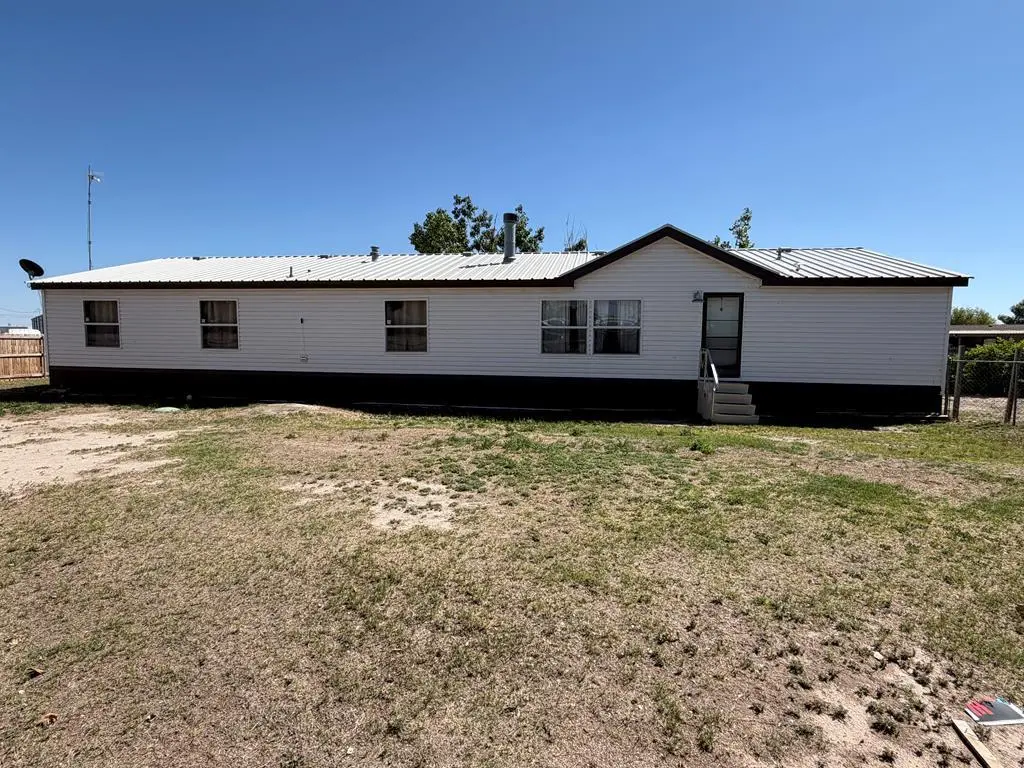
3700 S County Rd 1313 Ridgewood Edition · Odessa, TX
Flood risk 7/10 · Major
- FEMA flood zone
- A
- Chance of flooding over 30 yrs
- 0.76%
- Est. flood insurance / yr
- $1,009 – $1,996
Fire risk 7/10 · Major
- Est. fire insurance / yr
- $1,222 – $2,270
Heat risk 5/10 · Moderate
- Hot days now (above 101°F)
- 6 days/yr
- Hot days in 30 yrs
- 19 days/yr
Wind risk 2/10 · Minimal
- Chance of severe wind over 30 yrs
- 3.0%
Air-quality risk 1/10 · Minimal
- Unhealthy air days now
- 0 days/yr
- Unhealthy air days in 30 yrs
- 0 days/yr
Risk factors via First Street. Map © Google.
Why this score? — see what drove the B grade
The composite is a weighted blend of 9 inputs, each scored 0–100. Each bar is that input's sub-score; the figure is the points it added to the 100-point composite (weight × sub-score).
- Cash flow +30.0/30.0
- ARV discount +15.0/15.0
- DSCR +10.0/10.0
- 1% rule +7.8/10.0
- Livability +3.8/5.0
- Schools +3.2/10.0
- Rent growth +2.6/5.0
- Condition / age +2.5/5.0
- Appreciation +0.0/10.0
$225,000
🖨 Deal sheet 📄 Offer letter ✓ Due diligence
Listing remarks
Awesome opportunity to own it all at once. The owner wants to walk away with only his RV and personal items. Everything else stays in this 2300+ sq ft. . home. It has 4 bdrm, 3 bath, 2 living areas. -with a fireplace in one. The price is for a quick sale.
Key facts
- 0.36 acre lot
- 2 parking spots
- Built 1998
Property features AI
Exterior
- Parking: Two total parking spaces; Two covered spaces; Carport
- Security: Owned security system; Smoke detectors
- Utilities: Private well water; Septic tank sewer; Propane for utilities
- Home design: Double-wide manufactured home; Single-family residence; Residential property
- Construction: Metal roof; Pillar/post/pier foundation
- Exterior features: Landscaped grounds; Paved road access; County road frontage; Solar system; Storage building; Workshop
Interior
- Kitchen: Gas range; Microwave; Dishwasher; Refrigerator; Electric water heater
- Flooring: Carpet; Vinyl
- Bathrooms: Three full bathrooms
- Heating & cooling: Central heating (natural gas); Central electric air conditioning; Thermostat
- Interior features: Pantry; Built-in bookcases; Drapes and blinds; Wood-burning fireplace; Security system (owned); Smoke detectors
- Laundry & utility: Water heater
Neighborhood map
What this means for you Summary
Snapshot
- This is a 4-bed/3.0-bath manufactured listed at $225k.
Deal economics
- At list price, monthly cash flow is $839 ($10k/yr) — positive.
- The deal already cash-flows at list — no discount required.
- Meets the 1% rule at list price ($3k rent vs $225k).
- Recommended offer: $218k (3.0% below list) — sets the bar for market timing.
Location & tenants
- Location reads 75/100 on livability (#132 in TX, #3,928 nationally) — a middle-class / working-renter tenant base. Strengths: cost of living A+, housing A+, health & safety A+; Watch: commute D+, amenities D.
- Midland ISD (urban): math 34% / reading 36% proficiency, ranked #477 of 826 in TX (top 58%) — families likely to look elsewhere, expect single-tenant / working-renter base with shorter leases.
- Zoned schools: Barbara Fasken El (math 45% / reading 43%, grade F, #1,243 of 4,322 statewide, top 29%, 886 students, 46% FRL); Alamo J H (math 23% / reading 32%, grade F, #1,156 of 1,662 statewide, top 71%, 865 students, 62% FRL); Midland H S (math 37% / reading 7%, grade F, #1,366 of 1,632 statewide, top 84%, 2,492 students, 44% FRL) — zoned schools at 51% FRL track the district average.
- Market conditions: Rents flat; 431 active listings in the ZIP; 7 comparable units currently listed for rent nearby; rentals lingering (median 44d on market — plan ~5-8 weeks vacancy on turnover, expect pricing pressure); 86% of comp listings sitting > 30 days — soft ceiling on asking rent; solid renter incomes; 1,504 units permitted in Midland County in 2024 (0 in 5+ unit buildings).
- This rent runs 33% of the median local income ($105k/yr) — at the standard rent-burdened threshold; future hikes will face affordability resistance.
Forward outlook
- Local home prices are declining (-3.0%/yr); year-one equity from $2k of loan paydown is wiped out by about $7k of value loss. Plan a longer hold.
- Midland County population projected at +83% by 2050 — long-run rental-demand tailwind backs the buy-and-hold thesis.
- At projected returns (-3.0% appreciation + 0.5% rent growth), your $63k cash investment doubles in ~10 years — after that, you're playing with house money.
Negotiation context
- It's been on market 38 days — a 3% lower offer ($218k) is reasonable based on typical stale-listing flexibility.
Risks & watch-outs
- Watch-outs: flood insurance adds $125/mo.
- Climate carrying-cost: in FEMA flood zone A (mandatory federal flood insurance); major wildfire risk; extreme-heat days projected 6→19/yr by 2055 (HVAC capex compounding) — expect insurance premiums to compound above CPI over the hold.
Questions for the listing agent
- It's been on market 38 days. Have you received any prior offers? Is the seller open to a 3% concession, seller financing, or rate buy-down credit?
- What's the actual annual flood-insurance premium (NFIP or private), and is the property in a SFHA with mandatory coverage?
- Is there a deadline driving the sale (1031 exchange, divorce, estate, relocation)? That informs how much negotiation room exists.
- Schools are F-rated, which usually means shorter tenancies and higher turnover. Who's the typical renter profile here, and what's been the actual vacancy rate?
- What's the average days-on-market for RENTAL listings here right now (not sales)? A rising rental-DOM trend means longer vacancies and softer asking-rent achievability than the comps imply.
- What's the recent tenant-quality profile in this submarket — average credit score on applications, eviction rate, late-payment / NSF rate, and stable-employment percentage? A property-management company in the area should have these aggregated.
- How much new for-sale + rental construction is in the pipeline within 1–3 miles? Heavy new supply typically softens prices + rents 12–24 months out; constrained supply supports both.
Investment metrics
- 1% rule
- 1.28% ✓
- Cap rate
- 11.44%
- Cash-on-cash
- 18.37%
- DSCR
- 1.82
- GRM
- 6.5
CMA / ARV
- ARV (median comp)
- $369,551
- List price
- $225,000
- Delta
- -39.12%
- Verdict
- UNDERPRICED
- Comps
- 2 within 2.0 mi
Projected returns pro-forma
-3.0% appreciation · 0.54% rent growth · sell at horizon
- IRR
- 4.2%
- Equity multiple
- 1.16×
- Total profit
- $9,991
- Equity at exit
- $33,548
- IRR
- 11.4%
- Equity multiple
- 1.80×
- Total profit
- $50,183
- Equity at exit
- $19,454
Cash invested: $63,000 (down + closing). Projections, not guarantees.
Landlord ↔ Tenant lean methodology
- Overall (STATE)
- 87 Strongly Landlord-Friendly
- State Texas
- 87 Strongly Landlord-Friendly · R+5
- County
- — inherits STATE
- City
- — inherits STATE
ZIP-level market 79765
- Home prices YoY
- -28.7%
- Rents YoY
- 0.5%
- Active inventory
- 431
- Price-to-rent
- 6.5×
Monthly cashflow live
- Estimated rent
- $2,886 high interval (Pro) →
- Mortgage (P&I)
- −$1,180
- Tax from tax record
- −$42 /mo · $501/yr
- Insurance
- −$94
- Flood insurance flood zone
- −$125 /mo · $1,502/yr
- HOA
- −$0
- Vacancy / Maint / Mgmt
- −$606
- Net cashflow
- $839
Break-even live
UW: 25.0% down · 7.5% · 30yr · 1.5% tax · 5.0% vac · 8.0% maint · 8.0% mgmt
Financing live
Cash to close
- Down payment
- $56,250
- Closing costs
- $6,750
- Reserves months
- —
- Total cash needed
- —
Loan-product check · same deal, 3 products live
Conventional
25% down · 7.5% · 30yr
- Down + closing
- —
- Monthly P&I
- —
- Monthly cashflow
- —
- DSCR
- —
- Eligible?
- —
Personal DTI + credit; lowest rate.
DSCR
20% down · 8.5% · 30yr
- Down + closing
- —
- Monthly P&I
- —
- Monthly cashflow
- —
- DSCR
- —
- Eligible?
- —
No personal income docs; deal must DSCR.
Hard money
10% down · 12.0% · 12mo
- Down + closing
- —
- Monthly P&I
- —
- Monthly cashflow
- —
- DSCR
- —
- Eligible?
- —
Short-term bridge; refi at stabilization.
Rent comps 7 comps
| Address | Beds | Baths | Sqft | Rent | $/sqft | DOM | Units | Dist |
|---|---|---|---|---|---|---|---|---|
| 3611 El Cajon Ave Odessa, TX | 4.0 | 2.0 | 2038 | $3,800 | $1.86 | 44d | 1 | 1.22mi |
| 7309 Bellini St Odessa, TX | 4.0 | 2.0 | 2005 | $3,000 | $1.50 | 44d | 1 | 1.33mi |
| 7309 Raphael St Odessa, TX | 3.0 | 2.0 | 1824 | $3,500 | $1.92 | 21d | 1 | 1.36mi |
| 1207 Old Course Rd Odessa, TX | 4.0 | 2.5 | 2067 | $2,450 | $1.19 | 44d | 1 | 1.45mi |
| 1205 Old Course Rd Odessa, TX | 3.0 | 2.5 | 1731 | $2,100 | $1.21 | 44d | 1 | 1.46mi |
| 7204 Donatello St Odessa, TX | 3.0 | 2.0 | 1748 | $2,400 | $1.37 | 44d | 1 | 1.47mi |
| 7206 Raphael St Odessa, TX | 3.0 | 2.0 | 1743 | $2,800 | $1.61 | 44d | 1 | 1.49mi |
Listing history 18 events
-
2026-06-19days on market $225,000 Active 38 DOM
-
2026-06-18days on market $225,000 Active 37 DOM
-
2026-06-17days on market $225,000 Active 36 DOM
-
2026-06-16days on market $225,000 Active 35 DOM
-
2026-06-15days on market $225,000 Active 34 DOM
-
2026-06-14days on market $225,000 Active 32 DOM
-
2026-06-13days on market $225,000 Active 31 DOM
-
2026-06-10days on market $225,000 Active 29 DOM
-
2026-06-09days on market $225,000 Active 28 DOM
-
2026-06-08days on market $225,000 Active 27 DOM
-
2026-06-07days on market $225,000 Active 26 DOM
-
2026-06-03days on market $225,000 Active 22 DOM
-
2026-06-02days on market $225,000 Active 21 DOM
-
2026-06-01days on market $225,000 Active 20 DOM
-
2026-05-31days on market $225,000 Active 19 DOM
-
2026-05-30days on market $225,000 Active 18 DOM
-
2026-05-13$225,000 Active 255-char remark
-
1995-02-15soldstatus
ⓘ Source: listings_history table (triggers on properties + properties_extension) + one-shot
backfill from property_details.listing_events for pre-trigger history.
Tax reassessment forecast TX · Resets to sale price
- Current annual tax
- $501 · $42/mo
- Projected year-2 tax
- $4,118 · $343/mo
- Expected delta
- +$3,617/yr (+$301/mo · 722.2%)
ⓘ Screening estimate from a state-policy table — verify with the county assessor before closing.
Climate risk First Street
- Flood 7/10 Severe FEMA zone A · 76% chance over 30 yrs
- Wildfire 7/10 Severe
- Heat 5/10 Major 6 d/yr ≥101°F today · 19 d/yr by 30 yrs out
- Wind 2/10 Low 3% chance of damaging wind over 30 yrs
- Air quality 1/10 Low 0 unhealthy d/yr today · 0 by 30 yrs out
Nearby sold comps map
Loading sold comps map…
Walkable amenities ~0.75 mi
Loading nearby amenities…
Taxation est. · year 1
- Rental income
- $34,630
- − Mortgage interest
- −$12,603
- − Property taxes
- −$501
- − Insurance
- −$2,628
- − Repairs & maintenance
- −$2,770
- − Management
- −$2,770
- − Depreciation
- −$6,545
- Taxable income
- $6,812
- Est. tax owed @ 24.0%
- −$1,635
- After-tax cash flow
- $8,436/yr
For passive investors: Depreciation is non-cash, so a rental often shows a tax loss while cash-flowing — sheltering income. Rental losses are passive: they offset passive income freely, and up to $25,000/yr can offset ordinary (W-2) income if you actively participate and your MAGI is under $100k (phasing out to $0 by $150k); unused losses carry forward. On sale, claimed depreciation is recaptured at up to 25%, and gains may owe capital-gains tax (a 1031 exchange can defer both). Figures are a year-1 estimate at your 24.0% rate — not tax advice; consult a CPA.
Schools (NCES district)
- District
- Midland ISD
- NCES district ID
- 4830570
- Math proficiency
- 34% ▼ -7.00%
- Reading proficiency
- 36% ▬ 0.00%
- Median HH income
- $63,457
- Composite
- 31.63/100
- National rank
- #5938
- State rank
- #477 of 826 in TX
Livability — Odessa
- Score
- 75/100
- State rank
- #132
- US rank
- #3928
Category grades
Schools grade is shown separately in the Schools card above.
Census & demographics
- County
- Ector County · 131,169 people
- City population
- 131,169
- Metro
- Odessa, TX
- Population (ZIP)
- 25,904
- Household income
- $104,965
- Rent vs Own
- Severe rent burden
- 884.0
Population outlook (Midland County) Hauer SSP2
- Today (2025)
- 220,895 people
- By 2030
- 253,667 · +14.8%
- By 2040
- 325,498 · +47.4%
- By 2050
- 404,168 · +83.0%
- By 2075
- 609,802 · +176.1%
- By 2100
- 760,172 · +244.1%
Race, ethnicity, and origin ACS 2023
- Neighborhood character
- Diverse neighborhood (Simpson 0.59)
- Race & ethnicity
- Hispanic / Latino 49% White 41% Two or more races 15% Black 5% Asian 3% Native American 1%
- Hispanic origin (detail)
- Mexican 45%
- Common ancestry
- Romanian 1% Slovak 1% Lithuanian 1%
- Foreign-born
- 10% · Canada, China, South Korea
- Languages at home
- 63% English-only · Spanish 31% German/W. Germanic 1% Tagalog/Filipino 1%
Political lean MEDSL · Midland
- 2024 margin
- Solid R (+60.5) · D 19.3% · R 79.8%
- 2008→2024 swing
- -3.3pp toward R · 2008: -57.3pp · 2024: -60.5pp
- All cycles
- 2024: R+60.5 2020: R+56.6 2016: R+55.2 2012: R+61.5 2008: R+57.3
Not yet ingested
- Civics
- —
Market trends
- HPI YoY
- ▼ -69.68%
- Current HPI
- 173.4252
- Rent YoY
- ▲ 0.54%
- Metro
- Odessa, TX
- State GDP YoY
- ▲ 3.95%
- F500 in state
- 110
Industry mix (Fortune 500 HQ in TX)
| Industry | F500 HQs | Revenue |
|---|---|---|
| Energy | 16 | $1,198B |
|
||
| Technology | 5 | $198B |
|
||
| Engineering / Construction | 4 | $72B |
|
||
| Energy Services | 3 | $60B |
|
||
| Utilities | 3 | $41B |
|
||
| Healthcare | 2 | $330B |
|
||
Price history
2 events — show timeline
- 2026-05-13 Listed $225,000 ODMLS
- 1995-02-15 Sold (Public Records) — Public Records
Property tax history
-7.2%/yrLatest (2025): $501 · -2.7% YoY. Source: county tax records.
Cash-flow waterfall
monthlySold comps — $/sqft
last 12 mo · ≤1 miLoading sold comps…