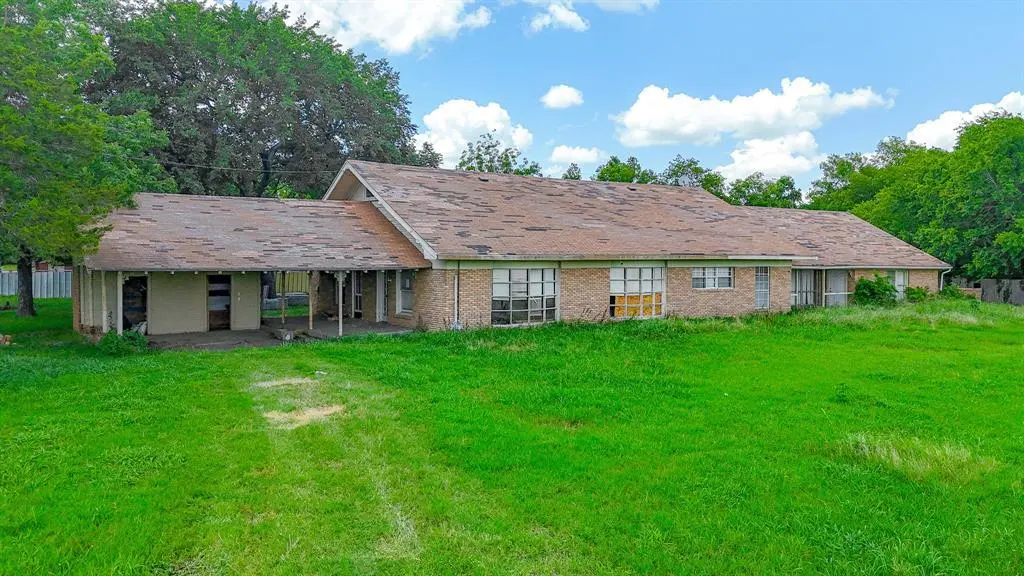
604 W Main St · Richland, TX
Flood risk 1/10 · Minimal
- FEMA flood zone
- X (unshaded)
- Chance of flooding over 30 yrs
- 0.0%
- Est. flood insurance / yr
- $507 – $1,088
Fire risk 4/10 · Minor
- Est. fire insurance / yr
- $1,222 – $2,270
Heat risk 7/10 · Major
- Hot days now (above 109°F)
- 7 days/yr
- Hot days in 30 yrs
- 25 days/yr
Wind risk 7/10 · Major
- Chance of severe wind over 30 yrs
- 78.0%
Air-quality risk 1/10 · Minimal
- Unhealthy air days now
- 0 days/yr
- Unhealthy air days in 30 yrs
- 0 days/yr
Risk factors via First Street. Map © Google.
Why this score? — see what drove the C- grade
The composite is a weighted blend of 9 inputs, each scored 0–100. Each bar is that input's sub-score; the figure is the points it added to the 100-point composite (weight × sub-score).
- Cash flow +16.0/30.0
- ARV discount +7.5/15.0
- Appreciation +6.8/10.0
- DSCR +5.0/10.0
- 1% rule +4.7/10.0
- Schools +3.2/10.0
- Livability +3.0/5.0
- Rent growth +2.5/5.0
- Condition / age +2.5/5.0
$147,500
🖨 Deal sheet (PDF) 📄 Offer letter ✓ Due diligence
Listing remarks MLS
Opportunity awaits in Richland! This home offers over 3,000 square feet of space and sits on nearly an acre, providing tons of potential for the right buyer. The property needs significant work and is being sold as-is, making it a great opportunity for investors or anyone looking to take on a renovation project. With plenty of room to reimagine inside and out, this is your chance to create something special.
Key facts
- 0.9 acre lot
- 2 parking spots
- Built 1978
Neighborhood map
What this means for you Summary
Snapshot
- This is a 3-bed/2.0-bath single-family listed at $148k.
Deal economics
- At list price, monthly cash flow is $74 ($890/yr) — positive.
- The deal already cash-flows at list — no discount required.
- To meet the 1% rule (rent ≥ 1% of price), the offer needs to be $143k (2.9% below list).
- Recommended offer: $130k (12.0% below list) — sets the bar for market timing.
Location & tenants
- Location reads 59/100 on livability (#1,106 in TX) — a working-class tenant base; expect higher turnover. Strengths: cost of living A+, housing A+, employment A-; Watch: crime F, amenities F, commute F.
- Corsicana ISD (town): math 39% / reading 37% proficiency, ranked #471 of 826 in TX (top 57%) — families likely to look elsewhere, expect single-tenant / working-renter base with shorter leases; 65% free/reduced lunch — lower-income household profile, screen leases tightly.
- Zoned schools: Jose Antonio Navarro El (math 24% / reading 24%, grade F, #3,221 of 4,322 statewide, top 75%, 621 students, 90% FRL); Corsicana Middle (math 35% / reading 43%, grade F, #690 of 1,662 statewide, top 42%, 928 students, 76% FRL); Corsicana H S (math 42% / reading 47%, grade F, #652 of 1,632 statewide, top 43%, 1,805 students, 73% FRL).
- Market conditions: 34 active listings in the ZIP; 522 units permitted in Navarro County in 2024 (0 in 5+ unit buildings).
Forward outlook
- In year one you build about $6k of equity ($1k loan paydown + $5k appreciation (3.7% local appreciation)).
- Navarro County population projected to shrink 4% by 2050 — rents likely to lag national; underwrite the cash flow, not the appreciation.
- At projected returns (3.7% appreciation + 3.0% rent growth), your $41k cash investment doubles in ~5 years — after that, you're playing with house money.
- By year 6, paydown + projected appreciation supports a ~$34k cash-out refi (75% LTV) — recoverable capital for the next deal without selling this one.
Negotiation context
- It's been on market 213 days — a 12% lower offer ($130k) is reasonable based on typical stale-listing flexibility.
- 6 sale attempts since 17y ago with the ask held roughly flat each time — persistent listings suggest the price (not the market) is what's stuck; bring a comps-based counter.
Risks & watch-outs
- Climate carrying-cost: major wind risk, 78% chance of damaging wind over 30y; extreme-heat days projected 7→25/yr by 2055 (HVAC capex compounding) — expect insurance premiums to compound above CPI over the hold.
Questions for the listing agent
- It's been on market 213 days. Have you received any prior offers? Is the seller open to a 12% concession, seller financing, or rate buy-down credit?
- Built in 1978 — when were the roof, HVAC, electrical panel, plumbing, and water heater last replaced?
- Why hasn't it sold? Are there any deal-killer items the seller is aware of (foundation, flood, title, zoning, code violations)?
- Is there a deadline driving the sale (1031 exchange, divorce, estate, relocation)? That informs how much negotiation room exists.
- Schools are F-rated, which usually means shorter tenancies and higher turnover. Who's the typical renter profile here, and what's been the actual vacancy rate?
- Crime grade is F in this area — have there been break-ins, vandalism, or insurance claims at this property in the last 3 years? What carrier currently insures it and at what premium?
- What's the average days-on-market for RENTAL listings here right now (not sales)? A rising rental-DOM trend means longer vacancies and softer asking-rent achievability than the comps imply.
- What's the recent tenant-quality profile in this submarket — average credit score on applications, eviction rate, late-payment / NSF rate, and stable-employment percentage? A property-management company in the area should have these aggregated.
- How much new for-sale + rental construction is in the pipeline within 1–3 miles? Heavy new supply typically softens prices + rents 12–24 months out; constrained supply supports both.
Investment metrics
- 1% rule
- 0.97% ✗
- Cap rate
- 6.90%
- Cash-on-cash
- 2.15%
- DSCR
- 1.10
- GRM
- 8.6
CMA / ARV
No comps found within radius.
Projected returns pro-forma
3.7% appreciation · 3.0% rent growth · sell at horizon
- IRR
- 11.4%
- Equity multiple
- 1.68×
- Total profit
- $28,060
- Equity at exit
- $72,199
- IRR
- 13.2%
- Equity multiple
- 3.10×
- Total profit
- $86,719
- Equity at exit
- $116,069
Cash invested: $41,300 (down + closing). Projections, not guarantees.
Landlord ↔ Tenant lean methodology
- Overall (STATE)
- 87 Strongly Landlord-Friendly
- State Texas
- 87 Strongly Landlord-Friendly · R+5
- County
- — inherits STATE
- City
- — inherits STATE
ZIP-level market 76681
- Home prices YoY
- 3.5%
- Active inventory
- 34
- Price-to-rent
- 8.6×
Monthly cashflow live
- Estimated rent
- $1,432 medium interval (Pro) →
- Mortgage (P&I)
- −$774
- Tax from tax record
- −$222 /mo · $2,662/yr
- Insurance
- −$61
- HOA
- −$0
- Vacancy / Maint / Mgmt
- −$301
- Net cashflow
- $74
Break-even live
Sensitivity live
| Price | -10% $158 | -5% $116 | +0% $74 | +5% $32 | +10% $-9 |
|---|---|---|---|---|---|
| Rent | -10% $-39 | -5% $18 | +0% $74 | +5% $131 | +10% $187 |
| Rate | -1.0pp $148 | -0.5pp $112 | base $74 | +0.5pp $36 | +1.0pp $-3 |
UW: 25.0% down · 7.5% · 30yr · 1.5% tax · 5.0% vac · 8.0% maint · 8.0% mgmt
Financing live
Cash to close
- Down payment
- $36,875
- Closing costs
- $4,425
- Reserves months
- —
- Total cash needed
- —
Loan-product check · same deal, 3 products live
Conventional
25% down · 7.5% · 30yr
- Down + closing
- —
- Monthly P&I
- —
- Monthly cashflow
- —
- DSCR
- —
- Eligible?
- —
Personal DTI + credit; lowest rate.
DSCR
20% down · 8.5% · 30yr
- Down + closing
- —
- Monthly P&I
- —
- Monthly cashflow
- —
- DSCR
- —
- Eligible?
- —
No personal income docs; deal must DSCR.
Hard money
10% down · 12.0% · 12mo
- Down + closing
- —
- Monthly P&I
- —
- Monthly cashflow
- —
- DSCR
- —
- Eligible?
- —
Short-term bridge; refi at stabilization.
Listing history 36 events
-
2026-06-21days on market $147,500 Active 213 DOM
-
2026-06-19days on market $147,500 Active 211 DOM
-
2026-06-18days on market $147,500 Active 210 DOM
-
2026-06-17days on market $147,500 Active 209 DOM
-
2026-06-16days on market $147,500 Active 208 DOM
-
2026-06-15days on market $147,500 Active 207 DOM
-
2026-06-14days on market $147,500 Active 205 DOM
-
2026-06-12days on market $147,500 Active 204 DOM
-
2026-06-09days on market $147,500 Active 201 DOM
-
2026-06-08days on market $147,500 Active 200 DOM
-
2026-06-07days on market $147,500 Active 199 DOM
-
2026-06-02days on market $147,500 Active 194 DOM
-
2026-06-01days on market $147,500 Active 193 DOM
-
2026-05-31days on market $147,500 Active 192 DOM
-
2026-05-30days on market $147,500 Active 191 DOM
-
2026-02-16price $147,500 411-char remark
Show marketing remark (411 chars)
Opportunity awaits in Richland! This home offers over 3,000 square feet of space and sits on nearly an acre, providing tons of potential for the right buyer. The property needs significant work and is being sold as-is, making it a great opportunity for investors or anyone looking to take on a renovation project. With plenty of room to reimagine inside and out, this is your chance to create something special.
-
2025-11-20$150,000 Active 411-char remark
Show marketing remark (411 chars)
Opportunity awaits in Richland! This home offers over 3,000 square feet of space and sits on nearly an acre, providing tons of potential for the right buyer. The property needs significant work and is being sold as-is, making it a great opportunity for investors or anyone looking to take on a renovation project. With plenty of room to reimagine inside and out, this is your chance to create something special.
-
2025-07-21historical
-
2025-06-25$179,000 Active
-
2024-09-12soldstatus
-
2021-01-26soldstatus
-
2017-01-23soldstatus
-
2016-05-30$39,900
-
2016-02-10soldstatus
-
2015-03-06historical
-
2014-03-05$110,000 Active
-
2014-01-05historical
-
2013-07-10$125,000 Active
-
2010-04-26soldstatus
-
2010-04-23soldstatus
-
2010-03-16historical
-
2009-08-28$119,000
-
1998-10-01soldstatus
-
1998-09-29soldstatus
-
1989-04-19soldstatus
-
1985-08-21soldstatus
ⓘ Source: listings_history table (triggers on properties + properties_extension) + one-shot
backfill from property_details.listing_events for pre-trigger history.
Tax reassessment forecast TX · Resets to sale price
- Current annual tax
- $2,662 · $222/mo
- Projected year-2 tax
- $2,699 · $225/mo
- Expected delta
- +$37/yr (+$3/mo · 1.4%)
ⓘ Screening estimate from a state-policy table — verify with the county assessor before closing.
Climate risk First Street
- Flood 1/10 Low FEMA zone X (unshaded) · 0% chance over 30 yrs
- Wildfire 4/10 Moderate
- Heat 7/10 Severe 7 d/yr ≥109°F today · 25 d/yr by 30 yrs out
- Wind 7/10 Severe 78% chance of damaging wind over 30 yrs
- Air quality 1/10 Low 0 unhealthy d/yr today · 0 by 30 yrs out
Nearby sold comps map
Loading sold comps map…
Walkable amenities ~0.75 mi
Loading nearby amenities…
Taxation est. · year 1
- Rental income
- $17,179
- − Mortgage interest
- −$8,262
- − Property taxes
- −$2,662
- − Insurance
- −$738
- − Repairs & maintenance
- −$1,374
- − Management
- −$1,374
- − Depreciation
- −$4,291
- Taxable loss
- −$1,522
- Est. tax savings @ 24.0%
- +$365
- After-tax cash flow
- $1,255/yr
For passive investors: Depreciation is non-cash, so a rental often shows a tax loss while cash-flowing — sheltering income. Rental losses are passive: they offset passive income freely, and up to $25,000/yr can offset ordinary (W-2) income if you actively participate and your MAGI is under $100k (phasing out to $0 by $150k); unused losses carry forward. On sale, claimed depreciation is recaptured at up to 25%, and gains may owe capital-gains tax (a 1031 exchange can defer both). Figures are a year-1 estimate at your 24.0% rate — not tax advice; consult a CPA.
Schools (NCES district)
- District
- Corsicana ISD
- NCES district ID
- 4815330
- Math proficiency
- 39% ▼ -9.00%
- Reading proficiency
- 37% ▬ 0.00%
- Median HH income
- $39,948
- Composite
- 31.89/100
- National rank
- #5862
- State rank
- #471 of 826 in TX
Livability — Richland
- Score
- 59/100
- State rank
- #1106
- US rank
- #19595
Category grades
Schools grade is shown separately in the Schools card above.
Census & demographics
- Census place
- Richland, TX
- Population (ZIP)
- 760
Population outlook (Navarro County) Hauer SSP2
- Today (2025)
- 48,397 people
- By 2030
- 48,096 · -0.6%
- By 2040
- 47,394 · -2.1%
- By 2050
- 46,541 · -3.8%
- By 2075
- 44,940 · -7.1%
- By 2100
- 42,288 · -12.6%
Race, ethnicity, and origin ACS 2023
- Neighborhood character
- Diverse neighborhood (Simpson 0.62)
- Race & ethnicity
- Two or more races 49% Hispanic / Latino 44% White 42% Black 7%
- Hispanic origin (detail)
- Mexican 44%
- Common ancestry
- Serbian 1%
- Foreign-born
- 16% · Canada
- Languages at home
- 62% English-only · Spanish 38%
Political lean MEDSL · Navarro
- 2024 margin
- Solid R (+51.8) · D 23.7% · R 75.6%
- 2008→2024 swing
- -18.7pp toward R · 2008: -33.1pp · 2024: -51.8pp
- All cycles
- 2024: R+51.8 2020: R+45.5 2016: R+48.8 2012: R+42.4 2008: R+33.1
Not yet ingested
- Civics
- —
Market trends
- HPI YoY
- ▲ 3.70%
- Current HPI
- 109.6009
- Rent YoY
- —
- Metro
- —
- State GDP YoY
- ▲ 3.95%
- F500 in state
- 110
Industry mix (Fortune 500 HQ in TX)
| Industry | F500 HQs | Revenue |
|---|---|---|
| Energy | 16 | $1,198B |
|
||
| Technology | 5 | $198B |
|
||
| Engineering / Construction | 4 | $72B |
|
||
| Energy Services | 3 | $60B |
|
||
| Utilities | 3 | $41B |
|
||
| Healthcare | 2 | $330B |
|
||
Price history
+23.9% since first listed21 events — show timeline
- 2026-02-16 Price Changed $147,500 NTREIS
- 2025-11-20 Listed $150,000 NTREIS
- 2025-07-21 Listing Removed — NTREIS
- 2025-06-25 Listed $179,000 NTREIS
- 2024-09-12 Sold (Public Records) — Public Records
- 2021-01-26 Sold (Public Records) — Public Records
- 2017-01-23 Sold (MLS) — PAOR
- 2016-05-30 Listed $39,900 PAOR
- 2016-02-10 Sold (Public Records) — Public Records
- 2015-03-06 Listing Removed — NTREIS
- 2014-03-05 Listed $110,000 NTREIS
- 2014-01-05 Listing Removed — NTREIS
- 2013-07-10 Listed $125,000 NTREIS
- 2010-04-26 Sold (Public Records) — Public Records
- 2010-04-23 Sold (MLS) — NTREIS
- 2010-03-16 Listing Removed — NTREIS
- 2009-08-28 Listed $119,000 NTREIS
- 1998-10-01 Sold (Public Records) — Public Records
- 1998-09-29 Sold (Public Records) — Public Records
- 1989-04-19 Sold (Public Records) — Public Records
- 1985-08-21 Sold (Public Records) — Public Records
Property tax history
-0.6%/yrLatest (2025): $2,662 · +4.4% YoY. Source: county tax records.
Cash-flow waterfall
monthlySold comps — $/sqft
last 12 mo · ≤1 miLoading sold comps…