8297 Strasse Blvd · Cleveland, FL
Flood risk 1/10 · Minimal
- FEMA flood zone
- X (unshaded)
- Chance of flooding over 30 yrs
- 0.0%
- Est. flood insurance / yr
- $507 – $1,088
Fire risk 7/10 · Major
- Est. fire insurance / yr
- $947 – $1,759
Heat risk 10/10 · Severe
- Hot days now (above 108°F)
- 7 days/yr
- Hot days in 30 yrs
- 28 days/yr
Wind risk 10/10 · Severe
- Chance of severe wind over 30 yrs
- 99.0%
Air-quality risk 3/10 · Minor
- Unhealthy air days now
- 2 days/yr
- Unhealthy air days in 30 yrs
- 2 days/yr
Risk factors via First Street. Map © Google.
Why this score? — see what drove the D+ grade
The composite is a weighted blend of 9 inputs, each scored 0–100. Each bar is that input's sub-score; the figure is the points it added to the 100-point composite (weight × sub-score).
- Cash flow +14.4/30.0
- ARV discount +7.5/15.0
- Schools +4.6/10.0
- DSCR +4.4/10.0
- 1% rule +4.0/10.0
- Rent growth +3.5/5.0
- Livability +3.4/5.0
- Condition / age +2.5/5.0
- Appreciation +2.4/10.0
$277,500
🖨 Deal sheet 📄 Offer letter ✓ Due diligence
Listing remarks
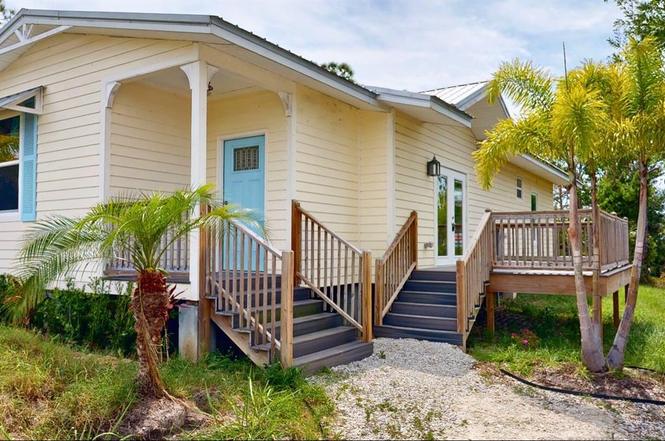
Price reduced $10K, * * Seller WILL ASSIST with BUYERS CLOSING COST * * Come see this beautifully crafted, new custom-built 3-bedroom, 2-bath home that sits on 2/3's of an acre of agriculturally zoned land, offering plenty of space and versatility. Inside, you'll find beautiful touches throughout, including luxurious NEW granite countertops, NEW Moen faucets, and Brand-New luxury vinyl flooring that adds warmth and durability. The home features a NEW metal roof and a NEW air conditioning unit, ensuring comfort and efficiency year-round. Exterior durability is enhanced with premium concrete Hardie Board siding, designed for Florida's climate. In addition, the home is equipped with a Brand
Key facts
- Metal roof
- Moen faucets
- Granite countertops
Tags
Property features AI
Finance
- Other: Builder: Safe IRA Homes; Custom builder model; Living area reported by builder; Lot approximately 0.63 acres (1/2 to less than 1 acre); One well and one septic on property; Zoning: AG
- HOA & community: Pets allowed; No association approval required
Exterior
- Parking: Driveway parking; Guest parking; Open parking; Parking pad; RV access/parking
- Utilities: Well water; Septic tank; Electricity connected; Sewer connected; Water connected
- Home design: Single-family residence; One story; East-facing; Residential property in completed condition
- Construction: Cement siding; Metal roof; Pillar/post/pier foundation; New construction
- Exterior features: Deck; French doors; Private mailbox; Mature landscaping with trees; Landscaped yard; Wooded areas; Cleared lot; City limits location; In-county; Zoned for horses; Limerock road access
Interior
- Kitchen: Convection oven; Dishwasher; Microwave; Range; Range hood; Refrigerator
- Bedrooms: 3 bedrooms
- Bathrooms: 2 full bathrooms
- Heating & cooling: Central heating; Central air conditioning
- Interior features: Eat-in kitchen; High ceilings; Kitchen/family room combo; Living room/dining room combo; Open floorplan; Solid wood cabinets; Stone counters
- Laundry & utility: Washer hookup; Electric dryer hookup; Inside laundry; Laundry closet; Inside utility room
Neighborhood map
What this means for you Summary
Snapshot
- This is a 3-bed/2.0-bath land listed at $278k.
Deal economics
- At list price, monthly cash flow is $53 ($642/yr) — positive.
- The deal already cash-flows at list — no discount required.
- To meet the 1% rule (rent ≥ 1% of price), the offer needs to be $250k (10.1% below list).
- Recommended offer: $244k (12.0% below list) — sets the bar for market timing.
- Cap rate 6.5% vs local median 4.8% in Cleveland — top-decile yield for the area; either an underpriced asset or a hidden risk that comps aren't pricing in. Stress-test before assuming the spread holds.
Location & tenants
- Location reads 67/100 on livability (#574 in FL) — a middle-class / working-renter tenant base. Strengths: crime A+, cost of living A+, housing A+; Watch: employment D, amenities F, commute F.
- Charlotte (suburban): math 54% / reading 54% proficiency, ranked #22 of 73 in FL (top 30%) — acceptable for families but not a draw, mixed tenant base, ~2y average lease.
- Zoned schools: East Elementary School (math 67% / reading 68%, grade B+, #435 of 2,144 statewide, top 21%, 761 students, 52% FRL); Charlotte High School (math 44% / reading 46%, grade D-, #228 of 667 statewide, top 35%, 1,994 students, 41% FRL).
- Market conditions: Rents rising fast (+4.1%/yr); 1037 active listings in the ZIP; 4,585 units permitted in Charlotte County in 2024 (703 in 5+ unit buildings).
- This rent runs 41% of the median local income ($72k/yr) — at the standard rent-burdened threshold; future hikes will face affordability resistance.
Forward outlook
- Local home prices are declining (-3.0%/yr); year-one equity from $2k of loan paydown is wiped out by about $8k of value loss. Plan a longer hold.
- Charlotte County population projected at +24% by 2050 — long-run rental-demand tailwind backs the buy-and-hold thesis.
Negotiation context
- It's been on market 423 days — a 12% lower offer ($244k) is reasonable based on typical stale-listing flexibility.
- 5 sale attempts since 4y ago; this cycle's ask has dropped $42k (13%) from the opening price — seller is motivated, your offer sets the floor, not the list.
- Current owner paid $100k; list at $278k implies a 178% gain — meaningful room to come down on a strong offer.
Risks & watch-outs
- Climate carrying-cost: severe wind risk, 99% chance of damaging wind over 30y; major wildfire risk; extreme-heat days projected 7→28/yr by 2055 (HVAC capex compounding) — expect insurance premiums to compound above CPI over the hold.
Questions for the listing agent
- It's been on market 423 days. Have you received any prior offers? Is the seller open to a 12% concession, seller financing, or rate buy-down credit?
- Why hasn't it sold? Are there any deal-killer items the seller is aware of (foundation, flood, title, zoning, code violations)?
- Is there a deadline driving the sale (1031 exchange, divorce, estate, relocation)? That informs how much negotiation room exists.
- Schools are F-rated, which usually means shorter tenancies and higher turnover. Who's the typical renter profile here, and what's been the actual vacancy rate?
- The area grade is low — what's the realistic commute time and amenity access for the typical tenant pool here? Any planned neighborhood developments (good or bad) we should know about?
- What's the average days-on-market for RENTAL listings here right now (not sales)? A rising rental-DOM trend means longer vacancies and softer asking-rent achievability than the comps imply.
- What's the recent tenant-quality profile in this submarket — average credit score on applications, eviction rate, late-payment / NSF rate, and stable-employment percentage? A property-management company in the area should have these aggregated.
- How much new for-sale + rental construction is in the pipeline within 1–3 miles? Heavy new supply typically softens prices + rents 12–24 months out; constrained supply supports both.
Investment metrics
- 1% rule
- 0.90% ✗
- Cap rate
- 6.52%
- Cash-on-cash
- 0.83%
- DSCR
- 1.04
- GRM
- 9.3
CMA / ARV
No comps found within radius.
Projected returns pro-forma
-3.0% appreciation · 4.13% rent growth · sell at horizon
- IRR
- -13.7%
- Equity multiple
- 0.50×
- Total profit
- $-38,653
- Equity at exit
- $41,376
- IRR
- -3.1%
- Equity multiple
- 0.78×
- Total profit
- $-17,072
- Equity at exit
- $23,993
Cash invested: $77,700 (down + closing). Projections, not guarantees.
Landlord ↔ Tenant lean methodology
- Overall (STATE)
- 87 Strongly Landlord-Friendly
- State Florida
- 87 Strongly Landlord-Friendly · R+3
- County
- — inherits STATE
- City
- — inherits STATE
ZIP-level market 33982
- Home prices YoY
- -1.2%
- Rents YoY
- 4.1%
- Active inventory
- 1037
- Price-to-rent
- 9.3×
Monthly cashflow live
- Estimated rent
- $2,495 medium interval (Pro) →
- Mortgage (P&I)
- −$1,455
- Tax est. 1.5%
- −$347 /mo · $4,162/yr
- Insurance
- −$116
- HOA
- −$0
- Vacancy / Maint / Mgmt
- −$524
- Net cashflow
- $53
Break-even live
UW: 25.0% down · 7.5% · 30yr · 1.5% tax · 5.0% vac · 8.0% maint · 8.0% mgmt
Financing live
Cash to close
- Down payment
- $69,375
- Closing costs
- $8,325
- Reserves months
- —
- Total cash needed
- —
Loan-product check · same deal, 3 products live
Conventional
25% down · 7.5% · 30yr
- Down + closing
- —
- Monthly P&I
- —
- Monthly cashflow
- —
- DSCR
- —
- Eligible?
- —
Personal DTI + credit; lowest rate.
DSCR
20% down · 8.5% · 30yr
- Down + closing
- —
- Monthly P&I
- —
- Monthly cashflow
- —
- DSCR
- —
- Eligible?
- —
No personal income docs; deal must DSCR.
Hard money
10% down · 12.0% · 12mo
- Down + closing
- —
- Monthly P&I
- —
- Monthly cashflow
- —
- DSCR
- —
- Eligible?
- —
Short-term bridge; refi at stabilization.
Listing history 27 events
-
2026-06-18days on market $277,500 Active 423 DOM
-
2026-06-17days on market $277,500 Active 422 DOM
-
2026-06-16days on market $277,500 Active 421 DOM
-
2026-06-15days on market $277,500 Active 420 DOM
-
2026-06-14days on market $277,500 Active 418 DOM
-
2026-06-13days on market $277,500 Active 417 DOM
-
2026-06-10days on market $277,500 Active 415 DOM
-
2026-06-09days on market $277,500 Active 414 DOM
-
2026-06-08days on market $277,500 Active 413 DOM
-
2026-06-05days on market $277,500 Active 409 DOM
-
2026-06-02days on market $277,500 Active 407 DOM
-
2026-06-01days on market $277,500 Active 406 DOM
-
2026-05-31days on market $277,500 Active 405 DOM
-
2026-05-30days on market $277,500 Active 404 DOM
-
2026-05-01price $277,500
-
2026-04-20status Active
-
2026-04-18historical
-
2025-12-08price $287,500
-
2025-06-10price $299,750
-
2025-04-19$319,750 Active
-
2023-06-02historical
-
2022-10-17status Active
-
2022-10-03status Pending
-
2022-09-09price $349,000
-
2022-09-06status Active
-
2022-05-21$359,000 Active
-
2020-08-17soldstatus $100,000
ⓘ Source: listings_history table (triggers on properties + properties_extension) + one-shot
backfill from property_details.listing_events for pre-trigger history.
Climate risk First Street
- Flood 1/10 Low FEMA zone X (unshaded) · 0% chance over 30 yrs
- Wildfire 7/10 Severe
- Heat 10/10 Extreme 7 d/yr ≥108°F today · 28 d/yr by 30 yrs out
- Wind 10/10 Extreme 99% chance of damaging wind over 30 yrs
- Air quality 3/10 Moderate 2 unhealthy d/yr today · 2 by 30 yrs out
Nearby sold comps map
Loading sold comps map…
Walkable amenities ~0.75 mi
Loading nearby amenities…
Taxation est. · year 1
- Rental income
- $29,943
- − Mortgage interest
- −$15,544
- − Property taxes
- −$4,162
- − Insurance
- −$1,388
- − Repairs & maintenance
- −$2,395
- − Management
- −$2,395
- − Depreciation
- −$8,073
- Taxable loss
- −$4,015
- Est. tax savings @ 24.0%
- +$964
- After-tax cash flow
- $1,606/yr
For passive investors: Depreciation is non-cash, so a rental often shows a tax loss while cash-flowing — sheltering income. Rental losses are passive: they offset passive income freely, and up to $25,000/yr can offset ordinary (W-2) income if you actively participate and your MAGI is under $100k (phasing out to $0 by $150k); unused losses carry forward. On sale, claimed depreciation is recaptured at up to 25%, and gains may owe capital-gains tax (a 1031 exchange can defer both). Figures are a year-1 estimate at your 24.0% rate — not tax advice; consult a CPA.
Schools (NCES district)
- District
- Charlotte
- NCES district ID
- 1200240
- Math proficiency
- 54% ▼ -6.00%
- Reading proficiency
- 54% ▼ -1.00%
- Median HH income
- $44,864
- Composite
- 45.62/100
- National rank
- #2586
- State rank
- #22 of 73 in FL
Livability — Cleveland
- Score
- 67/100
- State rank
- #574
- US rank
- #10905
Category grades
Schools grade is shown separately in the Schools card above.
Census & demographics
- County
- Charlotte County · 196,994 people
- Metro
- Punta Gorda, FL
- Population (ZIP)
- 13,006
- Household income
- $72,443
- Rent vs Own
- Severe rent burden
- 43.0
Population outlook (Charlotte County) Hauer SSP2
- Today (2025)
- 198,646 people
- By 2030
- 210,507 · +6.0%
- By 2040
- 230,857 · +16.2%
- By 2050
- 247,148 · +24.4%
- By 2075
- 281,777 · +41.8%
- By 2100
- 293,609 · +47.8%
Race, ethnicity, and origin ACS 2023
- Neighborhood character
- Predominantly White (81%)
- Race & ethnicity
- White 81% Two or more races 8% Hispanic / Latino 7% Black 7%
- Hispanic origin (detail)
- Puerto Rican 2% Cuban 3%
- Common ancestry
- Lithuanian 3% Iranian 3% Slovak 3%
- Foreign-born
- 6% · Canada, Jamaica
- Languages at home
- 93% English-only · Spanish 5% German/W. Germanic 1% Arabic 1%
Political lean MEDSL · Charlotte
- 2024 margin
- Solid R (+34.0) · D 32.7% · R 66.7%
- 2008→2024 swing
- -26.7pp toward R · 2008: -7.2pp · 2024: -34.0pp
- All cycles
- 2024: R+34.0 2020: R+26.6 2016: R+27.8 2012: R+14.3 2008: R+7.2
Not yet ingested
- Civics
- —
Market trends
- HPI YoY
- ▼ -5.25%
- Current HPI
- 448.5895
- Rent YoY
- ▲ 4.13%
- Metro
- Punta Gorda, FL
- State GDP YoY
- ▲ 3.28%
- F500 in state
- 36
Industry mix (Fortune 500 HQ in FL)
| Industry | F500 HQs | Revenue |
|---|---|---|
| Industrial Technology | 2 | $29B |
|
||
| Insurance | 2 | $17B |
|
||
| Retail | 1 | $60B |
|
||
| Technology Distribution | 1 | $58B |
|
||
| Homebuilding | 1 | $35B |
|
||
| Technology Manufacturing | 1 | $35B |
|
||
Price history
+177.5% since first listed13 events — show timeline
- 2026-05-01 Price Changed $277,500 Stellar MLS as Distributed by MLS Grid
- 2026-04-20 Relisted — Stellar MLS as Distributed by MLS Grid
- 2026-04-18 Listing Removed — Stellar MLS as Distributed by MLS Grid
- 2025-12-08 Price Changed $287,500 Stellar MLS as Distributed by MLS Grid
- 2025-06-10 Price Changed $299,750 Stellar MLS as Distributed by MLS Grid
- 2025-04-19 Listed $319,750 Stellar MLS as Distributed by MLS Grid
- 2023-06-02 Listing Removed — Stellar MLS as Distributed by MLS Grid
- 2022-10-17 Relisted — Stellar MLS as Distributed by MLS Grid
- 2022-10-03 Pending — Stellar MLS as Distributed by MLS Grid
- 2022-09-09 Price Changed $349,000 Stellar MLS as Distributed by MLS Grid
- 2022-09-06 Relisted — Stellar MLS as Distributed by MLS Grid
- 2022-05-21 Listed $359,000 Stellar MLS as Distributed by MLS Grid
- 2020-08-17 Sold (Public Records) $100,000 Public Records
Property tax history
+5.3%/yrLatest (2025): $308 · +3.3% YoY. Source: county tax records.
Cash-flow waterfall
monthlySold comps — $/sqft
last 12 mo · ≤1 miLoading sold comps…