4 Joseph Ave · Amity, PA
Flood risk No data
- FEMA flood zone
- —
- Chance of flooding over 30 yrs
- —
- Est. flood insurance / yr
- —
Fire risk No data
- Est. fire insurance / yr
- —
Heat risk No data
- Hot days now (above threshold)
- —
- Hot days in 30 yrs
- —
Wind risk No data
- Chance of severe wind over 30 yrs
- —
Air-quality risk No data
- Unhealthy air days now
- —
- Unhealthy air days in 30 yrs
- —
Risk factors via First Street. Map © Google.
Why this score? — see what drove the C+ grade
The composite is a weighted blend of 9 inputs, each scored 0–100. Each bar is that input's sub-score; the figure is the points it added to the 100-point composite (weight × sub-score).
- Cash flow +29.8/30.0
- DSCR +10.0/10.0
- 1% rule +8.4/10.0
- ARV discount +4.1/15.0
- Schools +4.1/10.0
- Rent growth +2.5/5.0
- Livability +2.5/5.0
- Condition / age +2.5/5.0
- Appreciation +0.0/10.0
$129,500
🖨 Deal sheet 📄 Offer letter ✓ Due diligence
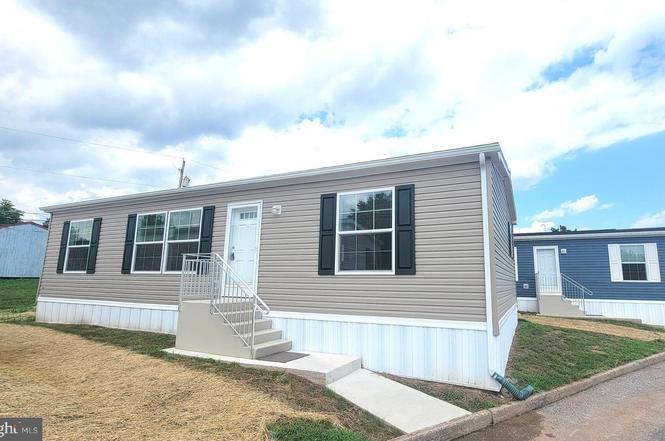
Listing remarks
This home is a brand new 2025 (44 X 24) double wide. For energy efficiency the construction is 2 x6. Home comes with a 12-month manufacturer warranty and an additional six year limited warranty. The large kitchen(14x11) has upgraded cabinets with impressive L shaped layout. The cabinets extend all the way to ceiling. There are a total of 22 cabinets and drawers. The gas stove, fridge, and dishwasher are all stainless steel made by Whirlpool. Enjoy relaxing in the 18x11 living room which opens into the kitchen/dining area. This home has 3 bedrooms and 2 full baths. Master bedroom(14x11) has a private bath and a large closet. Home has a separate laundry and utility room. Most windows h
Key facts
- Private bath
- Large kitchen
- Upgraded cabinets
Tags
Neighborhood map
What this means for you Summary
Snapshot
- This is a 3-bed/2.0-bath single-family listed at $130k.
Deal economics
- At list price, monthly cash flow is $476 ($6k/yr) — positive.
- The deal already cash-flows at list — no discount required.
- Meets the 1% rule at list price ($2k rent vs $130k).
- Recommended offer: $114k (12.0% below list) — sets the bar for market timing.
Location & tenants
- Location reads: area grade C — affects rentability + tenant quality, not the cash-flow math above.
- Daniel Boone Area SD (suburban): math 38% / reading 52% proficiency, ranked #217 of 539 in PA (top 40%) — families likely to look elsewhere, expect single-tenant / working-renter base with shorter leases; only 18% free/reduced lunch — higher-income household profile.
- Market conditions: 83 active listings in the ZIP; 1 comparable units currently listed for rent nearby; 258 units permitted in Berks County in 2024 (27 in 5+ unit buildings).
Forward outlook
- Local home prices are declining (-3.0%/yr); year-one equity from $895 of loan paydown is wiped out by about $4k of value loss. Plan a longer hold.
- Berks County population projected at +3% by 2050 — modest demand growth; plan on rents tracking national, not racing it.
- At projected returns (-3.0% appreciation + 3.0% rent growth), your $36k cash investment doubles in ~8 years — after that, you're playing with house money.
Negotiation context
- It's been on market 276 days — a 12% lower offer ($114k) is reasonable based on typical stale-listing flexibility.
Questions for the listing agent
- It's been on market 276 days. Have you received any prior offers? Is the seller open to a 12% concession, seller financing, or rate buy-down credit?
- Why hasn't it sold? Are there any deal-killer items the seller is aware of (foundation, flood, title, zoning, code violations)?
- Is there a deadline driving the sale (1031 exchange, divorce, estate, relocation)? That informs how much negotiation room exists.
- What's the average days-on-market for RENTAL listings here right now (not sales)? A rising rental-DOM trend means longer vacancies and softer asking-rent achievability than the comps imply.
- What's the recent tenant-quality profile in this submarket — average credit score on applications, eviction rate, late-payment / NSF rate, and stable-employment percentage? A property-management company in the area should have these aggregated.
- How much new for-sale + rental construction is in the pipeline within 1–3 miles? Heavy new supply typically softens prices + rents 12–24 months out; constrained supply supports both.
Investment metrics
- 1% rule
- 1.34% ✓
- Cap rate
- 10.70%
- Cash-on-cash
- 15.74%
- DSCR
- 1.70
- GRM
- 6.2
CMA / ARV
- ARV (on-the-fly)
- $120,384
- Comps found
- 12
Show comp detail 12 sales within ~0.75 mi
| Address | Dist | Beds/Ba | Sqft | Sold | Price | $/sf | Match |
|---|---|---|---|---|---|---|---|
| 4 Joseph Ave | 0.00mi | 3/2.0 | 1,056 (0%) | 1mo | $129,500 | $123 | 100 |
| 3 Joseph Ave | 0.01mi | 2/2.0 (-1) | 960 (-9%) | 1mo | $119,500 | $124 | 78 |
| 52 Virginia Ave | 0.12mi | 3/1.5 | 1,008 (-4%) | 15mo | $15,000 | $15 | 72 |
| 740 Monocacy Creek Rd | 0.08mi | 3/2.0 | 1,160 (+10%) | 12mo | $326,000 | $281 | 70 |
| 2 Joseph Ave | 0.06mi | 2/2.0 (-1) | 960 (-9%) | 9mo | $123,500 | $129 | 70 |
| 89 Valley View Rd | 0.06mi | 2/2.0 (-1) | 924 (-12%) | 4mo | $105,450 | $114 | 68 |
| 57 Mildred Ave | 0.13mi | 3/1.0 | 980 (-7%) | 12mo | $50,000 | $51 | 68 |
| 88 Valley View Rd | 0.06mi | 2/1.0 (-1) | 980 (-7%) | 10mo | $46,000 | $47 | 67 |
| 856 Monocacy Creek Rd | 0.11mi | 3/1.0 | 1,200 (+14%) | 8mo | $349,900 | $292 | 62 |
| 139 Hill Ave | 0.13mi | 2/2.0 (-1) | 924 (-12%) | 18mo | $99,750 | $108 | 53 |
| 140 Hill Ave | 0.09mi | 2/2.0 (-1) | 924 (-12%) | 22mo | $99,500 | $108 | 52 |
| 137 Hill | 0.13mi | 2/2.0 (-1) | 924 (-12%) | 22mo | $99,500 | $108 | 50 |
Match score weights: distance 35% · size 25% · config 20% · recency 20%. Top-matched comps best support the ARV.
Projected returns pro-forma
-3.0% appreciation · 3.0% rent growth · sell at horizon
- IRR
- 6.6%
- Equity multiple
- 1.26×
- Total profit
- $9,339
- Equity at exit
- $19,309
- IRR
- 16.0%
- Equity multiple
- 2.30×
- Total profit
- $47,252
- Equity at exit
- $11,197
Cash invested: $36,260 (down + closing). Projections, not guarantees.
Landlord ↔ Tenant lean methodology
- Overall (STATE)
- 62 Landlord-Friendly
- State Pennsylvania
- 62 Landlord-Friendly · EVEN
- County
- — inherits STATE
- City
- — inherits STATE
ZIP-level market 19508
- Home prices YoY
- -25.6%
- Active inventory
- 83
- Price-to-rent
- 6.2×
Monthly cashflow live
- Estimated rent
- $1,735 medium interval (Pro) →
- Mortgage (P&I)
- −$679
- Tax est. 1.5%
- −$162 /mo · $1,942/yr
- Insurance
- −$54
- HOA
- −$0
- Vacancy / Maint / Mgmt
- −$364
- Net cashflow
- $476
Break-even live
UW: 25.0% down · 7.5% · 30yr · 1.5% tax · 5.0% vac · 8.0% maint · 8.0% mgmt
Financing live
Cash to close
- Down payment
- $32,375
- Closing costs
- $3,885
- Reserves months
- —
- Total cash needed
- —
Loan-product check · same deal, 3 products live
Conventional
25% down · 7.5% · 30yr
- Down + closing
- —
- Monthly P&I
- —
- Monthly cashflow
- —
- DSCR
- —
- Eligible?
- —
Personal DTI + credit; lowest rate.
DSCR
20% down · 8.5% · 30yr
- Down + closing
- —
- Monthly P&I
- —
- Monthly cashflow
- —
- DSCR
- —
- Eligible?
- —
No personal income docs; deal must DSCR.
Hard money
10% down · 12.0% · 12mo
- Down + closing
- —
- Monthly P&I
- —
- Monthly cashflow
- —
- DSCR
- —
- Eligible?
- —
Short-term bridge; refi at stabilization.
Rent comps 1 comps
| Address | Beds | Baths | Sqft | Rent | $/sqft | DOM | Units | Dist |
|---|---|---|---|---|---|---|---|---|
| 24 Cedar House Douglassville, PA | 2.0–3.0 | 1.0 | 1037 | $1,735 | $1.67 | 1d | 5 | 1.16mi |
Listing history 2 events
-
2026-06-03remarks 699-char remark
-
2026-06-03$129,500 Pending 276 DOM
ⓘ Source: listings_history table (triggers on properties + properties_extension) + one-shot
backfill from property_details.listing_events for pre-trigger history.
Nearby sold comps map
Loading sold comps map…
Walkable amenities ~0.75 mi
Loading nearby amenities…
Taxation est. · year 1
- Rental income
- $20,820
- − Mortgage interest
- −$7,254
- − Property taxes
- −$1,942
- − Insurance
- −$648
- − Repairs & maintenance
- −$1,666
- − Management
- −$1,666
- − Depreciation
- −$3,767
- Taxable income
- $3,878
- Est. tax owed @ 24.0%
- −$931
- After-tax cash flow
- $4,778/yr
For passive investors: Depreciation is non-cash, so a rental often shows a tax loss while cash-flowing — sheltering income. Rental losses are passive: they offset passive income freely, and up to $25,000/yr can offset ordinary (W-2) income if you actively participate and your MAGI is under $100k (phasing out to $0 by $150k); unused losses carry forward. On sale, claimed depreciation is recaptured at up to 25%, and gains may owe capital-gains tax (a 1031 exchange can defer both). Figures are a year-1 estimate at your 24.0% rate — not tax advice; consult a CPA.
Schools (NCES district)
- District
- Daniel Boone Area SD
- NCES district ID
- 4207290
- Math proficiency
- 38% ▼ -9.00%
- Reading proficiency
- 52% ▼ -14.00%
- Median HH income
- $75,511
- Composite
- 41.03/100
- National rank
- #3584
- State rank
- #217 of 539 in PA
Livability — Amity
No livability data for this city. (Only ~50 U.S. cities are tracked.)
Census & demographics
- Population (ZIP)
- 15,066
Population outlook (Berks County) Hauer SSP2
- Today (2025)
- 425,767 people
- By 2030
- 428,814 · +0.7%
- By 2040
- 433,463 · +1.8%
- By 2050
- 439,426 · +3.2%
- By 2075
- 478,647 · +12.4%
- By 2100
- 518,507 · +21.8%
Race, ethnicity, and origin ACS 2023
- Neighborhood character
- Predominantly White (90%)
- Race & ethnicity
- White 90% Two or more races 6% Hispanic / Latino 3% Black 1%
- Common ancestry
- Romanian 6% Iranian 3% Lithuanian 2%
- Foreign-born
- 1% · Canada
- Languages at home
- 98% English-only · Spanish 1% Other Indo-European 1%
Political lean MEDSL · Berks
- 2024 margin
- R (+12.2) · D 43.4% · R 55.6%
- 2008→2024 swing
- -21.4pp toward R · 2008: 9.2pp · 2024: -12.2pp
- All cycles
- 2024: R+12.2 2020: R+8.2 2016: R+10.2 2012: R+0.6 2008: D+9.2
Not yet ingested
- Civics
- —
Market trends
- HPI YoY
- ▼ -94.00%
- Current HPI
- 273.8199
- Rent YoY
- —
- Metro
- —
- State GDP YoY
- ▲ 1.68%
- F500 in state
- 34
Industry mix (Fortune 500 HQ in PA)
| Industry | F500 HQs | Revenue |
|---|---|---|
| Healthcare | 2 | $309B |
|
||
| Insurance | 2 | $27B |
|
||
| Telecommunications / Media | 1 | $124B |
|
||
| Industrial Distribution | 1 | $22B |
|
||
| Financial Services | 1 | $20B |
|
||
| Chemicals / Materials | 1 | $18B |
|
||
Price history
-3.9% since first listed6 events — show timeline
- 2026-06-03 Pending — BRIGHT MLS
- 2026-06-03 Sold (MLS) $129,500 BRIGHT MLS
- 2026-04-26 Listing Removed — BRIGHT MLS
- 2026-03-04 Price Changed $129,500 BRIGHT MLS
- 2025-07-24 Listed $134,750 BRIGHT MLS
- 2025-07-24 Coming Soon $134,750 BRIGHT MLS
Cash-flow waterfall
monthlySold comps — $/sqft
last 12 mo · ≤1 miLoading sold comps…