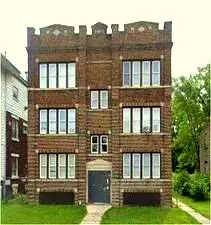
 6-Plex
15633 Lexington Ave · Harvey, IL
Flood risk 3/10 · Minor
- FEMA flood zone
- X (unshaded)
- Chance of flooding over 30 yrs
- 0.1%
- Est. flood insurance / yr
- $473 – $860
Fire risk 1/10 · Minimal
- Est. fire insurance / yr
- $804 – $1,492
Heat risk 3/10 · Minor
- Hot days now (above 102°F)
- 7 days/yr
- Hot days in 30 yrs
- 15 days/yr
Wind risk 2/10 · Minimal
- Chance of severe wind over 30 yrs
- —
Air-quality risk 4/10 · Minor
- Unhealthy air days now
- 4 days/yr
- Unhealthy air days in 30 yrs
- 5 days/yr
Risk factors via First Street. Map © Google.
Why this score? — see what drove the B+ grade
The composite is a weighted blend of 9 inputs, each scored 0–100. Each bar is that input's sub-score; the figure is the points it added to the 100-point composite (weight × sub-score).
- Cash flow +30.0/30.0
- 1% rule +10.0/10.0
- DSCR +10.0/10.0
- Appreciation +10.0/10.0
- ARV discount +7.5/15.0
- Condition / age +3.8/5.0
- Livability +3.4/5.0
- Rent growth +2.5/5.0
- Schools +0.7/10.0
$499,999
🖨 Deal sheet 📄 Offer letter ✓ Due diligence
Multi-family units
County records classify this as Multi-Family (5+ Unit). Listing-text estimate: 6 units. confirmed
5+ unit building — per-unit beds/baths from public records are typically unavailable; the breakdown below (if shown) is an estimate from the listing text.
Listing remarks
Exceptional 6-unit brick multi-family investment property offering strong in-place income and immediate value-add upside. The building features six rehabbed 3-bedroom apartments, all fully leased with solid monthly rental income. Units have been recently updated, reducing near-term capital expenditure needs for the next owner. The property also includes a finished garden-level unit featuring a full kitchen, bathroom, and bedroom space, previously used as a residential unit. This space represents significant additional income potential upon buyer's completion of due diligence. Conveniently located with access to Metra and Pace Bus transit serving the south suburban Cook County market. Close
Key facts
- Full kitchen
- Bedroom space
- Full bathroom
Tags
Property features AI
Finance
- Other: Total number of units: 6; Lot dimensions reported as 8,600 square feet
- Financial info: Total monthly income listed as $6,700; Individual unit monthly rents shown around $1,100–$1,200; Gross rent multiplier approximately 5.6
Exterior
- Home design: Multi-family property (5+ units)
- Construction: Brick construction; Built before 1978
- Exterior features: Brick exterior; Zoned for multi-family use
Interior
- Kitchen: Ranges/stoves (6 total across the property)
- Bedrooms: Multiple 3-bedroom units (several units configured with 3 bedrooms)
- Bathrooms: Multiple units with 1 full bathroom
- Heating & cooling: Forced air heating/ventilation
- Interior features: Finished basement
Neighborhood map
What this means for you Summary
Snapshot
- This is a 5×3bd/1ba + 1×1bd/1ba units multifamily listed at $500k. Condition is rated good.
Deal economics
- At list price, monthly cash flow is $4k ($49k/yr) — positive. Per door: $678/mo.
- The deal already cash-flows at list — no discount required.
- Meets the 1% rule at list price ($10k rent vs $500k).
- Recommended offer: $485k (3.0% below list) — sets the bar for market timing.
- Cap rate 16.1% vs local median 9.3% in Harvey — top-decile yield for the area; either an underpriced asset or a hidden risk that comps aren't pricing in. Stress-test before assuming the spread holds.
Location & tenants
- Location reads 67/100 on livability (#539 in IL) — a middle-class / working-renter tenant base. Strengths: commute A+, cost of living A+, housing A-; Watch: health & safety D+, schools F, crime F.
- Thornton Twp Hsd 205 (suburban): math 7% / reading 8% proficiency, ranked #594 of 620 in IL (top 96%) — low school quality limits family demand, transient renter base, plan for 1-2y turnover.
- Market conditions: 134 active listings in the ZIP; 10 comparable units currently listed for rent nearby; rentals at typical pace (median 25d on market — plan ~3-4 weeks tenant-placement turnaround); 6,272 units permitted in Cook County in 2024 (4,658 in 5+ unit buildings).
Forward outlook
- In year one you build about $53k of equity ($3k loan paydown + $50k appreciation (10.0% local appreciation)).
- At projected returns (10.0% appreciation + 3.0% rent growth), your $140k cash investment doubles in ~2 years — after that, you're playing with house money.
- By year 2, paydown + projected appreciation supports a ~$86k cash-out refi (75% LTV) — recoverable capital for the next deal without selling this one.
Negotiation context
- It's been on market 41 days — a 3% lower offer ($485k) is reasonable based on typical stale-listing flexibility.
Risks & watch-outs
- Watch-outs: built in 1922 — expect roof / HVAC / electrical / plumbing capex.
Questions for the listing agent
- It's been on market 41 days. Have you received any prior offers? Is the seller open to a 3% concession, seller financing, or rate buy-down credit?
- Can we see the unit-by-unit rent roll, current vacancy, and any below-market leases? What's the average tenancy length?
- What capital expenditures (roof, boiler, parking lot, exteriors) have been made in the last 5 years, and what's planned in the next 2?
- Built in 1922 — when were the roof, HVAC, electrical panel, plumbing, and water heater last replaced?
- Is there a deadline driving the sale (1031 exchange, divorce, estate, relocation)? That informs how much negotiation room exists.
- Schools are F-rated, which usually means shorter tenancies and higher turnover. Who's the typical renter profile here, and what's been the actual vacancy rate?
- Crime grade is F in this area — have there been break-ins, vandalism, or insurance claims at this property in the last 3 years? What carrier currently insures it and at what premium?
- What's the average days-on-market for RENTAL listings here right now (not sales)? A rising rental-DOM trend means longer vacancies and softer asking-rent achievability than the comps imply.
- What's the recent tenant-quality profile in this submarket — average credit score on applications, eviction rate, late-payment / NSF rate, and stable-employment percentage? A property-management company in the area should have these aggregated.
- How much new apartment / multifamily construction is in the pipeline within 1–3 miles? Heavy new supply (>2% of stock underway) typically softens rents 12–24 months out; light construction supports rent growth.
Investment metrics
- 1% rule
- 1.90% ✓
- Cap rate
- 16.06%
- Cash-on-cash
- 34.87%
- DSCR
- 2.55
- GRM
- 4.4
CMA / ARV
No comps found within radius.
Show comp detail 8 sales within ~0.75 mi
| Address | Dist | Beds/Ba | Sqft | Sold | Price | $/sf | Match |
|---|---|---|---|---|---|---|---|
| 15610 Loomis Ave | 0.13mi | 4/2.0 | — | 23mo | $121,000 | — | 43 |
| 268 E 157th St | 0.44mi | 4/2.0 | — | 6mo | $72,500 | — | 42 |
| 15416 Myrtle St | 0.35mi | 6/2.0 | — | 13mo | $45,000 | — | 41 |
| 15433 Myrtle Ave | 0.30mi | 5/3.0 | — | 20mo | $250,000 | — | 37 |
| 15431 Ashland Ave | 0.42mi | 6/10.0 | — | 15mo | $105,000 | — | 35 |
| 15644 Emerald Ave | 0.71mi | 4/2.0 | — | 1mo | $90,000 | — | 33 |
| 15613 Halsted St | 0.67mi | 8/4.0 | — | 16mo | $160,000 | — | 24 |
| 15223 Turlington Ave | 0.53mi | 6/2.0 | — | 23mo | $215,000 | — | 23 |
Match score weights: distance 35% · size 25% · config 20% · recency 20%. Top-matched comps best support the ARV.
Projected returns pro-forma
10.0% appreciation · 3.0% rent growth · sell at horizon
- IRR
- 51.0%
- Equity multiple
- 4.80×
- Total profit
- $531,536
- Equity at exit
- $450,439
- IRR
- 44.7%
- Equity multiple
- 10.73×
- Total profit
- $1,361,833
- Equity at exit
- $971,388
Cash invested: $140,000 (down + closing). Projections, not guarantees.
Landlord ↔ Tenant lean methodology
- Overall (STATE)
- 43 Moderately Tenant-Leaning
- State Illinois
- 43 Moderately Tenant-Leaning · D+7
- County
- — inherits STATE
- City
- — inherits STATE
ZIP-level market 60426
- Home prices YoY
- 6.9%
- Active inventory
- 134
- Price-to-rent
- 25.2×
Monthly cashflow live
- Estimated rent
- $9,523 high interval (Pro) →
- Mortgage (P&I)
- −$2,622
- Tax est. 1.5%
- −$625 /mo · $7,500/yr
- Insurance
- −$208
- HOA
- −$0
- Vacancy / Maint / Mgmt
- −$2,000
- Net cashflow
- $4,068
Break-even live
6-unit breakdown (identical units grouped — click to expand)
| Units | Beds | Baths | Est. rent |
|---|---|---|---|
| 5× units | 3 | 1 | $8,255 |
| #1 | 3 | 1 | $1,651 |
| #2 | 3 | 1 | $1,651 |
| #3 | 3 | 1 | $1,651 |
| #4 | 3 | 1 | $1,651 |
| #5 | 3 | 1 | $1,651 |
| 1× unit | 1 | 1 | $1,267 |
| Total (6 units) | $9,523 | ||
UW: 25.0% down · 7.5% · 30yr · 1.5% tax · 5.0% vac · 8.0% maint · 8.0% mgmt
Financing live
Cash to close
- Down payment
- $125,000
- Closing costs
- $15,000
- Reserves months
- —
- Total cash needed
- —
Loan-product check · same deal, 3 products live
Conventional
25% down · 7.5% · 30yr
- Down + closing
- —
- Monthly P&I
- —
- Monthly cashflow
- —
- DSCR
- —
- Eligible?
- —
Personal DTI + credit; lowest rate.
DSCR
20% down · 8.5% · 30yr
- Down + closing
- —
- Monthly P&I
- —
- Monthly cashflow
- —
- DSCR
- —
- Eligible?
- —
No personal income docs; deal must DSCR.
Hard money
10% down · 12.0% · 12mo
- Down + closing
- —
- Monthly P&I
- —
- Monthly cashflow
- —
- DSCR
- —
- Eligible?
- —
Short-term bridge; refi at stabilization.
Rent comps 10 comps
| Address | Beds | Baths | Sqft | Rent | $/sqft | DOM | Units | Dist |
|---|---|---|---|---|---|---|---|---|
| 15402 Loomis Ave Harvey, IL | 1.0 | 1.0 | — | $1,000 | — | 24d | 1 | 0.35mi |
| 15411 Myrtle Ave Unit 2 Harvey, IL | 2.0 | 1.0 | 2200 | $1,800 | $0.82 | 24d | 1 | 0.36mi |
| 16125 Marshfield Ave Markham, IL | 3.0 | 1.0 | 1043 | $2,400 | $2.30 | 1d | 1 | 0.71mi |
| 16048 Halsted St Unit 2 Harvey, IL | 3.0 | 1.0 | 1091 | $1,650 | $1.51 | 24d | 1 | 0.82mi |
| 203 W 154th St Apt 1S Harvey, IL | 2.0 | 1.0 | — | $1,050 | — | 24d | 1 | 1.05mi |
| 203 W 154th St Harvey, IL | 2.0 | 1.0 | — | $1,050 | — | 20d | 1 | 1.05mi |
| 15237 4th Ave Apt 2 Phoenix, IL | 2.0 | 1.0 | — | $1,300 | — | 19d | 1 | 1.07mi |
| 166 W 151st St Unit 101 Harvey, IL | 1.0 | 1.0 | — | $1,196 | — | 11d | 1 | 1.13mi |
| 174 W 151st St Unit 101 Harvey, IL | 1.0 | 1.0 | — | $1,196 | — | 11d | 1 | 1.17mi |
| 14624 Des Plaines St Unit 1 Harvey, IL | 1.0 | 1.0 | — | $950 | — | 24d | 1 | 1.37mi |
Listing history 16 events
-
2026-06-18days on market $499,999 Active 41 DOM
-
2026-06-17days on market $499,999 Active 40 DOM
-
2026-06-16days on market $499,999 Active 39 DOM
-
2026-06-15days on market $499,999 Active 38 DOM
-
2026-06-13days on market $499,999 Active 36 DOM
-
2026-06-13days on market $499,999 Active 35 DOM
-
2026-06-09days on market $499,999 Active 32 DOM
-
2026-06-08days on market $499,999 Active 31 DOM
-
2026-06-07days on market $499,999 Active 30 DOM
-
2026-06-04days on market $499,999 Active 27 DOM
-
2026-06-03days on market $499,999 Active 26 DOM
-
2026-06-02days on market $499,999 Active 25 DOM
-
2026-06-01days on market $499,999 Active 24 DOM
-
2026-05-31days on market $499,999 Active 23 DOM
-
2025-11-25historical
-
2025-09-12Active
ⓘ Source: listings_history table (triggers on properties + properties_extension) + one-shot
backfill from property_details.listing_events for pre-trigger history.
Climate risk First Street
- Flood 3/10 Moderate FEMA zone X (unshaded) · 10% chance over 30 yrs
- Wildfire 1/10 Low
- Heat 3/10 Moderate 7 d/yr ≥102°F today · 15 d/yr by 30 yrs out
- Wind 2/10 Low
- Air quality 4/10 Moderate 4 unhealthy d/yr today · 5 by 30 yrs out
Nearby sold comps map
Loading sold comps map…
Walkable amenities ~0.75 mi
Loading nearby amenities…
Taxation est. · year 1
- Rental income
- $114,276
- − Mortgage interest
- −$28,008
- − Property taxes
- −$7,500
- − Insurance
- −$2,500
- − Repairs & maintenance
- −$9,142
- − Management
- −$9,142
- − Depreciation
- −$14,545
- Taxable income
- $43,439
- Est. tax owed @ 24.0%
- −$10,425
- After-tax cash flow
- $38,388/yr
For passive investors: Depreciation is non-cash, so a rental often shows a tax loss while cash-flowing — sheltering income. Rental losses are passive: they offset passive income freely, and up to $25,000/yr can offset ordinary (W-2) income if you actively participate and your MAGI is under $100k (phasing out to $0 by $150k); unused losses carry forward. On sale, claimed depreciation is recaptured at up to 25%, and gains may owe capital-gains tax (a 1031 exchange can defer both). Figures are a year-1 estimate at your 24.0% rate — not tax advice; consult a CPA.
Condition & rehab AI · 2 photos
This 6-unit brick multi-family property is in good condition with minimal maintenance needs. It offers strong in-place income and immediate value-add potential with landscaping and HVAC improvements.
Value-add opportunities
- Both Landscaping improvements — Enhanced landscaping can improve curb appeal and attract more tenants.
- Both HVAC system inspection and maintenance — A thorough inspection can ensure the HVAC system is functioning efficiently and can prevent future issues.
Renovation cost estimate screening
Value-add ROI direction
- Both Landscaping improvements — Enhanced landscaping can improve curb appeal and attract more tenants. ↑
- Both HVAC system inspection and maintenance — A thorough inspection can ensure the HVAC system is functioning efficiently and can prevent future issues. ↑
ⓘ Cost ranges are severity-bucket heuristics (US national rule-of-thumb). Get contractor quotes + a written scope before underwriting a rehab budget.
Schools (NCES district)
- District
- Thornton Twp Hsd 205
- NCES district ID
- 1738970
- Math proficiency
- 7% ▬ 0.00%
- Reading proficiency
- 8% ▼ -2.00%
- Median HH income
- $43,392
- Composite
- 6.92/100
- National rank
- #9976
- State rank
- #594 of 620 in IL
Livability — Harvey
- Score
- 67/100
- State rank
- #539
- US rank
- #11162
Category grades
Schools grade is shown separately in the Schools card above.
Census & demographics
- Census place
- Harvey, IL
- City population
- 23,066
- Population (ZIP)
- 23,066
Population outlook (Cook County) Hauer SSP2
- Today (2025)
- 5,347,519 people
- By 2030
- 5,357,703 · +0.2%
- By 2040
- 5,324,924 · -0.4%
- By 2050
- 5,230,762 · -2.2%
- By 2075
- 4,785,735 · -10.5%
- By 2100
- 4,188,836 · -21.7%
Race, ethnicity, and origin ACS 2023
- Neighborhood character
- Majority Black (59%)
- Race & ethnicity
- Black 59% Hispanic / Latino 33% Two or more races 12% White 3% Asian 2%
- Hispanic origin (detail)
- Mexican 31%
- Foreign-born
- 17% · Canada
- Languages at home
- 67% English-only · Spanish 30% Other Indo-European 2% French/Haitian/Cajun 1%
Political lean MEDSL · Cook
- 2024 margin
- Solid D (+42.0) · D 70.4% · R 28.4% · Other 1.2%
- 2008→2024 swing
- -11.4pp toward R · 2008: 53.4pp · 2024: 42.0pp
- All cycles
- 2024: D+42.0 2020: D+50.3 2016: D+53.0 2012: D+49.4 2008: D+53.4
Not yet ingested
- Civics
- —
Market trends
- HPI YoY
- ▲ 20.36%
- Current HPI
- 313.7895
- Rent YoY
- —
- Metro
- —
- State GDP YoY
- ▲ 1.59%
- F500 in state
- 60
Industry mix (Fortune 500 HQ in IL)
| Industry | F500 HQs | Revenue |
|---|---|---|
| Insurance | 4 | $201B |
|
||
| Consumer Goods | 4 | $87B |
|
||
| Industrial Machinery | 3 | $64B |
|
||
| Healthcare | 2 | $55B |
|
||
| Retail / Pharmacy | 1 | $148B |
|
||
| Agriculture / Food | 1 | $86B |
|
||
Cash-flow waterfall
monthlySold comps — $/sqft
last 12 mo · ≤1 miLoading sold comps…