705 N Birch St · Owasso, OK
Flood risk 1/10 · Minimal
- FEMA flood zone
- X (unshaded)
- Chance of flooding over 30 yrs
- 0.0%
- Est. flood insurance / yr
- $507 – $1,088
Fire risk 5/10 · Moderate
- Est. fire insurance / yr
- $2,463 – $4,575
Heat risk 7/10 · Major
- Hot days now (above 111°F)
- 7 days/yr
- Hot days in 30 yrs
- 19 days/yr
Wind risk 2/10 · Minimal
- Chance of severe wind over 30 yrs
- 3.0%
Air-quality risk 3/10 · Minor
- Unhealthy air days now
- 2 days/yr
- Unhealthy air days in 30 yrs
- 3 days/yr
Risk factors via First Street. Map © Google.
Why this score? — see what drove the B- grade
The composite is a weighted blend of 9 inputs, each scored 0–100. Each bar is that input's sub-score; the figure is the points it added to the 100-point composite (weight × sub-score).
- Cash flow +25.9/30.0
- ARV discount +15.0/15.0
- DSCR +8.7/10.0
- 1% rule +6.0/10.0
- Livability +3.9/5.0
- Schools +3.2/10.0
- Rent growth +3.0/5.0
- Condition / age +2.5/5.0
- Appreciation +0.0/10.0
$140,000
🖨 Deal sheet (PDF) 📄 Offer letter ✓ Due diligence
Listing remarks
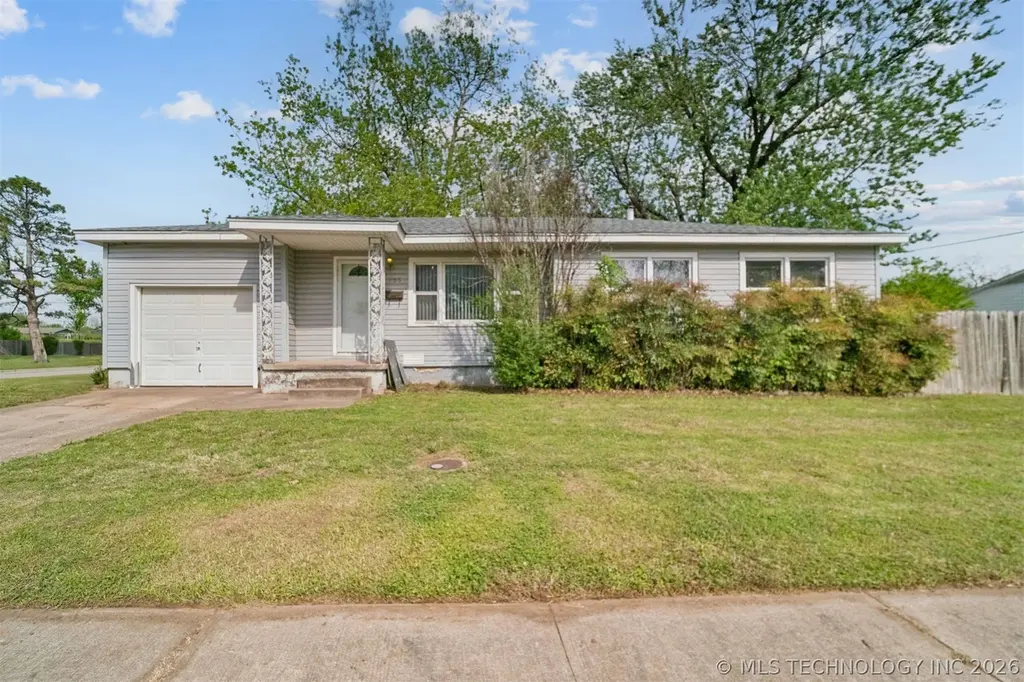
Located in the heart of Owasso, this 3-bedroom, 1-bath home with a 1-car garage offers great potential and a fantastic location. Situated on a corner lot with mature, oversized trees, the property provides both space and shade. The home features an oversized back patio, perfect for outdoor gatherings or relaxing evenings, and a low-maintenance vinyl siding exterior. Bring your updates and ideas to make this home your own and create something special.
Key facts
- Oversized trees
- Corner lot
- Oversized back patio
Tags
Neighborhood map
What this means for you Summary
Snapshot
- This is a 3-bed/1.0-bath single-family listed at $140k.
Deal economics
- At list price, monthly cash flow is $344 ($4k/yr) — positive.
- The deal already cash-flows at list — no discount required.
- Meets the 1% rule at list price ($2k rent vs $140k).
- Cap rate 9.2% vs local median 3.8% in Owasso — top-decile yield for the area; either an underpriced asset or a hidden risk that comps aren't pricing in. Stress-test before assuming the spread holds.
Location & tenants
- Location reads 78/100 on livability (#5 in OK, #2,368 nationally) — a middle-class / working-renter tenant base. Strengths: cost of living A+, housing A+, health & safety A+; Watch: commute F.
- Owasso (suburban): math 35% / reading 35% proficiency, ranked #25 of 270 in OK (top 9%) — families likely to look elsewhere, expect single-tenant / working-renter base with shorter leases.
- Market conditions: Rents rising (+1.9%/yr); 495 active listings in the ZIP; 8 comparable units currently listed for rent nearby; rentals leasing fast (median 4d on market — plan ~1-2 weeks tenant-placement turnaround); solid renter incomes; 2,818 units permitted in Tulsa County in 2024 (518 in 5+ unit buildings).
Forward outlook
- Local home prices are declining (-3.0%/yr); year-one equity from $968 of loan paydown is wiped out by about $4k of value loss. Plan a longer hold.
- Tulsa County population projected at +30% by 2050 — long-run rental-demand tailwind backs the buy-and-hold thesis.
Negotiation context
- Only 3 days on market — expect competitive offers; lowballing is unlikely to land.
- Current owner paid $34k; list at $140k implies a 306% gain — meaningful room to come down on a strong offer.
Risks & watch-outs
- Watch-outs: built in 1956 — expect roof / HVAC / electrical / plumbing capex.
- Climate carrying-cost: moderate wildfire risk; extreme-heat days projected 7→19/yr by 2055 (HVAC capex compounding) — expect insurance premiums to compound above CPI over the hold.
Questions for the listing agent
- Built in 1956 — when were the roof, HVAC, electrical panel, plumbing, and water heater last replaced?
- Is there a deadline driving the sale (1031 exchange, divorce, estate, relocation)? That informs how much negotiation room exists.
- Schools are B-rated — typically a magnet for longer-tenancy family renters. What's the average tenant stay here, and is there a school-zone premium baked into asking?
- What's the average days-on-market for RENTAL listings here right now (not sales)? A rising rental-DOM trend means longer vacancies and softer asking-rent achievability than the comps imply.
- What's the recent tenant-quality profile in this submarket — average credit score on applications, eviction rate, late-payment / NSF rate, and stable-employment percentage? A property-management company in the area should have these aggregated.
- How much new for-sale + rental construction is in the pipeline within 1–3 miles? Heavy new supply typically softens prices + rents 12–24 months out; constrained supply supports both.
Investment metrics
- 1% rule
- 1.10% ✓
- Cap rate
- 9.24%
- Cash-on-cash
- 10.54%
- DSCR
- 1.47
- GRM
- 7.6
CMA / ARV
- ARV (on-the-fly)
- $168,168
- Comps found
- 12
Show comp detail 12 sales within ~0.75 mi
| Address | Dist | Beds/Ba | Sqft | Sold | Price | $/sf | Match |
|---|---|---|---|---|---|---|---|
| 705 N Birch St | 0.00mi | 3/1.0 | 924 (0%) | 1mo | $137,850 | $149 | 99 |
| 807 N Ash St | 0.09mi | 3/1.0 | 912 (-1%) | 0mo | $160,000 | $175 | 93 |
| 802 N Birch St | 0.04mi | 3/1.0 | 900 (-3%) | 2mo | $176,000 | $196 | 92 |
| 201 E 7th St | 0.05mi | 3/1.0 | 888 (-4%) | 5mo | $154,000 | $173 | 87 |
| 804 N Cedar St | 0.05mi | 3/1.0 | 936 (+1%) | 10mo | $178,000 | $190 | 87 |
| 106 W 7th St | 0.19mi | 2/1.0 (-1) | 888 (-4%) | 1mo | $180,000 | $203 | 79 |
| 105 W 5th St | 0.25mi | 3/1.0 | 864 (-6%) | 3mo | $175,000 | $203 | 75 |
| 409 N Cedar St | 0.21mi | 3/1.0 | 888 (-4%) | 10mo | $175,000 | $197 | 75 |
| 504 N Atlanta St | 0.29mi | 3/1.0 | 888 (-4%) | 8mo | $159,000 | $179 | 74 |
| 318 N Atlanta St | 0.37mi | 3/1.0 | 864 (-6%) | 1mo | $157,500 | $182 | 72 |
| 508 N Carlsbad St | 0.36mi | 3/1.5 | 1,036 (+12%) | 7mo | $182,000 | $176 | 55 |
| 404 E 18th St | 0.65mi | 3/1.5 | 1,051 (+14%) | 3mo | $189,000 | $180 | 42 |
Match score weights: distance 35% · size 25% · config 20% · recency 20%. Top-matched comps best support the ARV.
Projected returns pro-forma
-3.0% appreciation · 1.92% rent growth · sell at horizon
- IRR
- -1.7%
- Equity multiple
- 0.94×
- Total profit
- $-2,452
- Equity at exit
- $20,874
- IRR
- 6.9%
- Equity multiple
- 1.49×
- Total profit
- $19,316
- Equity at exit
- $12,105
Cash invested: $39,200 (down + closing). Projections, not guarantees.
Landlord ↔ Tenant lean methodology
- Overall (STATE)
- 83 Strongly Landlord-Friendly
- State Oklahoma
- 83 Strongly Landlord-Friendly · R+20
- County
- — inherits STATE
- City
- — inherits STATE
ZIP-level market 74055
- Rents YoY
- 1.9%
- Active inventory
- 495
- Price-to-rent
- 7.6×
Monthly cashflow live
- Estimated rent
- $1,533 high interval (Pro) →
- Mortgage (P&I)
- −$734
- Tax from tax record
- −$74 /mo · $893/yr
- Insurance
- −$58
- HOA
- −$0
- Vacancy / Maint / Mgmt
- −$322
- Net cashflow
- $344
Break-even live
Sensitivity live
| Price | -10% $423 | -5% $384 | +0% $344 | +5% $305 | +10% $265 |
|---|---|---|---|---|---|
| Rent | -10% $223 | -5% $284 | +0% $344 | +5% $405 | +10% $465 |
| Rate | -1.0pp $415 | -0.5pp $380 | base $344 | +0.5pp $308 | +1.0pp $271 |
UW: 25.0% down · 7.5% · 30yr · 1.5% tax · 5.0% vac · 8.0% maint · 8.0% mgmt
Financing live
Cash to close
- Down payment
- $35,000
- Closing costs
- $4,200
- Reserves months
- —
- Total cash needed
- —
Loan-product check · same deal, 3 products live
Conventional
25% down · 7.5% · 30yr
- Down + closing
- —
- Monthly P&I
- —
- Monthly cashflow
- —
- DSCR
- —
- Eligible?
- —
Personal DTI + credit; lowest rate.
DSCR
20% down · 8.5% · 30yr
- Down + closing
- —
- Monthly P&I
- —
- Monthly cashflow
- —
- DSCR
- —
- Eligible?
- —
No personal income docs; deal must DSCR.
Hard money
10% down · 12.0% · 12mo
- Down + closing
- —
- Monthly P&I
- —
- Monthly cashflow
- —
- DSCR
- —
- Eligible?
- —
Short-term bridge; refi at stabilization.
Rent comps 8 comps
| Address | Beds | Baths | Sqft | Rent | $/sqft | DOM | Units | Dist |
|---|---|---|---|---|---|---|---|---|
| 802 N Birch St Owasso, OK | 3.0 | 1.0 | 900 | $1,623 | $1.80 | 20d | 1 | 0.05mi |
| 603 N Carlsbad St Unit 505B Owasso, OK | 2.0 | 1.0 | 900 | $1,100 | $1.22 | 24d | 1 | 0.32mi |
| 603 N Carlsbad St Unit 603A Owasso, OK | 2.0 | 1.0 | 900 | $1,250 | $1.39 | 4d | 1 | 0.32mi |
| 103 W 3rd St Owasso, OK | 2.0 | 1.0 | 837 | $1,299 | $1.55 | 17d | 1 | 0.42mi |
| 11697 E 83rd St N Owasso, OK | 2.0–3.0 | 1.0–2.0 | 928 | $1,450 | $1.56 | 2d | 12 | 0.44mi |
| 101 E Broadway St Unit 3 Owasso, OK | 2.0 | 1.0 | 600 | $825 | $1.38 | 4d | 1 | 0.60mi |
| 8751 N 97th East Ave Owasso, OK | 1.0–2.0 | 1.0–2.0 | 887 | $1,195 | $1.35 | 2d | 47 | 0.74mi |
| 9803 E 96th St N Owasso, OK | 1.0–3.0 | 1.0–2.0 | 951 | $2,092 | $2.20 | 2d | 8 | 1.49mi |
Listing history 3 events
-
2026-04-18status Pending
-
2026-04-14$140,000 Active
-
1990-08-08soldstatus $34,500
ⓘ Source: listings_history table (triggers on properties + properties_extension) + one-shot
backfill from property_details.listing_events for pre-trigger history.
Tax reassessment forecast OK · Resets to sale price
- Current annual tax
- $893 · $74/mo
- Projected year-2 tax
- $1,260 · $105/mo
- Expected delta
- +$367/yr (+$31/mo · 41.1%)
ⓘ Screening estimate from a state-policy table — verify with the county assessor before closing.
Climate risk First Street
- Flood 1/10 Low FEMA zone X (unshaded) · 0% chance over 30 yrs
- Wildfire 5/10 Major
- Heat 7/10 Severe 7 d/yr ≥111°F today · 19 d/yr by 30 yrs out
- Wind 2/10 Low 3% chance of damaging wind over 30 yrs
- Air quality 3/10 Moderate 2 unhealthy d/yr today · 3 by 30 yrs out
Nearby sold comps map
Loading sold comps map…
Walkable amenities ~0.75 mi
Loading nearby amenities…
Taxation est. · year 1
- Rental income
- $18,396
- − Mortgage interest
- −$7,842
- − Property taxes
- −$893
- − Insurance
- −$700
- − Repairs & maintenance
- −$1,472
- − Management
- −$1,472
- − Depreciation
- −$4,073
- Taxable income
- $1,945
- Est. tax owed @ 24.0%
- −$467
- After-tax cash flow
- $3,663/yr
For passive investors: Depreciation is non-cash, so a rental often shows a tax loss while cash-flowing — sheltering income. Rental losses are passive: they offset passive income freely, and up to $25,000/yr can offset ordinary (W-2) income if you actively participate and your MAGI is under $100k (phasing out to $0 by $150k); unused losses carry forward. On sale, claimed depreciation is recaptured at up to 25%, and gains may owe capital-gains tax (a 1031 exchange can defer both). Figures are a year-1 estimate at your 24.0% rate — not tax advice; consult a CPA.
Schools (NCES district)
- District
- Owasso
- NCES district ID
- 4023280
- Math proficiency
- 35% ▼ -14.00%
- Reading proficiency
- 35% ▼ -12.00%
- Median HH income
- $69,759
- Composite
- 32.24/100
- National rank
- #5771
- State rank
- #25 of 270 in OK
Livability — Owasso
- Score
- 78/100
- State rank
- #5
- US rank
- #2368
Category grades
Schools grade is shown separately in the Schools card above.
Census & demographics
- Census place
- Owasso, OK
- County
- Tulsa County · 640,811 people
- City population
- 51,381
- Metro
- Tulsa, OK
- Population (ZIP)
- 51,381
- Household income
- $87,506
- Rent vs Own
- Severe rent burden
- 1001.0
Population outlook (Tulsa County) Hauer SSP2
- Today (2025)
- 723,846 people
- By 2030
- 766,033 · +5.8%
- By 2040
- 851,386 · +17.6%
- By 2050
- 938,389 · +29.6%
- By 2075
- 1,166,011 · +61.1%
- By 2100
- 1,350,277 · +86.5%
Race, ethnicity, and origin ACS 2023
- Neighborhood character
- Predominantly White (72%)
- Race & ethnicity
- White 72% Two or more races 11% Hispanic / Latino 8% Native American 6% Black 3% Asian 2%
- Hispanic origin (detail)
- Mexican 5%
- Common ancestry
- Lithuanian 2% Slovak 2% Italian 2%
- Foreign-born
- 4% · Canada, Vietnam
- Languages at home
- 92% English-only · Spanish 5% Other Asian/Pacific 1%
Political lean MEDSL · Tulsa
- 2024 margin
- R (+15.2) · D 41.3% · R 56.5% · Other 2.2%
- 2008→2024 swing
- +9.2pp toward D · 2008: -24.5pp · 2024: -15.2pp
- All cycles
- 2024: R+15.2 2020: R+15.6 2016: R+22.9 2012: R+27.4 2008: R+24.5
Not yet ingested
- Civics
- —
Market trends
- HPI YoY
- ▼ -235.44%
- Current HPI
- 207.781
- Rent YoY
- ▲ 1.92%
- Metro
- Tulsa, OK
- State GDP YoY
- ▲ 1.55%
- F500 in state
- 6
Industry mix (Fortune 500 HQ in OK)
| Industry | F500 HQs | Revenue |
|---|---|---|
| Energy | 3 | $48B |
|
||
Price history
+305.8% since first listed3 events — show timeline
- 2026-04-18 Pending — MLS Technology, Inc.
- 2026-04-14 Listed $140,000 MLS Technology, Inc.
- 1990-08-08 Sold (Public Records) $34,500 Public Records
Property tax history
+2.2%/yrLatest (2025): $893 · +5.2% YoY. Source: county tax records.
Cash-flow waterfall
monthlySold comps — $/sqft
last 12 mo · ≤1 miLoading sold comps…