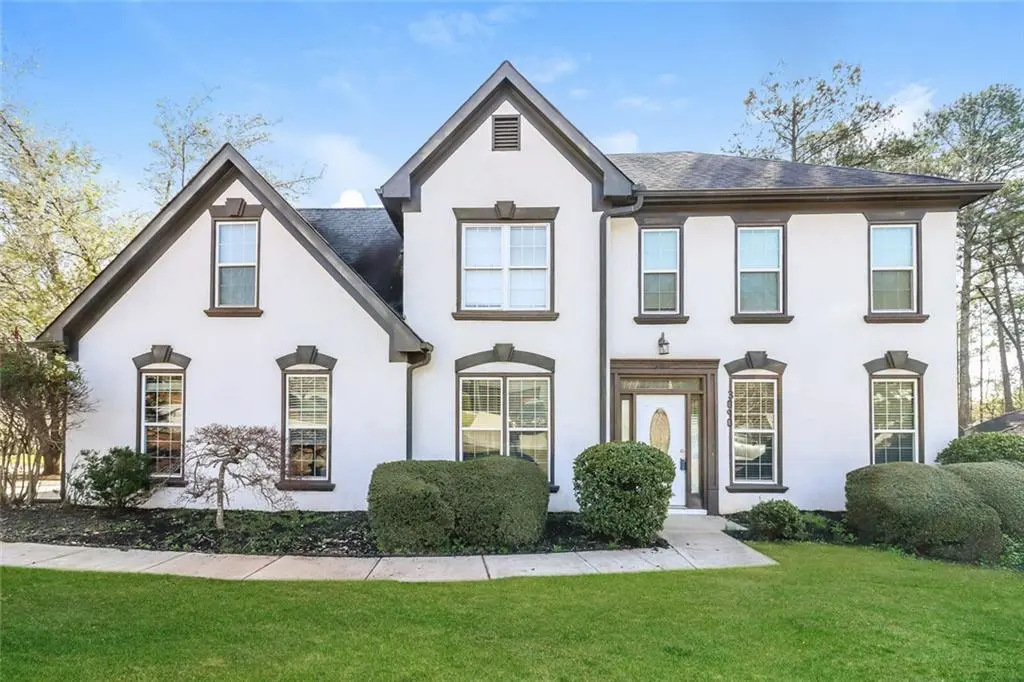
3090 Sherwood Oaks Ln · Stonecrest, GA
Flood risk 1/10 · Minimal
- FEMA flood zone
- X (unshaded)
- Chance of flooding over 30 yrs
- 0.0%
- Est. flood insurance / yr
- $507 – $1,088
Fire risk 1/10 · Minimal
- Est. fire insurance / yr
- $963 – $1,789
Heat risk 6/10 · Moderate
- Hot days now (above 105°F)
- 7 days/yr
- Hot days in 30 yrs
- 18 days/yr
Wind risk 5/10 · Moderate
- Chance of severe wind over 30 yrs
- 26.0%
Air-quality risk 5/10 · Moderate
- Unhealthy air days now
- 7 days/yr
- Unhealthy air days in 30 yrs
- 10 days/yr
Risk factors via First Street. Map © Google.
Why this score? — see what drove the D- grade
The composite is a weighted blend of 9 inputs, each scored 0–100. Each bar is that input's sub-score; the figure is the points it added to the 100-point composite (weight × sub-score).
- Cash flow +13.0/30.0
- ARV discount +9.2/15.0
- DSCR +3.9/10.0
- 1% rule +3.7/10.0
- Rent growth +3.0/5.0
- Livability +2.5/5.0
- Condition / age +2.5/5.0
- Schools +2.1/10.0
- Appreciation +0.0/10.0
$355,000
🖨 Deal sheet 📄 Offer letter ✓ Due diligence
Listing remarks MLS
An attractive residential property awaits at 3090 Sherwood Oaks Lane in Decatur, Georgia, US, presenting itself in great condition for its discerning owner. The living room offers a warm and inviting atmosphere, centered around a comforting fireplace, perfect for moments of relaxation. Elegant crown molding adorns the perimeter, adding a refined touch to the space. Culinary endeavors are elevated within the thoughtfully designed kitchen, featuring sophisticated stone countertops and a stylish backsplash. A practical kitchen bar and a convenient kitchen peninsula provide versatile spaces for dining and preparation, all complemented by exquisite crown molding. The bedroom provides a serene retreat, distinguished by an elegant tray ceiling that adds a sense of spaciousness and architectural interest. Refined crown molding enhances the room's sophisticated appeal. The bathroom offers a spa-like experience with its expansive double vanity, providing ample space for personal routines. A beautifully tiled shower completes this private sanctuary, ensuring comfort and convenience. This expansive residential property, built in 1994, encompasses a generous 2474 square feet of living area, designed to accommodate a comfortable and refined lifestyle, further enhanced by a generous walk-in closet. This property represents a distinguished opportunity for those seeking an attractive and well-appointed residence.
Key facts
- Kitchen bar
- Tray ceiling
- Stone countertops
Tags
Neighborhood map
What this means for you Summary
Snapshot
- This is a 4-bed/2.5-bath single-family listed at $355k.
Deal economics
- At list price, monthly cash flow is $-18 ($-214/yr) — negative.
- To cash-flow at today's rent, offer at most $352k (0.9% below list).
- To meet the 1% rule (rent ≥ 1% of price), the offer needs to be $308k (13.2% below list).
- Recommended offer: $308k (13.2% below list) — sets the bar for 1% rule.
- Cap rate 6.2% vs local median 5.1% in Stonecrest — meaningfully above typical; check what's discounted (condition, days-on-market, listing class) to confirm the premium yield is real.
Location & tenants
- Location reads: area grade D — affects rentability + tenant quality, not the cash-flow math above.
- Dekalb County (suburban): math 19% / reading 28% proficiency, ranked #125 of 174 in GA (top 72%) — low school quality limits family demand, transient renter base, plan for 1-2y turnover; 68% free/reduced lunch — lower-income household profile, screen leases tightly.
- Market conditions: Rents rising (+2.2%/yr); 353 active listings in the ZIP; 10 comparable units currently listed for rent nearby; rentals lingering (median 44d on market — plan ~5-8 weeks vacancy on turnover, expect pricing pressure); 60% of comp listings sitting > 30 days — soft ceiling on asking rent; 1,240 units permitted in DeKalb County in 2024 (385 in 5+ unit buildings).
- At $3,083/mo this rent would consume 58% of the median local household income ($64k/yr) (locally 1659% of renters already pay >50% of income on rent) — very limited rent-growth headroom before tenants either downsize or default.
Forward outlook
- Local home prices are declining (-3.0%/yr); year-one equity from $2k of loan paydown is wiped out by about $11k of value loss. Plan a longer hold.
- DeKalb County population projected at +28% by 2050 — long-run rental-demand tailwind backs the buy-and-hold thesis.
Negotiation context
- It's been on market 64 days — a 6% lower offer ($334k) is reasonable based on typical stale-listing flexibility.
- 10 sale attempts since 19y ago with the ask held roughly flat each time — persistent listings suggest the price (not the market) is what's stuck; bring a comps-based counter.
- Current owner paid $247k; 44% above their basis — modest negotiation headroom, anchor on the comps not their cost.
Risks & watch-outs
- Climate carrying-cost: moderate wind risk, 26% chance of damaging wind over 30y; extreme-heat days projected 7→18/yr by 2055 (HVAC capex compounding) — expect insurance premiums to compound above CPI over the hold.
Questions for the listing agent
- What do current leases actually rent for vs. the listed asking? Can we see a recent rent roll and the last 12 months of T-12 income?
- It's been on market 64 days. Have you received any prior offers? Is the seller open to a 13% concession, seller financing, or rate buy-down credit?
- Why hasn't it sold? Are there any deal-killer items the seller is aware of (foundation, flood, title, zoning, code violations)?
- Is there a deadline driving the sale (1031 exchange, divorce, estate, relocation)? That informs how much negotiation room exists.
- The area grade is low — what's the realistic commute time and amenity access for the typical tenant pool here? Any planned neighborhood developments (good or bad) we should know about?
- What's the average days-on-market for RENTAL listings here right now (not sales)? A rising rental-DOM trend means longer vacancies and softer asking-rent achievability than the comps imply.
- What's the recent tenant-quality profile in this submarket — average credit score on applications, eviction rate, late-payment / NSF rate, and stable-employment percentage? A property-management company in the area should have these aggregated.
- How much new for-sale + rental construction is in the pipeline within 1–3 miles? Heavy new supply typically softens prices + rents 12–24 months out; constrained supply supports both.
Investment metrics
- 1% rule
- 0.87% ✗
- Cap rate
- 6.23%
- Cash-on-cash
- -0.22%
- DSCR
- 0.99
- GRM
- 9.6
CMA / ARV
- ARV (median comp)
- $368,717
- List price
- $355,000
- Delta
- -3.72%
- Verdict
- FAIR
- Comps
- 20 within 1.0 mi
Show comp detail 12 sales within ~0.75 mi
| Address | Dist | Beds/Ba | Sqft | Sold | Price | $/sf | Match |
|---|---|---|---|---|---|---|---|
| 3090 Sherwood Oaks Ln | 0.00mi | 4/2.5 | 2,474 (0%) | 0mo | $355,000 | $143 | 100 |
| 4139 Casa Loma Dr | 0.35mi | 4/2.5 | 2,294 (-7%) | 2mo | $130,000 | $57 | 70 |
| 3180 Lamp Post Ct | 0.28mi | 4/3.0 | 2,290 (-7%) | 5mo | $180,000 | $79 | 68 |
| 3042 Cobb Trl | 0.14mi | 4/3.0 | 2,800 (+13%) | 6mo | $360,000 | $129 | 64 |
| 4108 Casa Loma Dr | 0.36mi | 5/3.0 (+1) | 2,590 (+5%) | 6mo | $200,000 | $77 | 63 |
| 4134 Dunmore Rd | 0.49mi | 4/2.0 | 2,344 (-5%) | 8mo | $338,000 | $144 | 60 |
| 4441 Sterling Forest Dr | 0.60mi | 5/3.0 (+1) | 2,474 (0%) | 6mo | $350,000 | $141 | 60 |
| 3222 Wyndham Park Ct | 0.33mi | 3/2.0 (-1) | 2,286 (-8%) | 7mo | $349,500 | $153 | 59 |
| 3947 Veracruz Ct | 0.65mi | 5/2.5 (+1) | 2,522 (+2%) | 10mo | $309,900 | $123 | 53 |
| 3076 Briarleaf Dr | 0.62mi | 3/2.5 (-1) | 2,300 (-7%) | 6mo | $210,000 | $91 | 49 |
| 3127 Snapfinger Ct | 0.70mi | 3/2.5 (-1) | 2,186 (-12%) | 1mo | $185,000 | $85 | 42 |
| 3182 Wakefield Dr | 0.68mi | 4/2.5 | 2,150 (-13%) | 12mo | $385,000 | $179 | 37 |
Match score weights: distance 35% · size 25% · config 20% · recency 20%. Top-matched comps best support the ARV.
Projected returns pro-forma
-3.0% appreciation · 2.18% rent growth · sell at horizon
- IRR
- -17.6%
- Equity multiple
- 0.38×
- Total profit
- $-61,140
- Equity at exit
- $52,932
- IRR
- -11.2%
- Equity multiple
- 0.35×
- Total profit
- $-64,700
- Equity at exit
- $30,694
Cash invested: $99,400 (down + closing). Projections, not guarantees.
Landlord ↔ Tenant lean methodology
- Overall (STATE)
- 90 Strongly Landlord-Friendly
- State Georgia
- 90 Strongly Landlord-Friendly · R+3
- County
- — inherits STATE
- City
- — inherits STATE
ZIP-level market 30034
- Home prices YoY
- -27.4%
- Rents YoY
- 2.2%
- Active inventory
- 353
- Price-to-rent
- 9.6×
Monthly cashflow live
- Estimated rent
- $3,083 high interval (Pro) →
- Mortgage (P&I)
- −$1,862
- Tax from tax record
- −$444 /mo · $5,324/yr
- Insurance
- −$148
- HOA
- −$0
- Vacancy / Maint / Mgmt
- −$647
- Net cashflow
- $-18
Break-even live
UW: 25.0% down · 7.5% · 30yr · 1.5% tax · 5.0% vac · 8.0% maint · 8.0% mgmt
Financing live
Cash to close
- Down payment
- $88,750
- Closing costs
- $10,650
- Reserves months
- —
- Total cash needed
- —
Loan-product check · same deal, 3 products live
Conventional
25% down · 7.5% · 30yr
- Down + closing
- —
- Monthly P&I
- —
- Monthly cashflow
- —
- DSCR
- —
- Eligible?
- —
Personal DTI + credit; lowest rate.
DSCR
20% down · 8.5% · 30yr
- Down + closing
- —
- Monthly P&I
- —
- Monthly cashflow
- —
- DSCR
- —
- Eligible?
- —
No personal income docs; deal must DSCR.
Hard money
10% down · 12.0% · 12mo
- Down + closing
- —
- Monthly P&I
- —
- Monthly cashflow
- —
- DSCR
- —
- Eligible?
- —
Short-term bridge; refi at stabilization.
Rent comps 10 comps
| Address | Beds | Baths | Sqft | Rent | $/sqft | DOM | Units | Dist |
|---|---|---|---|---|---|---|---|---|
| 3170 Sherwood Oaks Ct Decatur, GA | 4.0 | 2.5 | 2987 | $3,200 | $1.07 | 1d | 1 | 0.16mi |
| 2884 Thompson Cir Decatur, GA | 4.0 | 3.5 | 2868 | $6,400 | $2.23 | 24d | 1 | 0.87mi |
| 3095 Riders Trl Decatur, GA | 3.0 | 2.0 | 1800 | $4,500 | $2.50 | 1d | 1 | 0.90mi |
| 2692 Paxton PL #14 Decatur, GA | 3.0 | 2.5 | 1611 | $2,299 | $1.43 | 43d | 1 | 1.09mi |
| 2564 Treadway Dr Decatur, GA | 3.0 | 2.0 | 1927 | $2,950 | $1.53 | 43d | 1 | 1.14mi |
| 4282 Callum Ct Decatur, GA | 3.0 | 2.5 | 1611 | $2,200 | $1.37 | 43d | 1 | 1.16mi |
| 4292 Callum Ct Decatur, GA | 3.0 | 2.5 | 1611 | $2,200 | $1.37 | 43d | 1 | 1.16mi |
| 3651 Columbia Pkwy Decatur, GA | 3.0 | 2.0 | 1958 | $1,920 | $0.98 | 43d | 1 | 1.28mi |
| 3009 Donavan Way Decatur, GA | 3.0 | 2.5 | 2025 | $1,850 | $0.91 | 24d | 1 | 1.28mi |
| 3604 Spring Trce Decatur, GA | 3.0 | 2.5 | 1806 | $1,595 | $0.88 | 43d | 1 | 1.48mi |
Listing history 44 events
-
2026-03-17$355,000 New 1419-char remark
Show marketing remark (1419 chars)
An attractive residential property awaits at 3090 Sherwood Oaks Lane in Decatur, Georgia, US, presenting itself in great condition for its discerning owner. The living room offers a warm and inviting atmosphere, centered around a comforting fireplace, perfect for moments of relaxation. Elegant crown molding adorns the perimeter, adding a refined touch to the space. Culinary endeavors are elevated within the thoughtfully designed kitchen, featuring sophisticated stone countertops and a stylish backsplash. A practical kitchen bar and a convenient kitchen peninsula provide versatile spaces for dining and preparation, all complemented by exquisite crown molding. The bedroom provides a serene retreat, distinguished by an elegant tray ceiling that adds a sense of spaciousness and architectural interest. Refined crown molding enhances the room's sophisticated appeal. The bathroom offers a spa-like experience with its expansive double vanity, providing ample space for personal routines. A beautifully tiled shower completes this private sanctuary, ensuring comfort and convenience. This expansive residential property, built in 1994, encompasses a generous 2474 square feet of living area, designed to accommodate a comfortable and refined lifestyle, further enhanced by a generous walk-in closet. This property represents a distinguished opportunity for those seeking an attractive and well-appointed residence.
-
2026-03-17$355,000 Active 1419-char remark
Show marketing remark (1419 chars)
An attractive residential property awaits at 3090 Sherwood Oaks Lane in Decatur, Georgia, US, presenting itself in great condition for its discerning owner. The living room offers a warm and inviting atmosphere, centered around a comforting fireplace, perfect for moments of relaxation. Elegant crown molding adorns the perimeter, adding a refined touch to the space. Culinary endeavors are elevated within the thoughtfully designed kitchen, featuring sophisticated stone countertops and a stylish backsplash. A practical kitchen bar and a convenient kitchen peninsula provide versatile spaces for dining and preparation, all complemented by exquisite crown molding. The bedroom provides a serene retreat, distinguished by an elegant tray ceiling that adds a sense of spaciousness and architectural interest. Refined crown molding enhances the room's sophisticated appeal. The bathroom offers a spa-like experience with its expansive double vanity, providing ample space for personal routines. A beautifully tiled shower completes this private sanctuary, ensuring comfort and convenience. This expansive residential property, built in 1994, encompasses a generous 2474 square feet of living area, designed to accommodate a comfortable and refined lifestyle, further enhanced by a generous walk-in closet. This property represents a distinguished opportunity for those seeking an attractive and well-appointed residence.
-
2024-12-12historical $2,520
-
2024-12-05$2,520
-
2019-07-10historical
-
2019-07-08soldstatus $247,000
-
2019-07-03soldstatus $247,000 Closed
-
2019-07-03soldstatus $247,000 Sold
-
2019-06-10status Pending Offer Approval
-
2019-06-10status Pending
-
2019-05-29price $247,500
-
2019-05-29price $247,500
-
2019-04-24price $249,900
-
2019-04-07price $259,900
-
2019-04-07price $259,900
-
2019-03-21$279,900 Active
-
2019-03-21$279,900 New
-
2016-09-20soldstatus $128,000
-
2016-09-16soldstatus $128,000 Sold
-
2016-09-16soldstatus $128,000 Sold
-
2016-08-26status Under Contract
-
2016-08-26historical Pending
-
2016-08-20price $149,900
-
2016-08-20price $149,900
-
2016-08-19status Back on Market
-
2016-08-19status Active
-
2016-08-10status Under Contract
-
2016-08-10historical Pending
-
2016-08-06price $138,000
-
2016-08-06price $138,000
-
2016-07-08$139,000 Active
-
2016-06-23$139,000 New
-
2010-10-12price $124,900
-
2010-08-13price $129,900
-
2010-07-16price $134,900
-
2010-06-10historical
-
2010-03-01soldstatus $90,000
-
2010-02-25status Pending
-
2010-02-15historical
-
2010-02-15soldstatus $90,000 Sold
-
2009-12-17price $110,000 Reduced
-
2009-12-16price $110,000
-
2007-02-09soldstatus $164,900
-
2007-01-23$164,900
ⓘ Source: listings_history table (triggers on properties + properties_extension) + one-shot
backfill from property_details.listing_events for pre-trigger history.
Tax reassessment forecast GA · Resets to sale price
- Current annual tax
- $5,324 · $444/mo
- Projected year-2 tax
- $5,324 · $444/mo
- Expected delta
- $0/yr ($0/mo · 0.0%)
ⓘ Screening estimate from a state-policy table — verify with the county assessor before closing.
Climate risk First Street
- Flood 1/10 Low FEMA zone X (unshaded) · 0% chance over 30 yrs
- Wildfire 1/10 Low
- Heat 6/10 Major 7 d/yr ≥105°F today · 18 d/yr by 30 yrs out
- Wind 5/10 Major 26% chance of damaging wind over 30 yrs
- Air quality 5/10 Major 7 unhealthy d/yr today · 10 by 30 yrs out
Nearby sold comps map
Loading sold comps map…
Walkable amenities ~0.75 mi
Loading nearby amenities…
Taxation est. · year 1
- Rental income
- $36,993
- − Mortgage interest
- −$19,886
- − Property taxes
- −$5,324
- − Insurance
- −$1,775
- − Repairs & maintenance
- −$2,959
- − Management
- −$2,959
- − Depreciation
- −$10,327
- Taxable loss
- −$6,238
- Est. tax savings @ 24.0%
- +$1,497
- After-tax cash flow
- $1,283/yr
For passive investors: Depreciation is non-cash, so a rental often shows a tax loss while cash-flowing — sheltering income. Rental losses are passive: they offset passive income freely, and up to $25,000/yr can offset ordinary (W-2) income if you actively participate and your MAGI is under $100k (phasing out to $0 by $150k); unused losses carry forward. On sale, claimed depreciation is recaptured at up to 25%, and gains may owe capital-gains tax (a 1031 exchange can defer both). Figures are a year-1 estimate at your 24.0% rate — not tax advice; consult a CPA.
Schools (NCES district)
- District
- Dekalb County
- NCES district ID
- 1301740
- Math proficiency
- 19% ▼ -12.00%
- Reading proficiency
- 28% ▼ -7.00%
- Median HH income
- $51,448
- Composite
- 20.92/100
- National rank
- #8482
- State rank
- #125 of 174 in GA
Livability — Stonecrest
No livability data for this city. (Only ~50 U.S. cities are tracked.)
Census & demographics
- County
- Dekalb County · 782,738 people
- City population
- 106,165
- Metro
- Atlanta-Sandy Springs-Alpharetta, GA
- Population (ZIP)
- 41,847
- Household income
- $63,517
- Rent vs Own
- Severe rent burden
- 1659.0
Population outlook (DeKalb County) Hauer SSP2
- Today (2025)
- 839,977 people
- By 2030
- 891,768 · +6.2%
- By 2040
- 988,894 · +17.7%
- By 2050
- 1,074,583 · +27.9%
- By 2075
- 1,245,026 · +48.2%
- By 2100
- 1,303,135 · +55.1%
Race, ethnicity, and origin ACS 2023
- Neighborhood character
- Predominantly Black (90%)
- Race & ethnicity
- Black 90% White 4% Two or more races 3% Hispanic / Latino 2%
- Common ancestry
- Hispanic 1% Lithuanian 1%
- Foreign-born
- 8% · Canada
- Languages at home
- 93% English-only · Spanish 2% French/Haitian/Cajun 1%
Political lean MEDSL · DeKalb
- 2024 margin
- Solid D (+64.8) · D 81.9% · R 17.1% · Other 1.0%
- 2008→2024 swing
- +6.1pp toward D · 2008: 58.6pp · 2024: 64.8pp
- All cycles
- 2024: D+64.8 2020: D+67.4 2016: D+64.8 2012: D+56.8 2008: D+58.6
Not yet ingested
- Civics
- —
Market trends
- HPI YoY
- ▼ -78.92%
- Current HPI
- 209.5638
- Rent YoY
- ▲ 2.18%
- Metro
- Atlanta-Sandy Springs-Alpharetta, GA
- State GDP YoY
- ▲ 2.66%
- F500 in state
- 28
Industry mix (Fortune 500 HQ in GA)
| Industry | F500 HQs | Revenue |
|---|---|---|
| Paper / Packaging | 2 | $29B |
|
||
| Retail | 1 | $160B |
|
||
| Transportation / Logistics | 1 | $91B |
|
||
| Airlines | 1 | $62B |
|
||
| Consumer Goods | 1 | $47B |
|
||
| Utilities | 1 | $25B |
|
||
Price history
+115.3% since first listed44 events — show timeline
- 2026-03-17 Listed $355,000 FMLS
- 2026-03-17 Listed $355,000 GAMLS
- 2024-12-12 Rental Removed $2,520 RENTLY
- 2024-12-05 Listed for Rent $2,520 RENTLY
- 2019-07-10 Listing Removed — FMLS
- 2019-07-08 Sold (Public Records) $247,000 Public Records
- 2019-07-03 Sold (MLS) $247,000 GAMLS
- 2019-07-03 Sold (MLS) $247,000 FMLS
- 2019-06-10 Pending — GAMLS
- 2019-06-10 Pending — FMLS
- 2019-05-29 Price Changed $247,500 GAMLS
- 2019-05-29 Price Changed $247,500 FMLS
- 2019-04-24 Price Changed $249,900 GAMLS
- 2019-04-07 Price Changed $259,900 GAMLS
- 2019-04-07 Price Changed $259,900 FMLS
- 2019-03-21 Listed $279,900 GAMLS
- 2019-03-21 Listed $279,900 FMLS
- 2016-09-20 Sold (Public Records) $128,000 Public Records
- 2016-09-16 Sold (MLS) $128,000 GAMLS
- 2016-09-16 Sold (MLS) $128,000 FMLS
- 2016-08-26 Pending — GAMLS
- 2016-08-26 Contingent — FMLS
- 2016-08-20 Price Changed $149,900 GAMLS
- 2016-08-20 Price Changed $149,900 FMLS
- 2016-08-19 Relisted — GAMLS
- 2016-08-19 Relisted — FMLS
- 2016-08-10 Pending — GAMLS
- 2016-08-10 Contingent — FMLS
- 2016-08-06 Price Changed $138,000 GAMLS
- 2016-08-06 Price Changed $138,000 FMLS
- 2016-07-08 Listed $139,000 FMLS
- 2016-06-23 Listed $139,000 GAMLS
- 2010-10-12 Price Changed $124,900 GAMLS
- 2010-08-13 Price Changed $129,900 GAMLS
- 2010-07-16 Price Changed $134,900 GAMLS
- 2010-06-10 Listing Removed — FMLS
- 2010-03-01 Sold (Public Records) $90,000 Public Records
- 2010-02-25 Pending — FMLS
- 2010-02-15 Listing Removed — FMLS
- 2010-02-15 Sold (MLS) $90,000 FMLS
- 2009-12-17 Price Changed $110,000 GAMLS
- 2009-12-16 Price Changed $110,000 FMLS
- 2007-02-09 Sold (MLS) $164,900 FMLS
- 2007-01-23 Listed $164,900 FMLS
Property tax history
+2.2%/yrLatest (2025): $5,324 · -3.3% YoY. Source: county tax records.
Cash-flow waterfall
monthlySold comps — $/sqft
last 12 mo · ≤1 miLoading sold comps…