 Multi-family
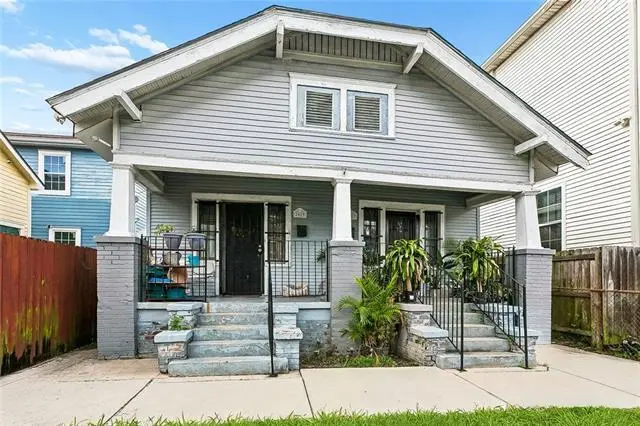
2617 S Saratoga St · New Orleans, LA
Flood risk 8/10 · Major
- FEMA flood zone
- X
- Chance of flooding over 30 yrs
- 0.73%
- Est. flood insurance / yr
- $507 – $1,088
Fire risk 1/10 · Minimal
- Est. fire insurance / yr
- $1,269 – $2,357
Heat risk 10/10 · Severe
- Hot days now (above 108°F)
- 7 days/yr
- Hot days in 30 yrs
- 21 days/yr
Wind risk 10/10 · Severe
- Chance of severe wind over 30 yrs
- 99.0%
Air-quality risk 3/10 · Minor
- Unhealthy air days now
- 3 days/yr
- Unhealthy air days in 30 yrs
- 4 days/yr
Risk factors via First Street. Map © Google.
Why this score? — see what drove the B+ grade
The composite is a weighted blend of 9 inputs, each scored 0–100. Each bar is that input's sub-score; the figure is the points it added to the 100-point composite (weight × sub-score).
- Cash flow +30.0/30.0
- 1% rule +10.0/10.0
- DSCR +10.0/10.0
- Appreciation +10.0/10.0
- ARV discount +6.1/15.0
- Rent growth +4.0/5.0
- Livability +4.0/5.0
- Condition / age +2.5/5.0
- Schools +1.6/10.0
$160,000
🖨 Deal sheet 📄 Offer letter ✓ Due diligence
Multi-family units
County records classify this as Multi-Family (2-4 Unit). Listing-text estimate: 1 unit. estimate disagrees with records
Listing remarks MLS
Calling all investors! Historic double in convenient location with quick access to St. Charles Avenue, I-10, the Uptown parade route, and more! Fully rented with current monthly rental income of $2,090 with potential for more. High ceilings throughout and spacious front porch. This property is part of a portfolio of several multi-family properties in the surrounding area that can be sold together. Great investment opportunity!
Key facts
- Historic double
- Spacious front porch
- Convenient location
Tags
Property features AI
Finance
- Financial info: Property is a 2-unit multi-family
Exterior
- Utilities: Public water; Public sewer
- Home design: Single-story; Wood siding; Shingle roof
- Construction: Wood siding construction; Shingle roof; Raised foundation
- Exterior features: City lot; Rectangular lot; Lot dimensions approximately 31' x 61'
Interior
- Bedrooms: 2 total units (multi-family)
- Bathrooms: 2 full bathrooms
- Heating & cooling: Central heating; Central air conditioning
- Interior features: Average condition; Raised foundation
Neighborhood map
What this means for you Summary
Snapshot
- This is a 2-bed/2.0-bath multifamily listed at $160k.
Deal economics
- At list price, monthly cash flow is $1k ($12k/yr) — positive.
- The deal already cash-flows at list — no discount required.
- Meets the 1% rule at list price ($3k rent vs $160k).
- Recommended offer: $158k (1.5% below list) — sets the bar for market timing.
- Cap rate 14.5% vs local median 4.4% in New Orleans — top-decile yield for the area; either an underpriced asset or a hidden risk that comps aren't pricing in. Stress-test before assuming the spread holds.
Location & tenants
- Location reads 81/100 on livability (#3 in LA, #1,383 nationally) — a professional / high-income tenant draw. Strengths: amenities A+, commute A+, health & safety A+; Watch: crime C-, employment D.
- Orleans Parish (urban): math 11% / reading 27% proficiency, ranked #69 of 98 in LA (top 70%) — low school quality limits family demand, transient renter base, plan for 1-2y turnover; 68% free/reduced lunch — lower-income household profile, screen leases tightly.
- Market conditions: Rents rising fast (+6.0%/yr); 137 active listings in the ZIP; 40 comparable units currently listed for rent nearby; rentals at typical pace (median 20d on market — plan ~3-4 weeks tenant-placement turnaround); lower-income renter base — watch delinquency; 710 units permitted in Orleans Parish in 2024 (244 in 5+ unit buildings).
Forward outlook
- In year one you build about $17k of equity ($1k loan paydown + $16k appreciation (10.0% local appreciation)).
- Orleans County population projected at +61% by 2050 — long-run rental-demand tailwind backs the buy-and-hold thesis.
- At projected returns (10.0% appreciation + 6.0% rent growth), your $45k cash investment doubles in ~2 years — after that, you're playing with house money.
- By year 3, paydown + projected appreciation supports a ~$43k cash-out refi (75% LTV) — recoverable capital for the next deal without selling this one.
Negotiation context
- It's been on market 28 days — a 2% lower offer ($158k) is reasonable based on typical stale-listing flexibility.
- 4 sale attempts since 32y ago with the ask held roughly flat each time — persistent listings suggest the price (not the market) is what's stuck; bring a comps-based counter.
- Current owner paid $6k; list at $160k implies a 2707% gain — meaningful room to come down on a strong offer.
Risks & watch-outs
- Watch-outs: flood insurance adds $66/mo; built in 1934 — expect roof / HVAC / electrical / plumbing capex.
- Climate carrying-cost: severe flood risk; severe wind risk, 99% chance of damaging wind over 30y; extreme-heat days projected 7→21/yr by 2055 (HVAC capex compounding) — expect insurance premiums to compound above CPI over the hold.
Questions for the listing agent
- Built in 1934 — when were the roof, HVAC, electrical panel, plumbing, and water heater last replaced?
- What's the actual annual flood-insurance premium (NFIP or private), and is the property in a SFHA with mandatory coverage?
- Is there a deadline driving the sale (1031 exchange, divorce, estate, relocation)? That informs how much negotiation room exists.
- What's the average days-on-market for RENTAL listings here right now (not sales)? A rising rental-DOM trend means longer vacancies and softer asking-rent achievability than the comps imply.
- What's the recent tenant-quality profile in this submarket — average credit score on applications, eviction rate, late-payment / NSF rate, and stable-employment percentage? A property-management company in the area should have these aggregated.
- How much new apartment / multifamily construction is in the pipeline within 1–3 miles? Heavy new supply (>2% of stock underway) typically softens rents 12–24 months out; light construction supports rent growth.
Investment metrics
- 1% rule
- 1.69% ✓
- Cap rate
- 14.48%
- Cash-on-cash
- 29.24%
- DSCR
- 2.30
- GRM
- 4.9
CMA / ARV
- ARV (on-the-fly)
- $155,250
- Comps found
- 2
Show comp detail 2 sales within ~0.75 mi
| Address | Dist | Beds/Ba | Sqft | Sold | Price | $/sf | Match |
|---|---|---|---|---|---|---|---|
| 2717 S Liberty St | 0.14mi | 2/3.0 | 1,154 (+0%) | 9mo | $72,000 | $62 | 81 |
| 2304-06 6th St | 0.24mi | 2/2.0 | 1,183 (+3%) | 10mo | $159,900 | $135 | 76 |
Match score weights: distance 35% · size 25% · config 20% · recency 20%. Top-matched comps best support the ARV.
Projected returns pro-forma
10.0% appreciation · 5.98% rent growth · sell at horizon
- IRR
- 46.9%
- Equity multiple
- 4.59×
- Total profit
- $160,832
- Equity at exit
- $144,141
- IRR
- 42.0%
- Equity multiple
- 10.85×
- Total profit
- $441,501
- Equity at exit
- $310,845
Cash invested: $44,800 (down + closing). Projections, not guarantees.
Landlord ↔ Tenant lean methodology
- Overall (STATE)
- 90 Strongly Landlord-Friendly
- State Louisiana
- 90 Strongly Landlord-Friendly · R+12
- County
- — inherits STATE
- City
- — inherits STATE
ZIP-level market 70113
- Rents YoY
- 6.0%
- Active inventory
- 137
- Price-to-rent
- 9.9×
Monthly cashflow live
- Estimated rent
- $2,707 high interval (Pro) →
- Mortgage (P&I)
- −$839
- Tax from tax record
- −$141 /mo · $1,695/yr
- Insurance
- −$67
- Flood insurance flood zone
- −$66 /mo · $798/yr
- HOA
- −$0
- Vacancy / Maint / Mgmt
- −$568
- Net cashflow
- $1,025
Break-even live
2-unit breakdown (identical units grouped — click to expand)
| Units | Beds | Baths | Est. rent |
|---|---|---|---|
| 2× units | 2 | 1 | $2,706 |
| #1 | 2 | 1 | $1,353 |
| #2 | 2 | 1 | $1,353 |
| Total (2 units) | $2,707 | ||
UW: 25.0% down · 7.5% · 30yr · 1.5% tax · 5.0% vac · 8.0% maint · 8.0% mgmt
Financing live
Cash to close
- Down payment
- $40,000
- Closing costs
- $4,800
- Reserves months
- —
- Total cash needed
- —
Loan-product check · same deal, 3 products live
Conventional
25% down · 7.5% · 30yr
- Down + closing
- —
- Monthly P&I
- —
- Monthly cashflow
- —
- DSCR
- —
- Eligible?
- —
Personal DTI + credit; lowest rate.
DSCR
20% down · 8.5% · 30yr
- Down + closing
- —
- Monthly P&I
- —
- Monthly cashflow
- —
- DSCR
- —
- Eligible?
- —
No personal income docs; deal must DSCR.
Hard money
10% down · 12.0% · 12mo
- Down + closing
- —
- Monthly P&I
- —
- Monthly cashflow
- —
- DSCR
- —
- Eligible?
- —
Short-term bridge; refi at stabilization.
Rent comps 40 comps
| Address | Beds | Baths | Sqft | Rent | $/sqft | DOM | Units | Dist |
|---|---|---|---|---|---|---|---|---|
| 2107 Fourth St New Orleans, LA | 3.0 | 1.0 | 1292 | $1,775 | $1.37 | 16d | 1 | 0.02mi |
| 2605 Danneel St Unit A New Orleans, LA | 2.0 | 1.0 | 830 | $1,350 | $1.63 | 23d | 1 | 0.08mi |
| 2717 Loyola Ave New Orleans, LA | 3.0 | 2.0 | 1250 | $2,300 | $1.84 | 1d | 1 | 0.08mi |
| 2717 Loyola Ave New Orleans, LA | 3.0 | 2.0 | 1232 | $2,300 | $1.87 | 23d | 1 | 0.08mi |
| 2220 4th St New Orleans, LA | 1.0 | 1.0 | 937 | $1,650 | $1.76 | 23d | 1 | 0.09mi |
| 2222 Fourth St New Orleans, LA | 2.0 | 1.5 | 937 | $1,550 | $1.65 | 23d | 1 | 0.09mi |
| 2227 Second St New Orleans, LA | 2.0 | 2.0 | 1100 | $1,900 | $1.73 | 23d | 1 | 0.13mi |
| 2225 2nd St New Orleans, LA | 3.0 | 2.0 | 1100 | $1,800 | $1.64 | 23d | 1 | 0.14mi |
| 2705 Dryades St New Orleans, LA | 2.0 | 1.0 | 1100 | $2,000 | $1.82 | 23d | 1 | 0.14mi |
| 1908 Washington Ave Unit NA New Orleans, LA | 2.0 | 2.5 | 1498 | $2,100 | $1.40 | 20d | 1 | 0.17mi |
| 2714 Dryades St Unit A New Orleans, LA | 2.0 | 2.0 | 919 | $1,500 | $1.63 | 3d | 1 | 0.18mi |
| 1811 Third St Unit 1811 New Orleans, LA | 2.0 | 1.0 | 800 | $1,450 | $1.81 | 3d | 1 | 0.20mi |
| 1915 Philip St New Orleans, LA | 3.0 | 1.5 | 1300 | $2,450 | $1.88 | 23d | 1 | 0.22mi |
| 2840 Dryades St Unit 2838 New Orleans, LA | 2.0 | 2.0 | 1000 | $1,595 | $1.59 | 2d | 1 | 0.22mi |
| 2919 Dryades St New Orleans, LA | 2.0 | 1.0 | 750 | $1,300 | $1.73 | 21d | 1 | 0.26mi |
| 2934 Dryades St New Orleans, LA | 1.0 | 1.0 | 750 | $1,200 | $1.60 | 3d | 1 | 0.28mi |
| 2934 Dryades St New Orleans, LA | 1.0 | 1.0 | 750 | $1,200 | $1.60 | 2d | 1 | 0.28mi |
| 2429 Freret St New Orleans, LA | 2.0 | 1.0 | 725 | $1,300 | $1.79 | 3d | 1 | 0.29mi |
| 1635 2nd St New Orleans, LA | 2.0 | 1.0 | 1500 | $2,175 | $1.45 | 15d | 1 | 0.31mi |
| 2503 First St New Orleans, LA | 2.0 | 1.0 | 741 | $1,200 | $1.62 | 3d | 1 | 0.31mi |
| 2503 First St New Orleans, LA | 2.0 | 1.0 | 741 | $1,200 | $1.62 | 2d | 1 | 0.31mi |
| 1618 3rd St New Orleans, LA | 2.0 | 1.0 | 1210 | $1,850 | $1.53 | 23d | 1 | 0.32mi |
| 1618 3rd St New Orleans, LA | 1.0 | 1.0 | 900 | $1,350 | $1.50 | 16d | 1 | 0.32mi |
| 2931 Baronne St New Orleans, LA | 3.0 | 1.0 | 1145 | $1,510 | $1.32 | 23d | 1 | 0.32mi |
| 1719 Seventh St Unit A New Orleans, LA | 2.0 | 1.0 | 1093 | $1,525 | $1.40 | 23d | 1 | 0.34mi |
| 1635 Sixth St Apt 4 New Orleans, LA | 1.0 | 1.0 | 1005 | $2,000 | $1.99 | 23d | 1 | 0.34mi |
| 2123 S Liberty St Unit 2125 New Orleans, LA | 3.0 | 2.0 | 1500 | $2,100 | $1.40 | 3d | 1 | 0.34mi |
| 2919 Carondelet St Unit C New Orleans, LA | 2.0 | 1.0 | 766 | $1,350 | $1.76 | 23d | 1 | 0.35mi |
| 2915 Carondelet St New Orleans, LA | 2.0 | 1.0 | 949 | $1,510 | $1.59 | 23d | 1 | 0.35mi |
| 2119 Josephine St New Orleans, LA | 3.0 | 1.0 | 1017 | $950 | $0.93 | 21d | 1 | 0.36mi |
| 1618 Philip St New Orleans, LA | 2.0 | 2.0 | 1200 | $1,950 | $1.62 | 23d | 1 | 0.36mi |
| 3324 S Saratoga St Unit 201 New Orleans, LA | 2.0 | 1.0 | 1200 | $2,000 | $1.67 | 21d | 1 | 0.37mi |
| 1706 Seventh St Unit B New Orleans, LA | 2.0 | 1.0 | 1158 | $1,550 | $1.34 | 23d | 1 | 0.37mi |
| 2255 Saint Charles Ave Unit 207 New Orleans, LA | 1.0 | 1.0 | 750 | $1,395 | $1.86 | 16d | 1 | 0.40mi |
| 3317 Dryades St New Orleans, LA | 2.0 | 2.0 | 900 | $1,700 | $1.89 | 16d | 1 | 0.40mi |
| 2032 Saint Andrew St New Orleans, LA | 3.0 | 2.0 | 1035 | $1,830 | $1.77 | 16d | 1 | 0.40mi |
| 1715 Jackson Ave Unit B New Orleans, LA | 2.0 | 2.0 | 1200 | $1,850 | $1.54 | 1d | 1 | 0.40mi |
| 2931 Saint Charles Ave New Orleans, LA | 2.0 | 2.0 | 900 | $2,800 | $3.11 | 16d | 1 | 0.41mi |
| 2013 S Liberty St Apt 202 New Orleans, LA | 2.0 | 1.0 | 750 | $1,075 | $1.43 | 11d | 1 | 0.41mi |
| 2013 S Liberty St Unit 304 New Orleans, LA | 2.0 | 1.0 | 700 | $1,095 | $1.56 | 14d | 1 | 0.41mi |
Listing history 19 events
-
2026-06-18days on market $160,000 Active 28 DOM
-
2026-06-17days on market $160,000 Active 27 DOM
-
2026-06-16days on market $160,000 Active 26 DOM
-
2026-06-15days on market $160,000 Active 25 DOM
-
2026-06-13days on market $160,000 Active 23 DOM
-
2026-06-10days on market $160,000 Active 20 DOM
-
2026-06-09days on market $160,000 Active 19 DOM
-
2026-06-08days on market $160,000 Active 18 DOM
-
2026-06-07days on market $160,000 Active 17 DOM
-
2026-06-05days on market $160,000 Active 14 DOM
-
2026-06-03days on market $160,000 Active 13 DOM
-
2026-06-02days on market $160,000 Active 12 DOM
-
2026-06-01days on market $160,000 Active 11 DOM
-
2026-05-31days on market $160,000 Active 10 DOM
-
2026-05-21$160,000 Active
Show marketing remark (430 chars)
Calling all investors! Historic double in convenient location with quick access to St. Charles Avenue, I-10, the Uptown parade route, and more! Fully rented with current monthly rental income of $2,090 with potential for more. High ceilings throughout and spacious front porch. This property is part of a portfolio of several multi-family properties in the surrounding area that can be sold together. Great investment opportunity!
-
2026-05-21$160,000 Active 430-char remark
Show marketing remark (430 chars)
Calling all investors! Historic double in convenient location with quick access to St. Charles Avenue, I-10, the Uptown parade route, and more! Fully rented with current monthly rental income of $2,090 with potential for more. High ceilings throughout and spacious front porch. This property is part of a portfolio of several multi-family properties in the surrounding area that can be sold together. Great investment opportunity!
-
1995-05-01soldstatus $5,700
-
1994-10-04$13,000
-
1994-10-04$13,000
ⓘ Source: listings_history table (triggers on properties + properties_extension) + one-shot
backfill from property_details.listing_events for pre-trigger history.
Tax reassessment forecast LA · Resets to sale price
- Current annual tax
- $1,695 · $141/mo
- Projected year-2 tax
- $1,695 · $141/mo
- Expected delta
- $0/yr ($0/mo · 0.0%)
ⓘ Screening estimate from a state-policy table — verify with the county assessor before closing.
Climate risk First Street
- Flood 8/10 Severe FEMA zone X · 73% chance over 30 yrs
- Wildfire 1/10 Low
- Heat 10/10 Extreme 7 d/yr ≥108°F today · 21 d/yr by 30 yrs out
- Wind 10/10 Extreme 99% chance of damaging wind over 30 yrs
- Air quality 3/10 Moderate 3 unhealthy d/yr today · 4 by 30 yrs out
Nearby sold comps map
Loading sold comps map…
Walkable amenities ~0.75 mi
Loading nearby amenities…
Taxation est. · year 1
- Rental income
- $32,484
- − Mortgage interest
- −$8,962
- − Property taxes
- −$1,695
- − Insurance
- −$1,598
- − Repairs & maintenance
- −$2,599
- − Management
- −$2,599
- − Depreciation
- −$4,655
- Taxable income
- $10,377
- Est. tax owed @ 24.0%
- −$2,490
- After-tax cash flow
- $9,811/yr
For passive investors: Depreciation is non-cash, so a rental often shows a tax loss while cash-flowing — sheltering income. Rental losses are passive: they offset passive income freely, and up to $25,000/yr can offset ordinary (W-2) income if you actively participate and your MAGI is under $100k (phasing out to $0 by $150k); unused losses carry forward. On sale, claimed depreciation is recaptured at up to 25%, and gains may owe capital-gains tax (a 1031 exchange can defer both). Figures are a year-1 estimate at your 24.0% rate — not tax advice; consult a CPA.
Schools (NCES district)
- District
- Orleans Parish
- NCES district ID
- 2201170
- Math proficiency
- 11% ▼ -52.00%
- Reading proficiency
- 27% ▼ -46.00%
- Median HH income
- $37,011
- Composite
- 15.78/100
- National rank
- #9271
- State rank
- #69 of 98 in LA
Livability — New Orleans
- Score
- 81/100
- State rank
- #3
- US rank
- #1383
Category grades
Schools grade is shown separately in the Schools card above.
Census & demographics
- Census place
- New Orleans, LA
- County
- Orleans Parish · 338,817 people
- City population
- 338,817
- Metro
- New Orleans-Metairie, LA
- Population (ZIP)
- 9,387
- Household income
- $39,333
- Rent vs Own
- Severe rent burden
- 714.0
Population outlook (Orleans County) Hauer SSP2
- Today (2025)
- 513,025 people
- By 2030
- 575,781 · +12.2%
- By 2040
- 700,174 · +36.5%
- By 2050
- 826,541 · +61.1%
- By 2075
- 1,123,374 · +119.0%
- By 2100
- 1,355,609 · +164.2%
Race, ethnicity, and origin ACS 2023
- Neighborhood character
- Diverse neighborhood (Simpson 0.57)
- Race & ethnicity
- Black 61% White 20% Hispanic / Latino 13% Two or more races 11% Asian 2%
- Hispanic origin (detail)
- Mexican 2%
- Common ancestry
- Lithuanian 2% Portuguese 1% Slovak 1%
- Foreign-born
- 13% · Canada, Vietnam, China
- Languages at home
- 86% English-only · Spanish 11% Other Indo-European 1% Vietnamese 1%
Political lean MEDSL · Orleans
- 2024 margin
- Solid D (+67.0) · D 82.2% · R 15.2% · Other 2.7%
- 2008→2024 swing
- +6.7pp toward D · 2008: 60.3pp · 2024: 67.0pp
- All cycles
- 2024: D+67.0 2020: D+68.2 2016: D+66.2 2012: D+62.5 2008: D+60.3
Not yet ingested
- Civics
- —
Market trends
- HPI YoY
- ▲ 65.92%
- Current HPI
- 229.3968
- Rent YoY
- ▲ 5.98%
- Metro
- New Orleans-Metairie, LA
- State GDP YoY
- ▲ 3.29%
- F500 in state
- 10
Industry mix (Fortune 500 HQ in LA)
| Industry | F500 HQs | Revenue |
|---|---|---|
| Telecommunications | 2 | $23B |
|
||
| Utilities | 1 | $12B |
|
||
| Wholesale / Distribution | 1 | $5B |
|
||
| Advertising | 1 | $2B |
|
||
Price history
+1130.8% since first listed5 events — show timeline
- 2026-05-21 Listed $160,000 AcadianaMLS
- 2026-05-21 Listed $160,000 GSREIN
- 1995-05-01 Sold (MLS) $5,700 GSREIN
- 1994-10-04 Listed $13,000 AcadianaMLS
- 1994-10-04 Listed $13,000 GSREIN
Property tax history
+6.3%/yrLatest (2026): $1,695 · +1.1% YoY. Source: county tax records.
Cash-flow waterfall
monthlySold comps — $/sqft
last 12 mo · ≤1 miLoading sold comps…