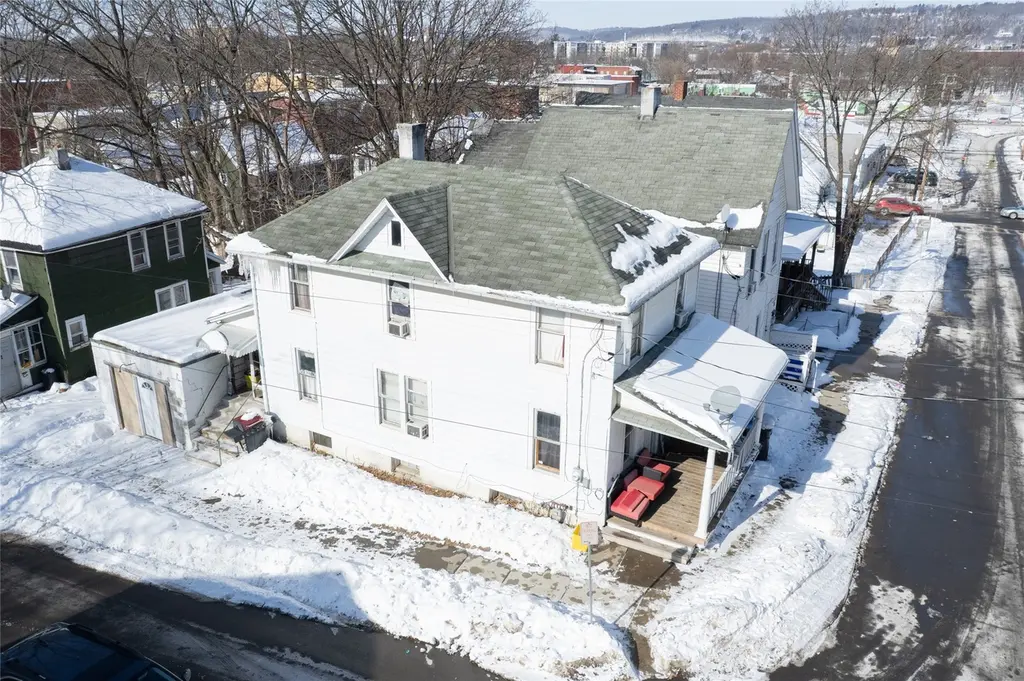
40 Mary St · Binghamton, NY
Flood risk 5/10 · Moderate
- FEMA flood zone
- X
- Chance of flooding over 30 yrs
- 0.27%
- Est. flood insurance / yr
- $473 – $860
Fire risk 3/10 · Minor
- Est. fire insurance / yr
- $691 – $1,283
Heat risk 3/10 · Minor
- Hot days now (above 92°F)
- 7 days/yr
- Hot days in 30 yrs
- 16 days/yr
Wind risk 2/10 · Minimal
- Chance of severe wind over 30 yrs
- 1.0%
Air-quality risk 2/10 · Minimal
- Unhealthy air days now
- 0 days/yr
- Unhealthy air days in 30 yrs
- 1 days/yr
Risk factors via First Street. Map © Google.
Why this score? — see what drove the B+ grade
The composite is a weighted blend of 9 inputs, each scored 0–100. Each bar is that input's sub-score; the figure is the points it added to the 100-point composite (weight × sub-score).
- Cash flow +30.0/30.0
- 1% rule +10.0/10.0
- DSCR +10.0/10.0
- Appreciation +10.0/10.0
- ARV discount +7.5/15.0
- Livability +3.9/5.0
- Schools +3.0/10.0
- Rent growth +2.5/5.0
- Condition / age +2.5/5.0
$60,000
🖨 Deal sheet 📄 Offer letter ✓ Due diligence
Listing remarks
Showing by appointment only with 24 hour notice. Highly walkable location close to groceries, public transport & Downtown Binghamton. This property has no off-street parking. Garage has been converted to additional storage space.
Key facts
- Close to groceries
- Public transport
- Walkable location
Tags
Property features AI
Finance
- Other: Zoned residential
Exterior
- Parking: No dedicated parking
- Utilities: Public water; Public sewer
- Home design: Single-family residence; Two levels (2 stories); Entry on main level
- Construction: Vinyl siding
- Exterior features: Covered porch; Level lot
Interior
- Kitchen: Range; Free-standing range; Refrigerator; Gas water heater
- Flooring: Hardwood
- Bathrooms: 1 full bathroom; 1 half bathroom
- Heating & cooling: Central heating; No cooling
- Interior features: Range; Free-standing range; Gas water heater; Refrigerator
Neighborhood map
What this means for you Summary
Snapshot
- This is a 3-bed/1.0-bath single-family listed at $60k.
Deal economics
- At list price, monthly cash flow is $830 ($10k/yr) — positive.
- The deal already cash-flows at list — no discount required.
- Meets the 1% rule at list price ($2k rent vs $60k).
- Recommended offer: $58k (3.0% below list) — sets the bar for market timing.
Location & tenants
- Location reads 78/100 on livability (#174 in NY, #2,710 nationally) — a middle-class / working-renter tenant base. Strengths: amenities A+, commute A+, cost of living A+; Watch: crime F, employment F.
- Binghamton City School District (urban): math 30% / reading 44% proficiency, ranked #557 of 590 in NY (top 94%) — families likely to look elsewhere, expect single-tenant / working-renter base with shorter leases; 61% free/reduced lunch — lower-income household profile, screen leases tightly.
- Zoned schools: Macarthur School (math 17% / reading 37%, grade F, #1,786 of 2,108 statewide, top 86%, 398 students, 62% FRL) — zoned schools at 62% FRL track the district average.
- Market conditions: 112 active listings in the ZIP; 24 comparable units currently listed for rent nearby; rentals lingering (median 44d on market — plan ~5-8 weeks vacancy on turnover, expect pricing pressure); 67% of comp listings sitting > 30 days — soft ceiling on asking rent; 340 units permitted in Broome County in 2024 (269 in 5+ unit buildings).
Forward outlook
- In year one you build about $6k of equity ($415 loan paydown + $6k appreciation (10.0% local appreciation)).
- Broome County population projected at -13% by 2050 — secular population decline; favor cash flow + early exit over multi-decade hold.
- At projected returns (10.0% appreciation + 3.0% rent growth), your $17k cash investment doubles in ~2 years — after that, you're playing with house money.
- By year 6, paydown + projected appreciation supports a ~$38k cash-out refi (75% LTV) — recoverable capital for the next deal without selling this one.
Negotiation context
- It's been on market 37 days — a 3% lower offer ($58k) is reasonable based on typical stale-listing flexibility.
- 2 sale attempts with the ask held roughly flat each time — persistent listings suggest the price (not the market) is what's stuck; bring a comps-based counter.
- Current owner paid $30k; list at $60k implies a 100% gain — meaningful room to come down on a strong offer.
Risks & watch-outs
- Watch-outs: built in 1900 — expect roof / HVAC / electrical / plumbing capex.
- Climate carrying-cost: moderate flood risk — expect insurance premiums to compound above CPI over the hold.
Questions for the listing agent
- It's been on market 37 days. Have you received any prior offers? Is the seller open to a 3% concession, seller financing, or rate buy-down credit?
- Built in 1900 — when were the roof, HVAC, electrical panel, plumbing, and water heater last replaced?
- Is there a deadline driving the sale (1031 exchange, divorce, estate, relocation)? That informs how much negotiation room exists.
- Schools are D-rated, which usually means shorter tenancies and higher turnover. Who's the typical renter profile here, and what's been the actual vacancy rate?
- Crime grade is F in this area — have there been break-ins, vandalism, or insurance claims at this property in the last 3 years? What carrier currently insures it and at what premium?
- What's the average days-on-market for RENTAL listings here right now (not sales)? A rising rental-DOM trend means longer vacancies and softer asking-rent achievability than the comps imply.
- What's the recent tenant-quality profile in this submarket — average credit score on applications, eviction rate, late-payment / NSF rate, and stable-employment percentage? A property-management company in the area should have these aggregated.
- How much new for-sale + rental construction is in the pipeline within 1–3 miles? Heavy new supply typically softens prices + rents 12–24 months out; constrained supply supports both.
Investment metrics
- 1% rule
- 2.63% ✓
- Cap rate
- 22.89%
- Cash-on-cash
- 59.26%
- DSCR
- 3.64
- GRM
- 3.2
CMA / ARV
- ARV (median comp)
- $157,083
- List price
- $60,000
- Delta
- -61.80%
- Verdict
- UNDERPRICED
- Comps
- 20 within 1.0 mi
Show comp detail 12 sales within ~0.75 mi
| Address | Dist | Beds/Ba | Sqft | Sold | Price | $/sf | Match |
|---|---|---|---|---|---|---|---|
| 6 Curran Ave | 0.15mi | 3/1.0 | 1,323 (-0%) | 3mo | $167,000 | $126 | 90 |
| 13 Edna Ave | 0.35mi | 3/1.0 | 1,314 (-1%) | 8mo | $145,000 | $110 | 75 |
| 10 Columbia Ave | 0.26mi | 3/1.5 | 1,216 (-9%) | 1mo | $170,000 | $140 | 71 |
| 103 S Washington St | 0.26mi | 3/2.0 | 1,384 (+4%) | 8mo | $167,500 | $121 | 70 |
| 17 Sherwood Ave | 0.57mi | 3/1.5 | 1,356 (+2%) | 2mo | $176,768 | $130 | 67 |
| 13 Sherwood Ave | 0.57mi | 4/1.5 (+1) | 1,332 (+0%) | 1mo | $200,000 | $150 | 65 |
| 79 Rush Ave | 0.46mi | 3/1.0 | 1,209 (-9%) | 1mo | $170,000 | $141 | 62 |
| 14 Hallam St | 0.29mi | 3/1.5 | 1,452 (+9%) | 9mo | $175,000 | $121 | 62 |
| 135 Susquehanna Street St | 0.67mi | 2/2.0 (-1) | 1,370 (+3%) | 1mo | $55,000 | $40 | 54 |
| 14 Mcnamara Ave | 0.39mi | 4/1.5 (+1) | 1,463 (+10%) | 8mo | $170,000 | $116 | 52 |
| 17 Phinn Ave | 0.44mi | 3/1.5 | 1,485 (+12%) | 8mo | $200,000 | $135 | 51 |
| 13 Clarence St | 0.40mi | 3/2.0 | 1,516 (+14%) | 8mo | $195,000 | $129 | 47 |
Match score weights: distance 35% · size 25% · config 20% · recency 20%. Top-matched comps best support the ARV.
Projected returns pro-forma
10.0% appreciation · 3.0% rent growth · sell at horizon
- IRR
- 71.6%
- Equity multiple
- 6.09×
- Total profit
- $85,545
- Equity at exit
- $54,053
- IRR
- 65.4%
- Equity multiple
- 13.52×
- Total profit
- $210,408
- Equity at exit
- $116,567
Cash invested: $16,800 (down + closing). Projections, not guarantees.
Landlord ↔ Tenant lean methodology
- Overall (STATE)
- 15 Strongly Tenant-Friendly
- State New York
- 15 Strongly Tenant-Friendly · D+10
- County
- — inherits STATE
- City
- — inherits STATE
ZIP-level market 13903
- Home prices YoY
- 4.3%
- Active inventory
- 112
- Price-to-rent
- 3.2×
Monthly cashflow live
- Estimated rent
- $1,575 high interval (Pro) →
- Mortgage (P&I)
- −$315
- Tax est. 1.5%
- −$75 /mo · $900/yr
- Insurance
- −$25
- HOA
- −$0
- Vacancy / Maint / Mgmt
- −$331
- Net cashflow
- $830
Break-even live
UW: 25.0% down · 7.5% · 30yr · 1.5% tax · 5.0% vac · 8.0% maint · 8.0% mgmt
Financing live
Cash to close
- Down payment
- $15,000
- Closing costs
- $1,800
- Reserves months
- —
- Total cash needed
- —
Loan-product check · same deal, 3 products live
Conventional
25% down · 7.5% · 30yr
- Down + closing
- —
- Monthly P&I
- —
- Monthly cashflow
- —
- DSCR
- —
- Eligible?
- —
Personal DTI + credit; lowest rate.
DSCR
20% down · 8.5% · 30yr
- Down + closing
- —
- Monthly P&I
- —
- Monthly cashflow
- —
- DSCR
- —
- Eligible?
- —
No personal income docs; deal must DSCR.
Hard money
10% down · 12.0% · 12mo
- Down + closing
- —
- Monthly P&I
- —
- Monthly cashflow
- —
- DSCR
- —
- Eligible?
- —
Short-term bridge; refi at stabilization.
Rent comps 24 comps
| Address | Beds | Baths | Sqft | Rent | $/sqft | DOM | Units | Dist |
|---|---|---|---|---|---|---|---|---|
| 71 Mary St Unit 2 Binghamton, NY | 2.0 | 1.0 | 1100 | $1,300 | $1.18 | 13d | 1 | 0.12mi |
| 1 Euclid Ave Unit 1 Binghamton, NY | 3.0 | 1.0 | 1100 | $1,500 | $1.36 | 43d | 1 | 0.26mi |
| 86 Conklin Ave Binghamton, NY | 3.0 | 1.0 | 1316 | $1,600 | $1.22 | 13d | 1 | 0.35mi |
| 80 State St Unit A 3-1 3 Bed Binghamton, NY | 3.0 | 3.0 | 900 | $900 | $1.00 | 43d | 1 | 0.60mi |
| 113 Hawley St Binghamton, NY | 4.0 | 1.5 | 1637 | $2,000 | $1.22 | 43d | 1 | 0.66mi |
| 31 Indiana St Binghamton, NY | 3.0 | 1.5 | 1232 | $1,500 | $1.22 | 43d | 1 | 0.72mi |
| 136 Court St Unit 2 Binghamton, NY | 4.0 | 1.0 | 1373 | $3,000 | $2.18 | 43d | 1 | 0.73mi |
| 33 Fayette St Unit 22 Binghamton, NY | 2.0 | 1.0 | 1350 | $1,100 | $0.81 | 13d | 1 | 0.82mi |
| 73 Leroy St Unit 02 Binghamton, NY | 3.0 | 1.0 | 1100 | $1,950 | $1.77 | 43d | 1 | 0.90mi |
| 53 Seminary Ave Unit 1 Binghamton, NY | 2.0 | 1.0 | 1722 | $925 | $0.54 | 21d | 1 | 0.92mi |
| 5 Arthur St Unit 2 Binghamton, NY | 4.0 | 1.0 | 1200 | $1,800 | $1.50 | 43d | 1 | 0.94mi |
| 26 Johnson Ave Unit 1 Binghamton, NY | 3.0 | 1.0 | 1633 | $1,600 | $0.98 | 43d | 1 | 0.95mi |
| 29 Laurel Ave Unit 2 Binghamton, NY | 3.0 | 1.5 | 1500 | $2,250 | $1.50 | 43d | 1 | 0.96mi |
| 171 Chapin St Unit 3rd FL Binghamton, NY | 2.0 | 1.0 | 1135 | $1,500 | $1.32 | 43d | 1 | 1.03mi |
| 171 Chapin St Unit 1st FL Binghamton, NY | 4.0 | 1.5 | 1400 | $3,000 | $2.14 | 43d | 1 | 1.03mi |
| 171 Chapin St Unit 2nd FL Binghamton, NY | 4.0 | 2.0 | 1135 | $3,000 | $2.64 | 43d | 1 | 1.03mi |
| 167 Oak St Unit 1 Binghamton, NY | 2.0 | 1.0 | 923 | $1,300 | $1.41 | 43d | 1 | 1.06mi |
| 46 North St Unit 4 Binghamton, NY | 2.0 | 1.0 | 1000 | $1,600 | $1.60 | 13d | 1 | 1.09mi |
| 50 Lathrop Ave Unit 2 Binghamton, NY | 3.0 | 1.0 | 1250 | $1,600 | $1.28 | 13d | 1 | 1.11mi |
| 198 Chapin St Binghamton, NY | 4.0 | 2.0 | 1500 | $1,700 | $1.13 | 21d | 1 | 1.11mi |
| 27 Tompkins St Unit 10 Binghamton, NY | 2.0 | 1.0 | 950 | $1,050 | $1.11 | 21d | 1 | 1.11mi |
| 27 Tompkins St Unit 9 Binghamton, NY | 2.0 | 1.0 | 950 | $950 | $1.00 | 43d | 1 | 1.11mi |
| 4 Erie St Unit 2 Binghamton, NY | 3.0 | 1.0 | 1075 | $1,200 | $1.12 | 43d | 1 | 1.20mi |
| 26 Doubleday St Binghamton, NY | 2.0 | 1.0 | 1000 | $1,350 | $1.35 | 43d | 1 | 1.26mi |
Listing history 19 events
-
2026-06-19days on market $60,000 Active 37 DOM
-
2026-06-18days on market $60,000 Active 36 DOM
-
2026-06-17days on market $60,000 Active 35 DOM
-
2026-06-16days on market $60,000 Active 34 DOM
-
2026-06-15days on market $60,000 Active 33 DOM
-
2026-06-14days on market $60,000 Active 31 DOM
-
2026-06-13days on market $60,000 Active 30 DOM
-
2026-06-10days on market $60,000 Active 28 DOM
-
2026-06-09days on market $60,000 Active 27 DOM
-
2026-06-08days on market $60,000 Active 26 DOM
-
2026-06-07days on market $60,000 Active 25 DOM
-
2026-06-03days on market $60,000 Active 21 DOM
-
2026-06-02days on market $60,000 Active 20 DOM
-
2026-06-01days on market $60,000 Active 19 DOM
-
2026-05-31days on market $60,000 Active 18 DOM
-
2026-05-30days on market $60,000 Active 17 DOM
-
2026-05-13$60,000 Active 235-char remark
-
2026-02-10$70,000 Active
-
2010-11-29soldstatus $30,000
ⓘ Source: listings_history table (triggers on properties + properties_extension) + one-shot
backfill from property_details.listing_events for pre-trigger history.
Climate risk First Street
- Flood 5/10 Major FEMA zone X · 27% chance over 30 yrs
- Wildfire 3/10 Moderate
- Heat 3/10 Moderate 7 d/yr ≥92°F today · 16 d/yr by 30 yrs out
- Wind 2/10 Low 100% chance of damaging wind over 30 yrs
- Air quality 2/10 Low 0 unhealthy d/yr today · 1 by 30 yrs out
Nearby sold comps map
Loading sold comps map…
Walkable amenities ~0.75 mi
Loading nearby amenities…
Taxation est. · year 1
- Rental income
- $18,901
- − Mortgage interest
- −$3,361
- − Property taxes
- −$900
- − Insurance
- −$300
- − Repairs & maintenance
- −$1,512
- − Management
- −$1,512
- − Depreciation
- −$1,745
- Taxable income
- $9,571
- Est. tax owed @ 24.0%
- −$2,297
- After-tax cash flow
- $7,659/yr
For passive investors: Depreciation is non-cash, so a rental often shows a tax loss while cash-flowing — sheltering income. Rental losses are passive: they offset passive income freely, and up to $25,000/yr can offset ordinary (W-2) income if you actively participate and your MAGI is under $100k (phasing out to $0 by $150k); unused losses carry forward. On sale, claimed depreciation is recaptured at up to 25%, and gains may owe capital-gains tax (a 1031 exchange can defer both). Figures are a year-1 estimate at your 24.0% rate — not tax advice; consult a CPA.
Schools (NCES district)
- District
- Binghamton City School District
- NCES district ID
- 3604870
- Math proficiency
- 30% ▬ 0.00%
- Reading proficiency
- 44% ▲ 15.00%
- Median HH income
- $30,475
- Composite
- 30.09/100
- National rank
- #6342
- State rank
- #557 of 590 in NY
Livability — Binghamton
- Score
- 78/100
- State rank
- #174
- US rank
- #2710
Category grades
Schools grade is shown separately in the Schools card above.
Census & demographics
- Census place
- Binghamton, NY
- County
- Broome County · 126,805 people
- City population
- 65,170
- Metro
- Binghamton, NY
- Population (ZIP)
- 17,569
- Household income
- $66,278
- Rent vs Own
- Severe rent burden
- 602.0
Population outlook (Broome County) Hauer SSP2
- Today (2025)
- 187,989 people
- By 2030
- 183,066 · -2.6%
- By 2040
- 172,228 · -8.4%
- By 2050
- 163,161 · -13.2%
- By 2075
- 153,641 · -18.3%
- By 2100
- 140,851 · -25.1%
Race, ethnicity, and origin ACS 2023
- Neighborhood character
- Predominantly White (80%)
- Race & ethnicity
- White 80% Black 9% Two or more races 6% Hispanic / Latino 4% Asian 1%
- Common ancestry
- Romanian 6% Slovak 2% Scotch-Irish 2%
- Foreign-born
- 5% · Canada
- Languages at home
- 94% English-only · Spanish 2% Other Indo-European 1% Arabic 1%
Political lean MEDSL · Broome
- 2024 margin
- Toss-up / Even · D 50.2% · R 49.8%
- 2008→2024 swing
- -7.6pp toward R · 2008: 8.0pp · 2024: 0.4pp
- All cycles
- 2024: D+0.4 2020: D+3.5 2016: R+3.7 2012: D+4.6 2008: D+8.0
Not yet ingested
- Civics
- —
Market trends
- HPI YoY
- ▲ 11.68%
- Current HPI
- 286.1001
- Rent YoY
- —
- Metro
- Binghamton, NY
- State GDP YoY
- ▲ 2.60%
- F500 in state
- 92
Industry mix (Fortune 500 HQ in NY)
| Industry | F500 HQs | Revenue |
|---|---|---|
| Financial Services | 10 | $950B |
|
||
| Consumer Goods | 9 | $162B |
|
||
| Insurance | 4 | $225B |
|
||
| Telecommunications | 2 | $144B |
|
||
| Pharmaceuticals | 2 | $112B |
|
||
| Media / Entertainment | 2 | $69B |
|
||
Price history
+100.0% since first listed3 events — show timeline
- 2026-05-13 Listed $60,000 GBAOR
- 2026-02-10 Listed $70,000 GBAOR
- 2010-11-29 Sold (Public Records) $30,000 Public Records
Property tax history
+4.7%/yrLatest (2025): $4,971 · +0.9% YoY. Source: county tax records.
Cash-flow waterfall
monthlySold comps — $/sqft
last 12 mo · ≤1 miLoading sold comps…