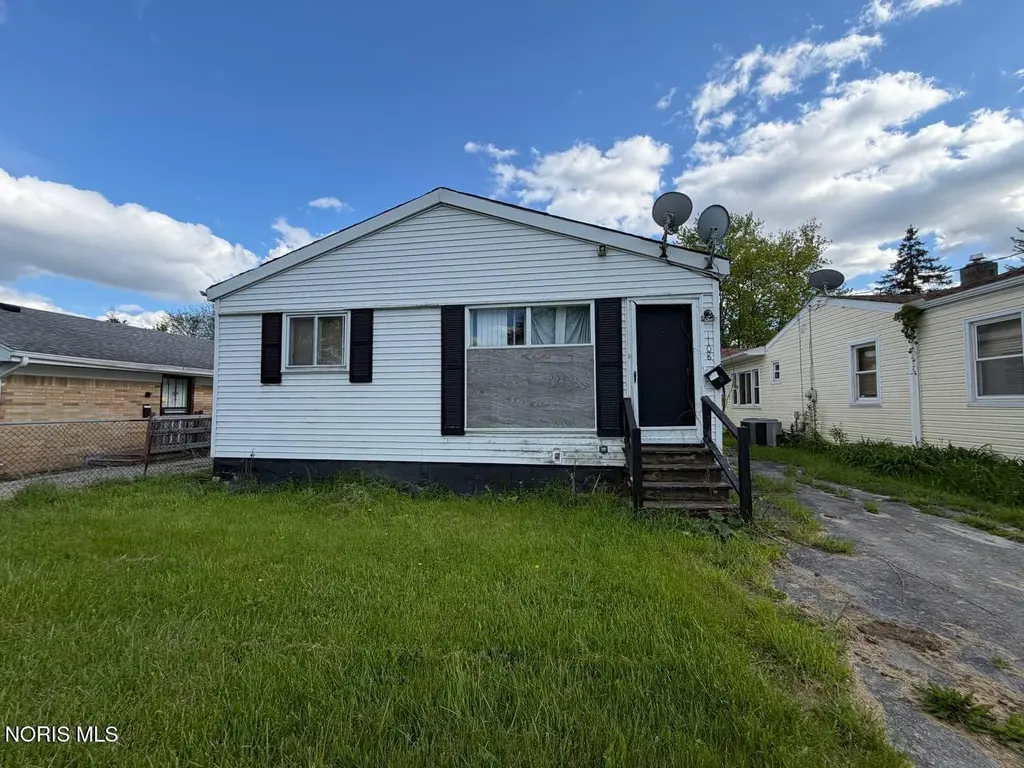
1108 Bronson Ave · Toledo, OH
Flood risk 1/10 · Minimal
- FEMA flood zone
- X (unshaded)
- Chance of flooding over 30 yrs
- 0.0%
- Est. flood insurance / yr
- $473 – $860
Fire risk 1/10 · Minimal
- Est. fire insurance / yr
- $713 – $1,323
Heat risk 3/10 · Minor
- Hot days now (above 100°F)
- 7 days/yr
- Hot days in 30 yrs
- 16 days/yr
Wind risk 2/10 · Minimal
- Chance of severe wind over 30 yrs
- —
Air-quality risk 2/10 · Minimal
- Unhealthy air days now
- 1 days/yr
- Unhealthy air days in 30 yrs
- 3 days/yr
Risk factors via First Street. Map © Google.
Why this score? — see what drove the D grade
The composite is a weighted blend of 9 inputs, each scored 0–100. Each bar is that input's sub-score; the figure is the points it added to the 100-point composite (weight × sub-score).
- Cash flow +15.0/30.0
- ARV discount +7.5/15.0
- 1% rule +5.0/10.0
- DSCR +5.0/10.0
- Rent growth +3.5/5.0
- Livability +3.3/5.0
- Condition / age +2.5/5.0
- Schools +1.6/10.0
- Appreciation +0.0/10.0
$16,900
🖨 Deal sheet (PDF) 📄 Offer letter ✓ Due diligence
Listing remarks
2 bed 1 bath. Flip opportunity. Come check it out
Key facts
- 5,200 sq ft lot
- Built 1960
- Listed 28 days
Property features AI
Exterior
- Parking: Driveway
- Utilities: Electricity connected; Natural gas connected; Public water; Public sewer
- Home design: Single-family residence; One story; Not attached to other units; No common walls; Facing information not provided
- Construction: Vinyl siding; Block foundation; Built or updated details not provided
- Exterior features: Shingle roof
Interior
- Kitchen: Main-level kitchen (14 x 9)
- Bedrooms: Bedroom on main level (10 x 9); Additional bedroom on main level (9 x 9)
- Flooring: Tile
- Bathrooms: 1 full bathroom
- Heating & cooling: Forced air heating; Heating present
- Interior features: 5 total rooms; Tile flooring; Basement present; Other interior features
- Laundry & utility: Laundry located in basement
Neighborhood map
What this means for you Summary
Snapshot
- This is a 3-bed/1.0-bath single-family listed at $17k.
Deal economics
- At list price, monthly cash flow is $639 ($8k/yr) — positive.
- The deal already cash-flows at list — no discount required.
- Meets the 1% rule at list price ($998 rent vs $17k).
- Recommended offer: $17k (1.5% below list) — sets the bar for market timing.
- Cap rate 51.6% vs local median 7.7% in Toledo — top-decile yield for the area; either an underpriced asset or a hidden risk that comps aren't pricing in. Stress-test before assuming the spread holds.
Location & tenants
- Location reads 66/100 on livability (#645 in OH) — a middle-class / working-renter tenant base. Strengths: cost of living A+, housing A+, health & safety A+; Watch: amenities C-, crime F, commute F.
- Toledo City (urban): math 15% / reading 24% proficiency, ranked #634 of 656 in OH (top 97%) — low school quality limits family demand, transient renter base, plan for 1-2y turnover; 72% free/reduced lunch — lower-income household profile, screen leases tightly.
- Zoned schools: Spring Elementary School (math 2% / reading 8%, grade F, #1,554 of 1,584 statewide, top 100%, 231 students, 0% FRL); Woodward High School (math 2% / reading 22%, grade F, #726 of 781 statewide, top 94%, 672 students, 0% FRL) — zoned schools average 0% FRL vs 72% district-wide (72 pts lower); this property's tenant base skews higher-income than the district average.
- Market conditions: Rents rising (+3.9%/yr); 59 active listings in the ZIP; 19 comparable units currently listed for rent nearby; rentals at typical pace (median 25d on market — plan ~3-4 weeks tenant-placement turnaround); 42% of comp listings sitting > 30 days — soft ceiling on asking rent; lower-income renter base — watch delinquency; 415 units permitted in Lucas County in 2024 (122 in 5+ unit buildings).
- This rent runs 41% of the median local income ($29k/yr) — at the standard rent-burdened threshold; future hikes will face affordability resistance.
Forward outlook
- Local home prices are declining (-3.0%/yr); year-one equity from $117 of loan paydown is wiped out by about $507 of value loss. Plan a longer hold.
- Lucas County population projected at -16% by 2050 — secular population decline; favor cash flow + early exit over multi-decade hold.
- At projected returns (-3.0% appreciation + 3.9% rent growth), your $5k cash investment doubles in ~1 year — after that, you're playing with house money.
Negotiation context
- It's been on market 28 days — a 2% lower offer ($17k) is reasonable based on typical stale-listing flexibility.
Risks & watch-outs
- Watch-outs: property tax is 3.8% of price.
Questions for the listing agent
- Built in 1960 — when were the roof, HVAC, electrical panel, plumbing, and water heater last replaced?
- Property tax is high relative to price — has the assessment been appealed recently, and will the sale trigger a re-assessment?
- Is there a deadline driving the sale (1031 exchange, divorce, estate, relocation)? That informs how much negotiation room exists.
- Schools are D-rated, which usually means shorter tenancies and higher turnover. Who's the typical renter profile here, and what's been the actual vacancy rate?
- Crime grade is F in this area — have there been break-ins, vandalism, or insurance claims at this property in the last 3 years? What carrier currently insures it and at what premium?
- The area grade is low — what's the realistic commute time and amenity access for the typical tenant pool here? Any planned neighborhood developments (good or bad) we should know about?
- What's the average days-on-market for RENTAL listings here right now (not sales)? A rising rental-DOM trend means longer vacancies and softer asking-rent achievability than the comps imply.
- What's the recent tenant-quality profile in this submarket — average credit score on applications, eviction rate, late-payment / NSF rate, and stable-employment percentage? A property-management company in the area should have these aggregated.
- How much new for-sale + rental construction is in the pipeline within 1–3 miles? Heavy new supply typically softens prices + rents 12–24 months out; constrained supply supports both.
Investment metrics
- 1% rule
- 5.90% ✓
- Cap rate
- 51.63%
- Cash-on-cash
- 161.93%
- DSCR
- 8.20
- GRM
- 1.4
CMA / ARV
- ARV (on-the-fly)
- $54,945
- Comps found
- 12
Show comp detail 12 sales within ~0.75 mi
| Address | Dist | Beds/Ba | Sqft | Sold | Price | $/sf | Match |
|---|---|---|---|---|---|---|---|
| 1102 Woodward Ave | 0.29mi | 3/1.0 | 1,041 (+4%) | 4mo | $62,000 | $60 | 76 |
| 3220 Maher St | 0.30mi | 3/1.0 | 952 (-5%) | 4mo | $54,900 | $58 | 75 |
| 1101 Ketcham Ave | 0.25mi | 3/1.0 | 1,068 (+7%) | 3mo | $25,850 | $24 | 74 |
| 3463 Brigham St | 0.62mi | 3/1.0 | 986 (-1%) | 1mo | $54,000 | $55 | 68 |
| 3333 Beaumont Dr | 0.49mi | 2/1.0 (-1) | 988 (-1%) | 3mo | $42,500 | $43 | 68 |
| 3449 Brigham St | 0.60mi | 3/1.0 | 946 (-5%) | 1mo | $54,000 | $57 | 62 |
| 910 Woodward Ave | 0.32mi | 3/2.0 | 1,104 (+10%) | 4mo | $34,000 | $31 | 60 |
| 1821 Ridgewood Ave | 0.57mi | 3/1.0 | 1,090 (+9%) | 2mo | $48,000 | $44 | 56 |
| 3427 Beaumont Dr | 0.60mi | 3/1.0 | 1,080 (+8%) | 3mo | $22,000 | $20 | 56 |
| 1548 Booth Ave | 0.56mi | 3/1.0 | 1,125 (+13%) | 3mo | $95,000 | $84 | 50 |
| 1019 E Manhattan Blvd | 0.67mi | 2/1.5 (-1) | 923 (-8%) | 4mo | $67,000 | $73 | 46 |
| 3118 Elm St | 0.73mi | 3/1.0 | 1,140 (+14%) | 4mo | $50,000 | $44 | 39 |
Match score weights: distance 35% · size 25% · config 20% · recency 20%. Top-matched comps best support the ARV.
Projected returns pro-forma
-3.0% appreciation · 3.89% rent growth · sell at horizon
- IRR
- —
- Equity multiple
- 9.21×
- Total profit
- $38,866
- Equity at exit
- $2,520
- IRR
- —
- Equity multiple
- 20.05×
- Total profit
- $90,121
- Equity at exit
- $1,461
Cash invested: $4,732 (down + closing). Projections, not guarantees.
Landlord ↔ Tenant lean methodology
- Overall (STATE)
- 73 Landlord-Friendly
- State Ohio
- 73 Landlord-Friendly · R+6
- County
- — inherits STATE
- City
- — inherits STATE
ZIP-level market 43608
- Home prices YoY
- -21.3%
- Rents YoY
- 3.9%
- Active inventory
- 59
- Price-to-rent
- 1.4×
Monthly cashflow live
- Estimated rent
- $998 high interval (Pro) →
- Mortgage (P&I)
- −$89
- Tax from tax record
- −$54 /mo · $650/yr
- Insurance
- −$7
- HOA
- −$0
- Vacancy / Maint / Mgmt
- −$210
- Net cashflow
- $639
Break-even live
Sensitivity live
| Price | -10% $648 | -5% $643 | +0% $639 | +5% $634 | +10% $629 |
|---|---|---|---|---|---|
| Rent | -10% $560 | -5% $599 | +0% $639 | +5% $678 | +10% $717 |
| Rate | -1.0pp $647 | -0.5pp $643 | base $639 | +0.5pp $634 | +1.0pp $630 |
UW: 25.0% down · 7.5% · 30yr · 1.5% tax · 5.0% vac · 8.0% maint · 8.0% mgmt
Financing live
Cash to close
- Down payment
- $4,225
- Closing costs
- $507
- Reserves months
- —
- Total cash needed
- —
Loan-product check · same deal, 3 products live
Conventional
25% down · 7.5% · 30yr
- Down + closing
- —
- Monthly P&I
- —
- Monthly cashflow
- —
- DSCR
- —
- Eligible?
- —
Personal DTI + credit; lowest rate.
DSCR
20% down · 8.5% · 30yr
- Down + closing
- —
- Monthly P&I
- —
- Monthly cashflow
- —
- DSCR
- —
- Eligible?
- —
No personal income docs; deal must DSCR.
Hard money
10% down · 12.0% · 12mo
- Down + closing
- —
- Monthly P&I
- —
- Monthly cashflow
- —
- DSCR
- —
- Eligible?
- —
Short-term bridge; refi at stabilization.
Rent comps 19 comps
| Address | Beds | Baths | Sqft | Rent | $/sqft | DOM | Units | Dist |
|---|---|---|---|---|---|---|---|---|
| 3405 Beaumont Dr Toledo, OH | 2.0 | 1.0 | 855 | $745 | $0.87 | 15d | 1 | 0.54mi |
| 3439 Jeannette Ave Toledo, OH | 3.0 | 1.0 | 1098 | $1,095 | $1.00 | 45d | 1 | 0.57mi |
| 3474 Maher St Toledo, OH | 2.0 | 1.0 | 736 | $1,125 | $1.53 | 45d | 1 | 0.62mi |
| 524 E Hudson St Toledo, OH | 2.0 | 1.0 | 1050 | $825 | $0.79 | 45d | 1 | 0.68mi |
| 420 Everett St Toledo, OH | 2.0 | 1.0 | 1000 | $975 | $0.97 | 25d | 1 | 0.71mi |
| 329 Mettler St Toledo, OH | 2.0 | 1.0 | 908 | $975 | $1.07 | 15d | 1 | 0.79mi |
| 319 Dexter St Toledo, OH | 2.0 | 1.0 | 990 | $1,005 | $1.02 | 45d | 1 | 0.81mi |
| 227 Everett St Toledo, OH | 2.0 | 1.0 | 914 | $850 | $0.93 | 45d | 1 | 0.85mi |
| 405 E Manhattan Blvd Toledo, OH | 2.0 | 1.0 | 1000 | $900 | $0.90 | 15d | 1 | 0.94mi |
| 340 E Lake St Toledo, OH | 2.0 | 1.0 | 683 | $775 | $1.13 | 25d | 1 | 0.94mi |
| 1951 N Summit St Unit 2 Toledo, OH | 2.0 | 1.0 | 835 | $800 | $0.96 | 45d | 1 | 0.96mi |
| 225 Palmer St Toledo, OH | 2.0 | 1.0 | 924 | $895 | $0.97 | 45d | 1 | 0.96mi |
| 333 E Lake St Toledo, OH | 2.0 | 1.0 | 800 | $495 | $0.62 | 25d | 1 | 0.97mi |
| 413 Sandusky St Toledo, OH | 2.0 | 1.0 | 900 | $775 | $0.86 | 25d | 1 | 1.02mi |
| 630 Mulberry St Toledo, OH | 2.0 | 1.0 | 1000 | $950 | $0.95 | 25d | 1 | 1.10mi |
| 2932 N Ontario St Toledo, OH | 2.0 | 1.0 | 750 | $750 | $1.00 | 25d | 1 | 1.19mi |
| 1119 N Summit St Toledo, OH | 1.0–2.0 | 1.0–2.0 | 1023 | $1,750 | $1.71 | 15d | 2 | 1.36mi |
| 626 Walnut St Toledo, OH | 3.0 | 1.0 | 1088 | $995 | $0.91 | 45d | 1 | 1.43mi |
| 426 Beacon St Toledo, OH | 1.0–2.0 | 1.0–1.5 | 809 | $882 | $1.09 | 15d | 10 | 1.43mi |
Listing history 17 events
-
2026-06-18days on market $16,900 Active 28 DOM
-
2026-06-17days on market $16,900 Active 27 DOM
-
2026-06-16days on market $16,900 Active 26 DOM
-
2026-06-15days on market $16,900 Active 25 DOM
-
2026-06-14days on market $16,900 Active 23 DOM
-
2026-06-10days on market $16,900 Active 20 DOM
-
2026-06-09days on market $16,900 Active 19 DOM
-
2026-06-08days on market $16,900 Active 18 DOM
-
2026-06-07days on market $16,900 Active 17 DOM
-
2026-06-05days on market $16,900 Active 14 DOM
-
2026-06-03days on market $16,900 Active 13 DOM
-
2026-06-02days on market $16,900 Active 12 DOM
-
2026-06-01days on market $16,900 Active 11 DOM
-
2026-05-31days on market $16,900 Active 10 DOM
-
2026-05-30days on market $16,900 Active 9 DOM
-
2026-05-21$22,900 Active
-
2026-05-20historical $22,900
ⓘ Source: listings_history table (triggers on properties + properties_extension) + one-shot
backfill from property_details.listing_events for pre-trigger history.
Tax reassessment forecast OH · Partial reset (capped growth)
- Current annual tax
- $650 · $54/mo
- Projected year-2 tax
- $650 · $54/mo
- Expected delta
- $0/yr ($0/mo · 0.0%)
ⓘ Screening estimate from a state-policy table — verify with the county assessor before closing.
Climate risk First Street
- Flood 1/10 Low FEMA zone X (unshaded) · 0% chance over 30 yrs
- Wildfire 1/10 Low
- Heat 3/10 Moderate 7 d/yr ≥100°F today · 16 d/yr by 30 yrs out
- Wind 2/10 Low
- Air quality 2/10 Low 1 unhealthy d/yr today · 3 by 30 yrs out
Nearby sold comps map
Loading sold comps map…
Walkable amenities ~0.75 mi
Loading nearby amenities…
Taxation est. · year 1
- Rental income
- $11,975
- − Mortgage interest
- −$947
- − Property taxes
- −$650
- − Insurance
- −$84
- − Repairs & maintenance
- −$958
- − Management
- −$958
- − Depreciation
- −$492
- Taxable income
- $7,886
- Est. tax owed @ 24.0%
- −$1,893
- After-tax cash flow
- $5,770/yr
For passive investors: Depreciation is non-cash, so a rental often shows a tax loss while cash-flowing — sheltering income. Rental losses are passive: they offset passive income freely, and up to $25,000/yr can offset ordinary (W-2) income if you actively participate and your MAGI is under $100k (phasing out to $0 by $150k); unused losses carry forward. On sale, claimed depreciation is recaptured at up to 25%, and gains may owe capital-gains tax (a 1031 exchange can defer both). Figures are a year-1 estimate at your 24.0% rate — not tax advice; consult a CPA.
Schools (NCES district)
- District
- Toledo City
- NCES district ID
- 3904490
- Math proficiency
- 15% ▼ -16.00%
- Reading proficiency
- 24% ▼ -13.00%
- Median HH income
- $32,137
- Composite
- 15.76/100
- National rank
- #9276
- State rank
- #634 of 656 in OH
Livability — Toledo
- Score
- 66/100
- State rank
- #645
- US rank
- #11442
Category grades
Schools grade is shown separately in the Schools card above.
Census & demographics
- Census place
- Toledo, OH
- County
- Lucas County · 380,724 people
- City population
- 280,811
- Metro
- Toledo, OH
- Population (ZIP)
- 13,593
- Household income
- $29,275
- Rent vs Own
- Severe rent burden
- 911.0
Population outlook (Lucas County) Hauer SSP2
- Today (2025)
- 420,751 people
- By 2030
- 410,187 · -2.5%
- By 2040
- 384,019 · -8.7%
- By 2050
- 355,125 · -15.6%
- By 2075
- 291,683 · -30.7%
- By 2100
- 233,670 · -44.5%
Race, ethnicity, and origin ACS 2023
- Neighborhood character
- Diverse neighborhood (Simpson 0.60)
- Race & ethnicity
- Black 57% White 25% Two or more races 9% Hispanic / Latino 8% Asian 2%
- Hispanic origin (detail)
- Mexican 4%
- Common ancestry
- Romanian 4% Lithuanian 2% Slovak 1%
- Foreign-born
- 4% · Canada, China
- Languages at home
- 91% English-only · Spanish 7%
Political lean MEDSL · Lucas
- 2024 margin
- D (+12.6) · D 55.8% · R 43.2%
- 2008→2024 swing
- -18.9pp toward R · 2008: 31.4pp · 2024: 12.6pp
- All cycles
- 2024: D+12.6 2020: D+16.8 2016: D+17.4 2012: D+30.4 2008: D+31.4
Not yet ingested
- Civics
- —
Market trends
- HPI YoY
- ▼ -37.73%
- Current HPI
- 139.4964
- Rent YoY
- ▲ 3.89%
- Metro
- Toledo, OH
- State GDP YoY
- ▲ 1.98%
- F500 in state
- 48
Industry mix (Fortune 500 HQ in OH)
| Industry | F500 HQs | Revenue |
|---|---|---|
| Insurance | 3 | $145B |
|
||
| Industrial Machinery | 3 | $49B |
|
||
| Financial Services | 3 | $24B |
|
||
| Consumer Goods | 2 | $93B |
|
||
| Aerospace / Defense | 2 | $47B |
|
||
| Utilities | 2 | $33B |
|
||
Price history
+0.0% since first listed2 events — show timeline
- 2026-05-21 Listed $22,900 NORIS
- 2026-05-20 Coming Soon $22,900 NORIS
Property tax history
+6.9%/yrLatest (2025): $650 · +2.6% YoY. Source: county tax records.
Cash-flow waterfall
monthlySold comps — $/sqft
last 12 mo · ≤1 miLoading sold comps…