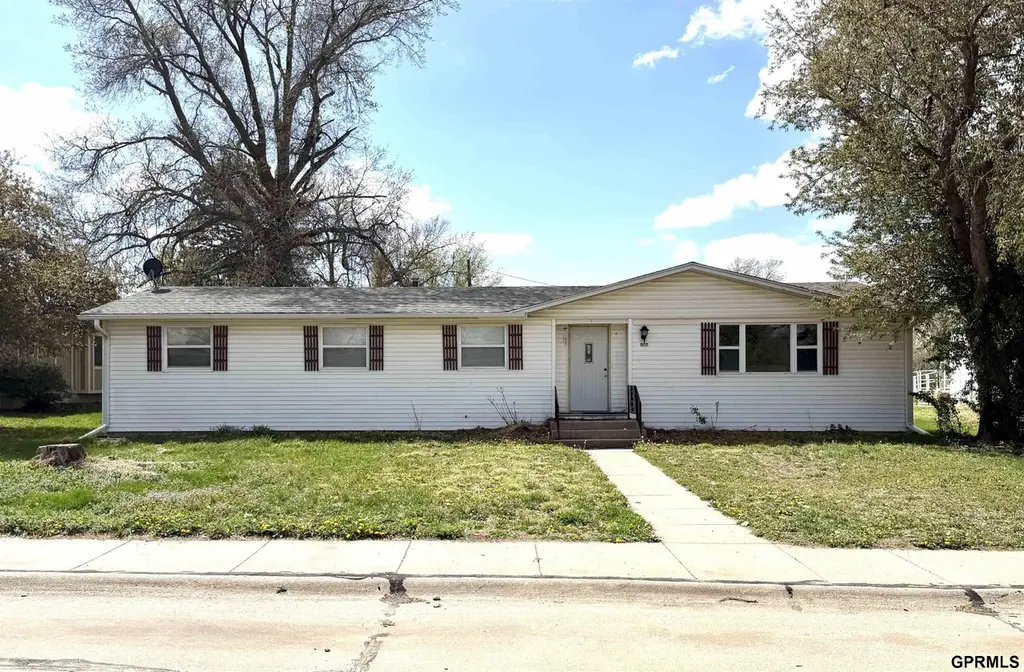
305 N Maple St N · Davenport, NE
Flood risk 1/10 · Minimal
- FEMA flood zone
- X (unshaded)
- Chance of flooding over 30 yrs
- 0.0%
- Est. flood insurance / yr
- $507 – $1,088
Fire risk 1/10 · Minimal
- Est. fire insurance / yr
- $1,161 – $2,155
Heat risk 3/10 · Minor
- Hot days now (above 103°F)
- 7 days/yr
- Hot days in 30 yrs
- 16 days/yr
Wind risk 2/10 · Minimal
- Chance of severe wind over 30 yrs
- —
Air-quality risk 2/10 · Minimal
- Unhealthy air days now
- 1 days/yr
- Unhealthy air days in 30 yrs
- 1 days/yr
Risk factors via First Street. Map © Google.
Why this score? — see what drove the B grade
The composite is a weighted blend of 9 inputs, each scored 0–100. Each bar is that input's sub-score; the figure is the points it added to the 100-point composite (weight × sub-score).
- Cash flow +28.1/30.0
- DSCR +10.0/10.0
- ARV discount +7.5/15.0
- Appreciation +6.8/10.0
- 1% rule +6.7/10.0
- Schools +5.2/10.0
- Livability +3.2/5.0
- Rent growth +2.5/5.0
- Condition / age +2.5/5.0
$94,000
🖨 Deal sheet (PDF) 📄 Offer letter ✓ Due diligence
Listing remarks
Charming three-bedroom ranch in the heart of Davenport — a thoughtfully maintained, single-level home ready for its next owners. Bright and welcoming, the spacious living/dining room is ideal for everyday living and entertaining, anchored by a large view window that fills the space with natural light. The efficient kitchen includes all appliances and offers easy meal prep and clean-up. Two partially updated bathrooms provide modern convenience, and the home boasts great closet space throughout. Outside, enjoy a private deck — perfect for morning coffee or summer barbecues — plus low-maintenance permanent siding and a detached garage. Alley access adds parking convenience a
Key facts
- Private deck
- Alley access
- Great closet space
Tags
Property features AI
Exterior
- Parking: Detached garage; One covered parking space (total 1 parking space)
- Utilities: Public sewer
- Home design: Single-family residence; Residential property; Built in 1975; One-story living (main floor living area entire above-grade finished area)
- Construction: Block foundation
- Exterior features: Deck; Wood fencing; Lot approximately 0.21 acre (up to 1/4 acre); Lot dimensions roughly 136 x 67 and 136 x 60
Interior
- Bedrooms: Master bedroom on the main floor; Additional bedrooms on the main floor
- Bathrooms: Two total bathrooms (one full and one three-quarter), both on the main level
- Heating & cooling: Natural gas forced-air heating; Central air conditioning
- Interior features: No fireplaces; Crawl space basement
Neighborhood map
What this means for you Summary
Snapshot
- This is a 3-bed/2.0-bath manufactured listed at $94k.
Deal economics
- At list price, monthly cash flow is $296 ($4k/yr) — positive.
- The deal already cash-flows at list — no discount required.
- Meets the 1% rule at list price ($1k rent vs $94k).
- Recommended offer: $88k (6.0% below list) — sets the bar for market timing.
Location & tenants
- Location reads 63/100 on livability (#415 in NE) — a middle-class / working-renter tenant base. Strengths: cost of living A+, housing A-; Watch: health & safety C-, crime D+, amenities F.
- Bruning-Davenport Unified System (rural): math 70% / reading 50% proficiency, ranked #65 of 245 in NE (top 26%) — acceptable for families but not a draw, mixed tenant base, ~2y average lease.
- Zoned schools: Bruning-Davenport Elem/Bruning (43 students, 33% FRL); Bruning-Davenport Middle Sch (math 54% / reading 54%, grade B-, #32 of 128 statewide, top 28%, 49 students, 37% FRL); Bruning-Davenport High School (51 students, 35% FRL).
- Market conditions: 3 active listings in the ZIP; 3 units permitted in Thayer County in 2024 (0 in 5+ unit buildings).
Forward outlook
- In year one you build about $4k of equity ($650 loan paydown + $3k appreciation (3.6% local appreciation)).
- Thayer County population projected at +6% by 2050 — modest demand growth; plan on rents tracking national, not racing it.
- At projected returns (3.6% appreciation + 3.0% rent growth), your $26k cash investment doubles in ~4 years — after that, you're playing with house money.
- By year 9, paydown + projected appreciation supports a ~$34k cash-out refi (75% LTV) — recoverable capital for the next deal without selling this one.
Negotiation context
- It's been on market 66 days — a 6% lower offer ($88k) is reasonable based on typical stale-listing flexibility.
- Current owner paid $32k; list at $94k implies a 194% gain — meaningful room to come down on a strong offer.
Questions for the listing agent
- It's been on market 66 days. Have you received any prior offers? Is the seller open to a 6% concession, seller financing, or rate buy-down credit?
- Built in 1975 — when were the roof, HVAC, electrical panel, plumbing, and water heater last replaced?
- Why hasn't it sold? Are there any deal-killer items the seller is aware of (foundation, flood, title, zoning, code violations)?
- Is there a deadline driving the sale (1031 exchange, divorce, estate, relocation)? That informs how much negotiation room exists.
- Crime grade is D in this area — have there been break-ins, vandalism, or insurance claims at this property in the last 3 years? What carrier currently insures it and at what premium?
- What's the average days-on-market for RENTAL listings here right now (not sales)? A rising rental-DOM trend means longer vacancies and softer asking-rent achievability than the comps imply.
- What's the recent tenant-quality profile in this submarket — average credit score on applications, eviction rate, late-payment / NSF rate, and stable-employment percentage? A property-management company in the area should have these aggregated.
- How much new for-sale + rental construction is in the pipeline within 1–3 miles? Heavy new supply typically softens prices + rents 12–24 months out; constrained supply supports both.
Investment metrics
- 1% rule
- 1.17% ✓
- Cap rate
- 10.07%
- Cash-on-cash
- 13.48%
- DSCR
- 1.60
- GRM
- 7.1
CMA / ARV
No comps found within radius.
Projected returns pro-forma
3.59% appreciation · 3.0% rent growth · sell at horizon
- IRR
- 21.4%
- Equity multiple
- 2.26×
- Total profit
- $33,098
- Equity at exit
- $45,432
- IRR
- 22.0%
- Equity multiple
- 4.34×
- Total profit
- $87,821
- Equity at exit
- $72,583
Cash invested: $26,320 (down + closing). Projections, not guarantees.
Landlord ↔ Tenant lean methodology
- Overall (STATE)
- 83 Strongly Landlord-Friendly
- State Nebraska
- 83 Strongly Landlord-Friendly · R+13
- County
- — inherits STATE
- City
- — inherits STATE
ZIP-level market 68335
- Home prices YoY
- 1.8%
- Active inventory
- 3
- Price-to-rent
- 7.1×
Monthly cashflow live
- Estimated rent
- $1,103 medium interval (Pro) →
- Mortgage (P&I)
- −$493
- Tax from tax record
- −$44 /mo · $525/yr
- Insurance
- −$39
- HOA
- −$0
- Vacancy / Maint / Mgmt
- −$232
- Net cashflow
- $296
Break-even live
Sensitivity live
| Price | -10% $349 | -5% $322 | +0% $296 | +5% $269 | +10% $242 |
|---|---|---|---|---|---|
| Rent | -10% $208 | -5% $252 | +0% $296 | +5% $339 | +10% $383 |
| Rate | -1.0pp $343 | -0.5pp $320 | base $296 | +0.5pp $271 | +1.0pp $246 |
UW: 25.0% down · 7.5% · 30yr · 1.5% tax · 5.0% vac · 8.0% maint · 8.0% mgmt
Financing live
Cash to close
- Down payment
- $23,500
- Closing costs
- $2,820
- Reserves months
- —
- Total cash needed
- —
Loan-product check · same deal, 3 products live
Conventional
25% down · 7.5% · 30yr
- Down + closing
- —
- Monthly P&I
- —
- Monthly cashflow
- —
- DSCR
- —
- Eligible?
- —
Personal DTI + credit; lowest rate.
DSCR
20% down · 8.5% · 30yr
- Down + closing
- —
- Monthly P&I
- —
- Monthly cashflow
- —
- DSCR
- —
- Eligible?
- —
No personal income docs; deal must DSCR.
Hard money
10% down · 12.0% · 12mo
- Down + closing
- —
- Monthly P&I
- —
- Monthly cashflow
- —
- DSCR
- —
- Eligible?
- —
Short-term bridge; refi at stabilization.
Listing history 19 events
-
2026-06-21days on market $94,000 Active 66 DOM
-
2026-06-21days on market $94,000 Active 65 DOM
-
2026-06-18days on market $94,000 Active 63 DOM
-
2026-06-17days on market $94,000 Active 62 DOM
-
2026-06-16days on market $94,000 Active 61 DOM
-
2026-06-15days on market $94,000 Active 60 DOM
-
2026-06-13days on market $94,000 Active 58 DOM
-
2026-06-12days on market $94,000 Active 57 DOM
-
2026-06-09days on market $94,000 Active 54 DOM
-
2026-06-08days on market $94,000 Active 53 DOM
-
2026-06-07days on market $94,000 Active 52 DOM
-
2026-06-05days on market $94,000 Active 50 DOM
-
2026-06-04days on market $94,000 Active 48 DOM
-
2026-06-02days on market $94,000 Active 47 DOM
-
2026-06-01days on market $94,000 Active 46 DOM
-
2026-05-31days on market $94,000 Active 45 DOM
-
2026-04-13$94,000 New
-
2011-11-14soldstatus $32,000
-
2002-04-01soldstatus $17,000
ⓘ Source: listings_history table (triggers on properties + properties_extension) + one-shot
backfill from property_details.listing_events for pre-trigger history.
Tax reassessment forecast NE · Resets to sale price
- Current annual tax
- $525 · $44/mo
- Projected year-2 tax
- $1,626 · $136/mo
- Expected delta
- +$1,101/yr (+$92/mo · 209.7%)
ⓘ Screening estimate from a state-policy table — verify with the county assessor before closing.
Climate risk First Street
- Flood 1/10 Low FEMA zone X (unshaded) · 0% chance over 30 yrs
- Wildfire 1/10 Low
- Heat 3/10 Moderate 7 d/yr ≥103°F today · 16 d/yr by 30 yrs out
- Wind 2/10 Low
- Air quality 2/10 Low 1 unhealthy d/yr today · 1 by 30 yrs out
Nearby sold comps map
Loading sold comps map…
Walkable amenities ~0.75 mi
Loading nearby amenities…
Taxation est. · year 1
- Rental income
- $13,238
- − Mortgage interest
- −$5,265
- − Property taxes
- −$525
- − Insurance
- −$470
- − Repairs & maintenance
- −$1,059
- − Management
- −$1,059
- − Depreciation
- −$2,735
- Taxable income
- $2,125
- Est. tax owed @ 24.0%
- −$510
- After-tax cash flow
- $3,037/yr
For passive investors: Depreciation is non-cash, so a rental often shows a tax loss while cash-flowing — sheltering income. Rental losses are passive: they offset passive income freely, and up to $25,000/yr can offset ordinary (W-2) income if you actively participate and your MAGI is under $100k (phasing out to $0 by $150k); unused losses carry forward. On sale, claimed depreciation is recaptured at up to 25%, and gains may owe capital-gains tax (a 1031 exchange can defer both). Figures are a year-1 estimate at your 24.0% rate — not tax advice; consult a CPA.
Schools (NCES district)
- District
- Bruning-Davenport Unified System
- NCES district ID
- 3100124
- Math proficiency
- 70% ▲ 10.00%
- Reading proficiency
- 50% ▬ 0.00%
- Median HH income
- $46,647
- Composite
- 52.41/100
- National rank
- #3418
- State rank
- #65 of 245 in NE
Livability — Davenport
- Score
- 63/100
- State rank
- #415
- US rank
- #15958
Category grades
Schools grade is shown separately in the Schools card above.
Census & demographics
- Census place
- Davenport, NE
- Population (ZIP)
- 466
Population outlook (Thayer County) Hauer SSP2
- Today (2025)
- 4,947 people
- By 2030
- 4,983 · +0.7%
- By 2040
- 5,052 · +2.1%
- By 2050
- 5,224 · +5.6%
- By 2075
- 6,247 · +26.3%
- By 2100
- 6,520 · +31.8%
Race, ethnicity, and origin ACS 2023
- Neighborhood character
- Predominantly White (92%)
- Race & ethnicity
- White 92% Two or more races 7% Hispanic / Latino 7%
- Hispanic origin (detail)
- Mexican 7%
- Common ancestry
- Iranian 3% Lithuanian 3%
- Languages at home
- 99% English-only · Spanish 1%
Political lean MEDSL · Thayer
- 2024 margin
- Solid R (+60.8) · D 19.1% · R 79.9% · Other 1.1%
- 2008→2024 swing
- -27.4pp toward R · 2008: -33.4pp · 2024: -60.8pp
- All cycles
- 2024: R+60.8 2020: R+56.3 2016: R+57.5 2012: R+43.0 2008: R+33.4
Not yet ingested
- Civics
- —
Market trends
- HPI YoY
- ▲ 3.59%
- Current HPI
- 199.8045
- Rent YoY
- —
- Metro
- —
- State GDP YoY
- ▲ 0.68%
- F500 in state
- 2
Industry mix (Fortune 500 HQ in NE)
| Industry | F500 HQs | Revenue |
|---|---|---|
| Conglomerate | 1 | $371B |
|
||
Price history
+452.9% since first listed3 events — show timeline
- 2026-04-13 Listed $94,000 GPRMLS
- 2011-11-14 Sold (Public Records) $32,000 Public Records
- 2002-04-01 Sold (Public Records) $17,000 Public Records
Property tax history
+1.0%/yrLatest (2025): $525 · +18.2% YoY. Source: county tax records.
Cash-flow waterfall
monthlySold comps — $/sqft
last 12 mo · ≤1 miLoading sold comps…