2416 Bold Ruler Rd #466 · Red Bank, SC
Flood risk No data
- FEMA flood zone
- —
- Chance of flooding over 30 yrs
- —
- Est. flood insurance / yr
- —
Fire risk No data
- Est. fire insurance / yr
- —
Heat risk No data
- Hot days now (above threshold)
- —
- Hot days in 30 yrs
- —
Wind risk No data
- Chance of severe wind over 30 yrs
- —
Air-quality risk No data
- Unhealthy air days now
- —
- Unhealthy air days in 30 yrs
- —
Risk factors via First Street. Map © Google.
Why this score? — see what drove the D- grade
The composite is a weighted blend of 9 inputs, each scored 0–100. Each bar is that input's sub-score; the figure is the points it added to the 100-point composite (weight × sub-score).
- Cash flow +10.9/30.0
- ARV discount +7.5/15.0
- Schools +4.2/10.0
- Rent growth +3.3/5.0
- Livability +3.3/5.0
- 1% rule +3.2/10.0
- DSCR +3.2/10.0
- Condition / age +2.5/5.0
- Appreciation +0.0/10.0
$270,418
🖨 Deal sheet (PDF) 📄 Offer letter ✓ Due diligence
Listing remarks
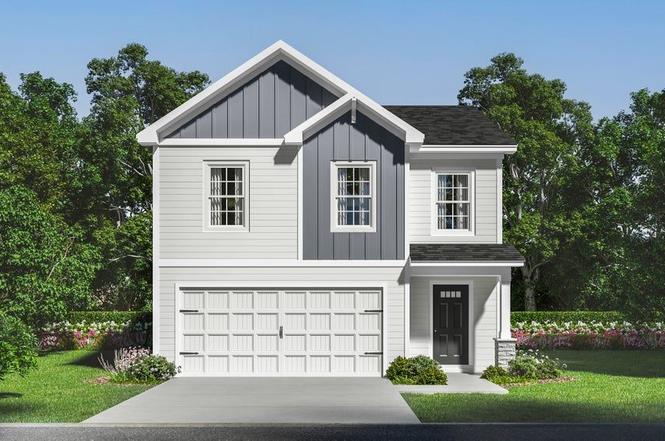
Step inside the Cedar and you'll find 4 bedrooms, 2.5 bathrooms, and 1,783 square feet of beautifully designed space that makes everyday living feel easy. From the foyer, the home opens up into the main living area where the great room flows directly into the kitchen and dining space. The kitchen features a large island that's perfect for quick meals, meal prep, or gathering with others throughout the day, along with a corner pantry that keeps everything organized and within reach. Just off the dining area, step outside to the patio-perfect for grilling, enjoying fresh air, or relaxing after a long day. Upstairs, the primary bedroom is tucked away for privacy and includes a spacious ensuite
Key facts
- Large center island
- Tray ceiling
- Front entry closet
Tags
Property features AI
Finance
- Other: Active listing; last modified May 3, 2026
- Financial info: Listed price $269,418
Exterior
- Home design: Cedar B floor plan
- Exterior features: Address: 2416 Bold Ruler Rd #466, Lexington, SC 29073; Living area approximately 1,783
Interior
- Bedrooms: 4 bedrooms
- Bathrooms: 2 full bathrooms and 1 half bathroom (2.5 total)
- Interior features: Spec new-construction home (Cedar B plan)
Neighborhood map
What this means for you Summary
Snapshot
- This is a 4-bed/2.5-bath single-family listed at $270k.
Deal economics
- At list price, monthly cash flow is $-118 ($-1k/yr) — negative.
- To cash-flow at today's rent, offer at most $253k (6.3% below list).
- To meet the 1% rule (rent ≥ 1% of price), the offer needs to be $222k (18.0% below list).
- Recommended offer: $222k (18.0% below list) — sets the bar for 1% rule.
Location & tenants
- Location reads 66/100 on livability (#121 in SC) — a middle-class / working-renter tenant base. Strengths: cost of living A+, housing A+, health & safety B; Watch: employment C-, crime D+, amenities F.
- Lexington 01 (suburban): math 42% / reading 53% proficiency, ranked #11 of 80 in SC (top 14%) — families likely to look elsewhere, expect single-tenant / working-renter base with shorter leases.
- Zoned schools: Red Bank Elementary (math 36% / reading 45%, grade F, #286 of 597 statewide, top 49%, 568 students, 41% FRL); Carolina Springs Middle (math 25% / reading 39%, grade F, #119 of 229 statewide, top 54%, 914 students, 46% FRL); White Knoll High (math 47% / reading 85%, grade B, #81 of 196 statewide, top 42%, 2,204 students, 45% FRL).
- Market conditions: Rents rising (+3.2%/yr); 572 active listings in the ZIP; 12 comparable units currently listed for rent nearby; rentals at typical pace (median 17d on market — plan ~3-4 weeks tenant-placement turnaround); solid renter incomes; 1,712 units permitted in Lexington County in 2024 (0 in 5+ unit buildings).
- This rent runs 34% of the median local income ($77k/yr) — at the standard rent-burdened threshold; future hikes will face affordability resistance.
Forward outlook
- Local home prices are declining (-3.0%/yr); year-one equity from $2k of loan paydown is wiped out by about $8k of value loss. Plan a longer hold.
- Lexington County population projected at +26% by 2050 — long-run rental-demand tailwind backs the buy-and-hold thesis.
Negotiation context
- It's been on market 275 days — a 12% lower offer ($238k) is reasonable based on typical stale-listing flexibility.
Questions for the listing agent
- What do current leases actually rent for vs. the listed asking? Can we see a recent rent roll and the last 12 months of T-12 income?
- It's been on market 275 days. Have you received any prior offers? Is the seller open to a 18% concession, seller financing, or rate buy-down credit?
- Why hasn't it sold? Are there any deal-killer items the seller is aware of (foundation, flood, title, zoning, code violations)?
- Is there a deadline driving the sale (1031 exchange, divorce, estate, relocation)? That informs how much negotiation room exists.
- Schools are F-rated, which usually means shorter tenancies and higher turnover. Who's the typical renter profile here, and what's been the actual vacancy rate?
- Crime grade is D in this area — have there been break-ins, vandalism, or insurance claims at this property in the last 3 years? What carrier currently insures it and at what premium?
- The area grade is low — what's the realistic commute time and amenity access for the typical tenant pool here? Any planned neighborhood developments (good or bad) we should know about?
- What's the average days-on-market for RENTAL listings here right now (not sales)? A rising rental-DOM trend means longer vacancies and softer asking-rent achievability than the comps imply.
- What's the recent tenant-quality profile in this submarket — average credit score on applications, eviction rate, late-payment / NSF rate, and stable-employment percentage? A property-management company in the area should have these aggregated.
- How much new for-sale + rental construction is in the pipeline within 1–3 miles? Heavy new supply typically softens prices + rents 12–24 months out; constrained supply supports both.
Investment metrics
- 1% rule
- 0.82% ✗
- Cap rate
- 5.77%
- Cash-on-cash
- -1.87%
- DSCR
- 0.92
- GRM
- 10.2
CMA / ARV
No comps found within radius.
Projected returns pro-forma
-3.0% appreciation · 3.24% rent growth · sell at horizon
- IRR
- -19.1%
- Equity multiple
- 0.33×
- Total profit
- $-50,752
- Equity at exit
- $40,320
- IRR
- -11.2%
- Equity multiple
- 0.32×
- Total profit
- $-51,506
- Equity at exit
- $23,381
Cash invested: $75,717 (down + closing). Projections, not guarantees.
Landlord ↔ Tenant lean methodology
- Overall (STATE)
- 90 Strongly Landlord-Friendly
- State South Carolina
- 90 Strongly Landlord-Friendly · R+6
- County
- — inherits STATE
- City
- — inherits STATE
ZIP-level market 29073
- Home prices YoY
- -19.1%
- Rents YoY
- 3.2%
- Active inventory
- 572
- Price-to-rent
- 10.2×
Monthly cashflow live
- Estimated rent
- $2,216 high interval (Pro) →
- Mortgage (P&I)
- −$1,418
- Tax est. 1.5%
- −$338 /mo · $4,056/yr
- Insurance
- −$113
- HOA
- −$0
- Vacancy / Maint / Mgmt
- −$465
- Net cashflow
- $-118
Break-even live
Sensitivity live
| Price | -10% $69 | -5% $-24 | +0% $-118 | +5% $-211 | +10% $-305 |
|---|---|---|---|---|---|
| Rent | -10% $-293 | -5% $-205 | +0% $-118 | +5% $-30 | +10% $57 |
| Rate | -1.0pp $18 | -0.5pp $-49 | base $-118 | +0.5pp $-188 | +1.0pp $-259 |
UW: 25.0% down · 7.5% · 30yr · 1.5% tax · 5.0% vac · 8.0% maint · 8.0% mgmt
Financing live
Cash to close
- Down payment
- $67,604
- Closing costs
- $8,113
- Reserves months
- —
- Total cash needed
- —
Loan-product check · same deal, 3 products live
Conventional
25% down · 7.5% · 30yr
- Down + closing
- —
- Monthly P&I
- —
- Monthly cashflow
- —
- DSCR
- —
- Eligible?
- —
Personal DTI + credit; lowest rate.
DSCR
20% down · 8.5% · 30yr
- Down + closing
- —
- Monthly P&I
- —
- Monthly cashflow
- —
- DSCR
- —
- Eligible?
- —
No personal income docs; deal must DSCR.
Hard money
10% down · 12.0% · 12mo
- Down + closing
- —
- Monthly P&I
- —
- Monthly cashflow
- —
- DSCR
- —
- Eligible?
- —
Short-term bridge; refi at stabilization.
Rent comps 12 comps
| Address | Beds | Baths | Sqft | Rent | $/sqft | DOM | Units | Dist |
|---|---|---|---|---|---|---|---|---|
| 919 Dovefield Ln Lexington, SC | 4.0 | 2.5 | 2022 | $2,299 | $1.14 | 25d | 1 | 0.25mi |
| 847 Dovefield Ln Lexington, SC | 3.0 | 2.0 | 1302 | $1,850 | $1.42 | 16d | 1 | 0.31mi |
| 156 Secretariat St Lexington, SC | 4.0 | 2.5 | 2591 | $2,500 | $0.96 | 16d | 1 | 0.36mi |
| 212 Pin Oak Dr Lexington, SC | 3.0 | 2.0 | 1349 | $1,710 | $1.27 | 16d | 1 | 0.40mi |
| 1607 Commendable Ct Lexington, SC | 4.0 | 2.5 | 1783 | $2,238 | $1.26 | 25d | 1 | 0.44mi |
| 1603 Commendable Ct Lexington, SC | 3.0 | 2.0 | 1399 | $2,033 | $1.45 | 5d | 1 | 0.44mi |
| 120 W Lake Dr Lexington, SC | 3.0 | 2.0 | 1476 | $1,880 | $1.27 | 5d | 1 | 0.62mi |
| 140 Land of Lakes Cir Lexington, SC | 3.0 | 2.0 | 1452 | $1,925 | $1.33 | 5d | 1 | 0.67mi |
| 128 S Wrenwood Dr Lexington, SC | 3.0 | 2.0 | 1250 | $1,695 | $1.36 | 25d | 1 | 0.72mi |
| 110 Darian Dr Lexington, SC | 3.0 | 2.0 | 1364 | $1,949 | $1.43 | 16d | 1 | 0.74mi |
| 449 Lady Liberty Way Lexington, SC | 3.0 | 3.0 | 1635 | $1,995 | $1.22 | 25d | 1 | 0.95mi |
| 464 Lady Liberty Way Lexington, SC | 4.0 | 2.5 | 2100 | $2,150 | $1.02 | 25d | 1 | 0.97mi |
Listing history 13 events
-
2026-06-22days on market $270,418 Active 275 DOM
-
2026-06-18days on market $270,418 Active 272 DOM
-
2026-06-17days on market $270,418 Active 271 DOM
-
2026-06-16days on market $270,418 Active 270 DOM
-
2026-06-15days on market $270,418 Active 269 DOM
-
2026-06-14days on market $270,418 Active 267 DOM
-
2026-06-09days on market $270,418 Active 266 DOM
-
2026-06-08days on market $270,418 Active 265 DOM
-
2026-06-07days on market $270,418 Active 264 DOM
-
2026-06-03days on market $270,418 Active 260 DOM
-
2026-06-03days on market $270,418 Active 259 DOM
-
2026-06-02days on market $270,418 Active 258 DOM
-
2026-05-31days on market $270,418 Active 257 DOM
ⓘ Source: listings_history table (triggers on properties + properties_extension) + one-shot
backfill from property_details.listing_events for pre-trigger history.
Nearby sold comps map
Loading sold comps map…
Walkable amenities ~0.75 mi
Loading nearby amenities…
Taxation est. · year 1
- Rental income
- $26,598
- − Mortgage interest
- −$15,148
- − Property taxes
- −$4,056
- − Insurance
- −$1,352
- − Repairs & maintenance
- −$2,128
- − Management
- −$2,128
- − Depreciation
- −$7,867
- Taxable loss
- −$6,081
- Est. tax savings @ 24.0%
- +$1,459
- After-tax cash flow
- $46/yr
For passive investors: Depreciation is non-cash, so a rental often shows a tax loss while cash-flowing — sheltering income. Rental losses are passive: they offset passive income freely, and up to $25,000/yr can offset ordinary (W-2) income if you actively participate and your MAGI is under $100k (phasing out to $0 by $150k); unused losses carry forward. On sale, claimed depreciation is recaptured at up to 25%, and gains may owe capital-gains tax (a 1031 exchange can defer both). Figures are a year-1 estimate at your 24.0% rate — not tax advice; consult a CPA.
Schools (NCES district)
- District
- Lexington 01
- NCES district ID
- 4502700
- Math proficiency
- 42% ▼ -12.00%
- Reading proficiency
- 53% ▼ -2.00%
- Median HH income
- $61,298
- Composite
- 41.75/100
- National rank
- #3399
- State rank
- #11 of 80 in SC
Livability — Red Bank
- Score
- 66/100
- State rank
- #121
- US rank
- #11985
Category grades
Schools grade is shown separately in the Schools card above.
Census & demographics
- Census place
- Red Bank, SC
- County
- Lexington County · 232,571 people
- Metro
- Columbia, SC
- Population (ZIP)
- 53,156
- Household income
- $77,229
- Rent vs Own
- Severe rent burden
- 935.0
Population outlook (Lexington County) Hauer SSP2
- Today (2025)
- 322,999 people
- By 2030
- 342,356 · +6.0%
- By 2040
- 377,715 · +16.9%
- By 2050
- 406,984 · +26.0%
- By 2075
- 465,447 · +44.1%
- By 2100
- 485,674 · +50.4%
Race, ethnicity, and origin ACS 2023
- Neighborhood character
- Predominantly White (72%)
- Race & ethnicity
- White 72% Black 14% Two or more races 7% Hispanic / Latino 6% Asian 2%
- Hispanic origin (detail)
- Mexican 2% Puerto Rican 1%
- Common ancestry
- Romanian 3% Italian 2% Slovak 1%
- Foreign-born
- 4% · Canada, China
- Languages at home
- 93% English-only · Spanish 5% Other Indo-European 1%
Political lean MEDSL · Lexington
- 2024 margin
- Solid R (+33.5) · D 32.5% · R 66.0% · Other 1.4%
- 2008→2024 swing
- +4.6pp toward D · 2008: -38.0pp · 2024: -33.5pp
- All cycles
- 2024: R+33.5 2020: R+30.1 2016: R+36.7 2012: R+37.8 2008: R+38.0
Not yet ingested
- Civics
- —
Market trends
- HPI YoY
- ▼ -59.20%
- Current HPI
- 249.8957
- Rent YoY
- ▲ 3.24%
- Metro
- Columbia, SC
- State GDP YoY
- ▲ 4.51%
- F500 in state
- 2
Industry mix (Fortune 500 HQ in SC)
| Industry | F500 HQs | Revenue |
|---|---|---|
| Packaging | 1 | $7B |
|
||
Cash-flow waterfall
monthlySold comps — $/sqft
last 12 mo · ≤1 miLoading sold comps…