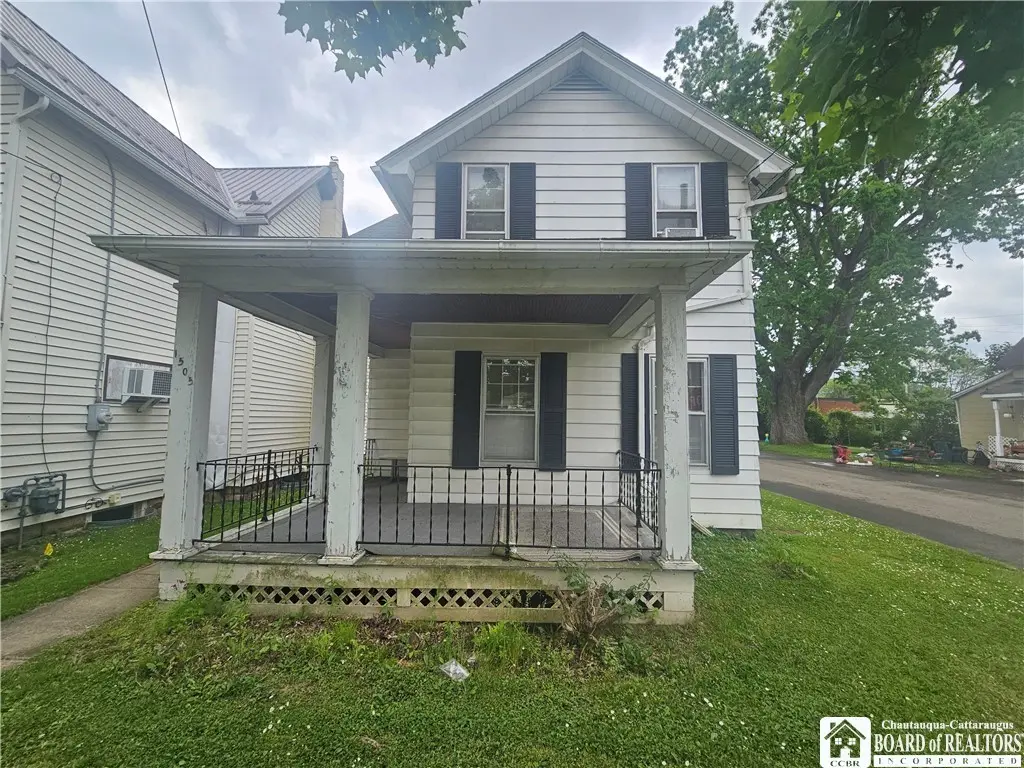
1505 W Henley St · Olean, NY
Flood risk 5/10 · Moderate
- FEMA flood zone
- X (shaded)
- Chance of flooding over 30 yrs
- 0.24%
- Est. flood insurance / yr
- $473 – $860
Fire risk 3/10 · Minor
- Est. fire insurance / yr
- $691 – $1,283
Heat risk 2/10 · Minimal
- Hot days now (above 90°F)
- 8 days/yr
- Hot days in 30 yrs
- 19 days/yr
Wind risk 1/10 · Minimal
- Chance of severe wind over 30 yrs
- —
Air-quality risk 1/10 · Minimal
- Unhealthy air days now
- 0 days/yr
- Unhealthy air days in 30 yrs
- 0 days/yr
Risk factors via First Street. Map © Google.
Why this score? — see what drove the C+ grade
The composite is a weighted blend of 9 inputs, each scored 0–100. Each bar is that input's sub-score; the figure is the points it added to the 100-point composite (weight × sub-score).
- Cash flow +29.0/30.0
- DSCR +10.0/10.0
- 1% rule +8.2/10.0
- ARV discount +5.7/15.0
- Livability +3.6/5.0
- Schools +3.5/10.0
- Rent growth +2.5/5.0
- Condition / age +2.5/5.0
- Appreciation +0.0/10.0
$89,900
🖨 Deal sheet (PDF) 📄 Offer letter ✓ Due diligence
Listing remarks
Welcome to this delightful 2-bedroom, 1 1/2-bathroom home located in the desirable West Olean neighborhood. Step inside to discover the beauty of hardwood floors that grace the entire home, exuding warmth and character. The main level features a cozy living area adorned with stunning stamped tin ceilings, adding a touch of vintage charm. Relax and unwind on the inviting front porch, perfect for enjoying the serene surroundings. Love to cook? The well-appointed kitchen offers ample counter space and modern appliances, making meal preparation a breeze. Adjacent to the kitchen is a lovely dining area, ideal for sharing meals with family and friends. Upstairs, you'll find two comfortable bedroo
Key facts
- Stamped tin ceilings
- Front porch
- Dining area
Tags
Property features AI
Exterior
- Parking: Detached garage; 2-car garage
- Utilities: Public water connected; Sewer available; High-speed internet available
- Home design: Two-story property; Resale condition; Asphalt roof
- Construction: Composite siding; Block foundation; Existing (previously built) structure
- Exterior features: Concrete driveway; Dirt driveway; Rectangular residential lot; City street frontage
Interior
- Kitchen: Appliances negotiable
- Bedrooms: 6 total rooms including living areas and laundry
- Flooring: Carpet; Laminate; Luxury vinyl; Varied flooring materials
- Bathrooms: 1 full bathroom; 1 half bathroom; Main level bathroom present
- Heating & cooling: Gas forced-air heating
- Interior features: Separate/formal dining room; Separate/formal living room
- Laundry & utility: Laundry in basement
Neighborhood map
What this means for you Summary
Snapshot
- This is a 2-bed/1.0-bath single-family listed at $90k.
Deal economics
- At list price, monthly cash flow is $308 ($4k/yr) — positive.
- The deal already cash-flows at list — no discount required.
- Meets the 1% rule at list price ($1k rent vs $90k).
- Cap rate 10.4% vs local median 8.1% in Olean — meaningfully above typical; check what's discounted (condition, days-on-market, listing class) to confirm the premium yield is real.
Location & tenants
- Location reads 72/100 on livability (#353 in NY) — a middle-class / working-renter tenant base. Strengths: cost of living A+, housing A+, health & safety A+; Watch: crime F, amenities F, commute F.
- Olean City School District (town): math 40% / reading 43% proficiency, ranked #511 of 590 in NY (top 87%) — families likely to look elsewhere, expect single-tenant / working-renter base with shorter leases.
- Market conditions: 143 active listings in the ZIP; 128 units permitted in Cattaraugus County in 2024 (21 in 5+ unit buildings).
Forward outlook
- Local home prices are declining (-3.0%/yr); year-one equity from $622 of loan paydown is wiped out by about $3k of value loss. Plan a longer hold.
- Cattaraugus County population projected at -28% by 2050 — secular population decline; favor cash flow + early exit over multi-decade hold.
- At projected returns (-3.0% appreciation + 3.0% rent growth), your $25k cash investment doubles in ~8 years — after that, you're playing with house money.
Negotiation context
- Only 12 days on market — expect competitive offers; lowballing is unlikely to land.
- 3 sale attempts since 10y ago with the ask held roughly flat each time — persistent listings suggest the price (not the market) is what's stuck; bring a comps-based counter.
- Current owner paid $70k; 28% above their basis — modest negotiation headroom, anchor on the comps not their cost.
Risks & watch-outs
- Watch-outs: built in 1925 — expect roof / HVAC / electrical / plumbing capex.
- Climate carrying-cost: moderate flood risk — expect insurance premiums to compound above CPI over the hold.
Questions for the listing agent
- Built in 1925 — when were the roof, HVAC, electrical panel, plumbing, and water heater last replaced?
- Is there a deadline driving the sale (1031 exchange, divorce, estate, relocation)? That informs how much negotiation room exists.
- Schools are B-rated — typically a magnet for longer-tenancy family renters. What's the average tenant stay here, and is there a school-zone premium baked into asking?
- Crime grade is F in this area — have there been break-ins, vandalism, or insurance claims at this property in the last 3 years? What carrier currently insures it and at what premium?
- What's the average days-on-market for RENTAL listings here right now (not sales)? A rising rental-DOM trend means longer vacancies and softer asking-rent achievability than the comps imply.
- What's the recent tenant-quality profile in this submarket — average credit score on applications, eviction rate, late-payment / NSF rate, and stable-employment percentage? A property-management company in the area should have these aggregated.
- How much new for-sale + rental construction is in the pipeline within 1–3 miles? Heavy new supply typically softens prices + rents 12–24 months out; constrained supply supports both.
Investment metrics
- 1% rule
- 1.32% ✓
- Cap rate
- 10.40%
- Cash-on-cash
- 14.66%
- DSCR
- 1.65
- GRM
- 6.3
CMA / ARV
- ARV (on-the-fly)
- $86,388
- Comps found
- 12
Show comp detail 12 sales within ~0.75 mi
| Address | Dist | Beds/Ba | Sqft | Sold | Price | $/sf | Match |
|---|---|---|---|---|---|---|---|
| 1705 W State St | 0.17mi | 3/1.0 (+1) | 1,156 (-8%) | 2mo | $37,500 | $32 | 73 |
| 224 S 16th St | 0.11mi | 2/2.0 | 1,120 (-10%) | 3mo | $69,000 | $62 | 71 |
| 708 Irving St | 0.48mi | 3/1.5 (+1) | 1,232 (-2%) | 5mo | $25,000 | $20 | 63 |
| 124 N 11th St | 0.31mi | 3/1.0 (+1) | 1,196 (-4%) | 12mo | $86,500 | $72 | 62 |
| 123 S 4th St | 0.65mi | 2/1.0 | 1,300 (+4%) | 4mo | $90,000 | $69 | 60 |
| 309 S 3rd St | 0.71mi | 3/1.0 (+1) | 1,270 (+1%) | 5mo | $10,000 | $8 | 55 |
| 111 N 24th St | 0.60mi | 3/2.0 (+1) | 1,248 (-0%) | 10mo | $150,000 | $120 | 54 |
| 218 N 12th St | 0.43mi | 3/1.5 (+1) | 1,344 (+7%) | 10mo | $99,900 | $74 | 52 |
| 334 N 13th St | 0.54mi | 2/1.0 | 1,392 (+11%) | 5mo | $74,500 | $54 | 52 |
| 130 S 6th St | 0.50mi | 3/2.0 (+1) | 1,320 (+5%) | 10mo | $150,000 | $114 | 51 |
| 110 N 19th St | 0.32mi | 3/1.5 (+1) | 1,088 (-13%) | 10mo | $152,000 | $140 | 48 |
| 1117 W Sullivan St | 0.47mi | 3/1.5 (+1) | 1,400 (+12%) | 6mo | $53,500 | $38 | 46 |
Match score weights: distance 35% · size 25% · config 20% · recency 20%. Top-matched comps best support the ARV.
Projected returns pro-forma
-3.0% appreciation · 3.0% rent growth · sell at horizon
- IRR
- 5.2%
- Equity multiple
- 1.20×
- Total profit
- $5,040
- Equity at exit
- $13,404
- IRR
- 14.6%
- Equity multiple
- 2.18×
- Total profit
- $29,697
- Equity at exit
- $7,773
Cash invested: $25,172 (down + closing). Projections, not guarantees.
Landlord ↔ Tenant lean methodology
- Overall (STATE)
- 15 Strongly Tenant-Friendly
- State New York
- 15 Strongly Tenant-Friendly · D+10
- County
- — inherits STATE
- City
- — inherits STATE
ZIP-level market 14760
- Home prices YoY
- -7.7%
- Active inventory
- 143
- Price-to-rent
- 6.3×
Monthly cashflow live
- Estimated rent
- $1,184 medium interval (Pro) →
- Mortgage (P&I)
- −$471
- Tax from tax record
- −$119 /mo · $1,429/yr
- Insurance
- −$37
- HOA
- −$0
- Vacancy / Maint / Mgmt
- −$249
- Net cashflow
- $308
Break-even live
Sensitivity live
| Price | -10% $358 | -5% $333 | +0% $308 | +5% $282 | +10% $257 |
|---|---|---|---|---|---|
| Rent | -10% $214 | -5% $261 | +0% $308 | +5% $354 | +10% $401 |
| Rate | -1.0pp $353 | -0.5pp $330 | base $308 | +0.5pp $284 | +1.0pp $261 |
UW: 25.0% down · 7.5% · 30yr · 1.5% tax · 5.0% vac · 8.0% maint · 8.0% mgmt
Financing live
Cash to close
- Down payment
- $22,475
- Closing costs
- $2,697
- Reserves months
- —
- Total cash needed
- —
Loan-product check · same deal, 3 products live
Conventional
25% down · 7.5% · 30yr
- Down + closing
- —
- Monthly P&I
- —
- Monthly cashflow
- —
- DSCR
- —
- Eligible?
- —
Personal DTI + credit; lowest rate.
DSCR
20% down · 8.5% · 30yr
- Down + closing
- —
- Monthly P&I
- —
- Monthly cashflow
- —
- DSCR
- —
- Eligible?
- —
No personal income docs; deal must DSCR.
Hard money
10% down · 12.0% · 12mo
- Down + closing
- —
- Monthly P&I
- —
- Monthly cashflow
- —
- DSCR
- —
- Eligible?
- —
Short-term bridge; refi at stabilization.
Listing history 9 events
-
2026-06-21days on market $89,900 Active 12 DOM
-
2026-06-18days on market $89,900 Active 10 DOM
-
2026-06-17days on market $89,900 Active 9 DOM
-
2026-06-16days on market $89,900 Active 8 DOM
-
2026-06-15days on market $89,900 Active 7 DOM
-
2026-06-13days on market $89,900 Active 5 DOM
-
2026-06-12days on market $89,900 Active 4 DOM
-
2026-06-09remarks 699-char remark
-
2026-06-09$89,900 Active 1 DOM
ⓘ Source: listings_history table (triggers on properties + properties_extension) + one-shot
backfill from property_details.listing_events for pre-trigger history.
Tax reassessment forecast NY · Partial reset (capped growth)
- Current annual tax
- $1,429 · $119/mo
- Projected year-2 tax
- $1,474 · $123/mo
- Expected delta
- +$45/yr (+$4/mo · 3.1%)
ⓘ Screening estimate from a state-policy table — verify with the county assessor before closing.
Climate risk First Street
- Flood 5/10 Major FEMA zone X (shaded) · 24% chance over 30 yrs
- Wildfire 3/10 Moderate
- Heat 2/10 Low 8 d/yr ≥90°F today · 19 d/yr by 30 yrs out
- Wind 1/10 Low
- Air quality 1/10 Low 0 unhealthy d/yr today · 0 by 30 yrs out
Nearby sold comps map
Loading sold comps map…
Walkable amenities ~0.75 mi
Loading nearby amenities…
Taxation est. · year 1
- Rental income
- $14,211
- − Mortgage interest
- −$5,036
- − Property taxes
- −$1,429
- − Insurance
- −$450
- − Repairs & maintenance
- −$1,137
- − Management
- −$1,137
- − Depreciation
- −$2,615
- Taxable income
- $2,407
- Est. tax owed @ 24.0%
- −$578
- After-tax cash flow
- $3,112/yr
For passive investors: Depreciation is non-cash, so a rental often shows a tax loss while cash-flowing — sheltering income. Rental losses are passive: they offset passive income freely, and up to $25,000/yr can offset ordinary (W-2) income if you actively participate and your MAGI is under $100k (phasing out to $0 by $150k); unused losses carry forward. On sale, claimed depreciation is recaptured at up to 25%, and gains may owe capital-gains tax (a 1031 exchange can defer both). Figures are a year-1 estimate at your 24.0% rate — not tax advice; consult a CPA.
Schools (NCES district)
- District
- Olean City School District
- NCES district ID
- 3621720
- Math proficiency
- 40% ▼ -10.00%
- Reading proficiency
- 43% ▼ -3.00%
- Median HH income
- $40,365
- Composite
- 34.81/100
- National rank
- #5104
- State rank
- #511 of 590 in NY
Livability — Olean
- Score
- 72/100
- State rank
- #353
- US rank
- #5930
Category grades
Schools grade is shown separately in the Schools card above.
Census & demographics
- Census place
- Olean, NY
- City population
- 17,272
- Population (ZIP)
- 17,272
Population outlook (Cattaraugus County) Hauer SSP2
- Today (2025)
- 71,623 people
- By 2030
- 67,751 · -5.4%
- By 2040
- 59,488 · -16.9%
- By 2050
- 51,601 · -28.0%
- By 2075
- 35,025 · -51.1%
- By 2100
- 21,243 · -70.3%
Race, ethnicity, and origin ACS 2023
- Neighborhood character
- Predominantly White (89%)
- Race & ethnicity
- White 89% Two or more races 5% Black 2% Asian 2% Hispanic / Latino 1%
- Common ancestry
- Romanian 10% Iranian 2% Lithuanian 1%
- Foreign-born
- 3% · Canada
- Languages at home
- 97% English-only · Other Indo-European 1%
Political lean MEDSL · Cattaraugus
- 2024 margin
- Solid R (+32.8) · D 33.6% · R 66.4%
- 2008→2024 swing
- -22.2pp toward R · 2008: -10.6pp · 2024: -32.8pp
- All cycles
- 2024: R+32.8 2020: R+29.5 2016: R+34.4 2012: R+13.4 2008: R+10.6
Not yet ingested
- Civics
- —
Market trends
- HPI YoY
- ▼ -19.85%
- Current HPI
- 237.327
- Rent YoY
- —
- Metro
- —
- State GDP YoY
- ▲ 2.60%
- F500 in state
- 92
Industry mix (Fortune 500 HQ in NY)
| Industry | F500 HQs | Revenue |
|---|---|---|
| Financial Services | 10 | $950B |
|
||
| Consumer Goods | 9 | $162B |
|
||
| Insurance | 4 | $225B |
|
||
| Telecommunications | 2 | $144B |
|
||
| Pharmaceuticals | 2 | $112B |
|
||
| Media / Entertainment | 2 | $69B |
|
||
Price history
+156.9% since first listed9 events — show timeline
- 2026-06-08 Listed $89,900 UNYREIS
- 2023-09-12 Listing Removed — UNYREIS
- 2023-08-14 Price Changed $79,900 UNYREIS
- 2023-07-24 Listed $89,900 UNYREIS
- 2022-06-14 Sold (Public Records) $70,000 Public Records
- 2017-06-01 Sold (MLS) $28,000 WNYREIS
- 2017-05-31 Sold (Public Records) $28,000 Public Records
- 2017-02-16 Pending — WNYREIS
- 2016-11-15 Listed $35,000 WNYREIS
Property tax history
+7.3%/yrLatest (2025): $1,429 · -43.8% YoY. Source: county tax records.
Cash-flow waterfall
monthlySold comps — $/sqft
last 12 mo · ≤1 miLoading sold comps…