 Multi-family
18 Davids Way · Stonington, ME
Flood risk 1/10 · Minimal
- FEMA flood zone
- X (unshaded)
- Chance of flooding over 30 yrs
- 0.0%
- Est. flood insurance / yr
- $473 – $860
Fire risk 2/10 · Minimal
- Est. fire insurance / yr
- $669 – $1,243
Heat risk 4/10 · Minor
- Hot days now (above 86°F)
- 7 days/yr
- Hot days in 30 yrs
- 16 days/yr
Wind risk 6/10 · Moderate
- Chance of severe wind over 30 yrs
- 75.0%
Air-quality risk 1/10 · Minimal
- Unhealthy air days now
- 0 days/yr
- Unhealthy air days in 30 yrs
- 0 days/yr
Risk factors via First Street. Map © Google.
Why this score? — see what drove the C+ grade
The composite is a weighted blend of 9 inputs, each scored 0–100. Each bar is that input's sub-score; the figure is the points it added to the 100-point composite (weight × sub-score).
- Cash flow +23.9/30.0
- Appreciation +8.0/10.0
- DSCR +7.7/10.0
- ARV discount +7.5/15.0
- 1% rule +5.0/10.0
- Schools +2.6/10.0
- Rent growth +2.5/5.0
- Livability +2.5/5.0
- Condition / age +2.5/5.0
$149,000
🖨 Deal sheet (PDF) 📄 Offer letter ✓ Due diligence
Multi-family units
County records classify this as Multi-Family (2-4 Unit). Listing-text estimate: 1 unit. estimate disagrees with records
Listing remarks
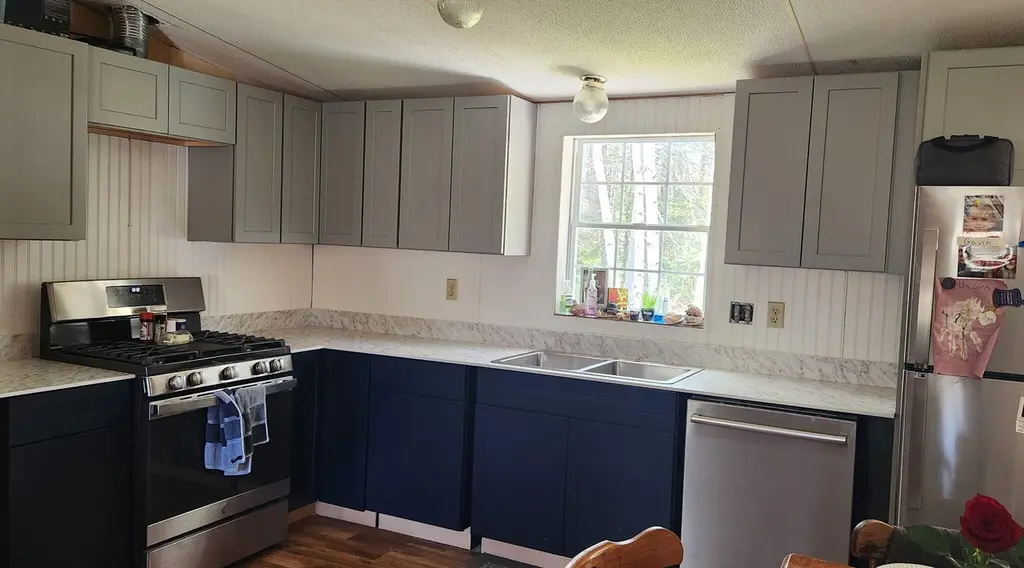
3 bed/2bath home on nearly 2 acres in a fishing community in Stonington. This home has a large, private yard with drive thru right of way. The house features a new kitchen, new appliances, and new windows. Needs some finish out of trim, etc. One of the few affordable homes on the Island.
Key facts
- New kitchen
- Private yard
- New appliances
Tags
Property features AI
Finance
- Financial info: Annual tax information available (taxes listed separately)
Exterior
- Parking: On-site common parking with 1–4 spaces
- Utilities: Well water; Electric service with circuit breakers; Pole utilities; Electric water heater
- Home design: Mobile home (double wide); Single-story (first-floor living and bedrooms); Built in 1990
- Construction: Aluminum siding on a mobile home; Block foundation; Composition roof
- Exterior features: Near public beach; Right of way access; Wooded lot; Private road frontage; Road surface: gravel and dirt
Interior
- Kitchen: Dishwasher; Microwave; Electric range; Refrigerator; Kitchen on the first floor (approx. 10' x 10')
- Bedrooms: Three bedrooms — all on the first floor (Bedroom 1: 10' x 10'; Bedroom 2: 10' x 12'; Bedroom 3: 12' x 12')
- Flooring: Carpet; Vinyl
- Bathrooms: 2 full bathrooms
- Heating & cooling: Baseboard heating
- Interior features: First-floor primary bedroom with private bath; Total of 5 rooms
- Laundry & utility: Laundry located on the main level
Neighborhood map
What this means for you Summary
Snapshot
- This is a 3-bed/2.0-bath multifamily listed at $149k.
Deal economics
- At list price, monthly cash flow is $290 ($3k/yr) — positive.
- The deal already cash-flows at list — no discount required.
- Meets the 1% rule at list price ($1k rent vs $149k).
- Recommended offer: $145k (3.0% below list) — sets the bar for market timing.
Location & tenants
- Location reads: area grade C — affects rentability + tenant quality, not the cash-flow math above.
- Deer Isle-Stonington CSD (rural): math 15% / reading 40% proficiency, ranked #173 of 185 in ME (top 94%) — low school quality limits family demand, transient renter base, plan for 1-2y turnover.
- Market conditions: 18 active listings in the ZIP; 270 units permitted in Hancock County in 2024 (0 in 5+ unit buildings).
Forward outlook
- In year one you build about $10k of equity ($1k loan paydown + $9k appreciation (6.0% local appreciation)).
- Hancock County population projected at -14% by 2050 — secular population decline; favor cash flow + early exit over multi-decade hold.
- At projected returns (6.0% appreciation + 3.0% rent growth), your $42k cash investment doubles in ~3 years — after that, you're playing with house money.
- By year 4, paydown + projected appreciation supports a ~$34k cash-out refi (75% LTV) — recoverable capital for the next deal without selling this one.
Negotiation context
- It's been on market 33 days — a 3% lower offer ($145k) is reasonable based on typical stale-listing flexibility.
Risks & watch-outs
- Climate carrying-cost: major wind risk, 75% chance of damaging wind over 30y — expect insurance premiums to compound above CPI over the hold.
Questions for the listing agent
- It's been on market 33 days. Have you received any prior offers? Is the seller open to a 3% concession, seller financing, or rate buy-down credit?
- Is there a deadline driving the sale (1031 exchange, divorce, estate, relocation)? That informs how much negotiation room exists.
- What's the average days-on-market for RENTAL listings here right now (not sales)? A rising rental-DOM trend means longer vacancies and softer asking-rent achievability than the comps imply.
- What's the recent tenant-quality profile in this submarket — average credit score on applications, eviction rate, late-payment / NSF rate, and stable-employment percentage? A property-management company in the area should have these aggregated.
- How much new apartment / multifamily construction is in the pipeline within 1–3 miles? Heavy new supply (>2% of stock underway) typically softens rents 12–24 months out; light construction supports rent growth.
Investment metrics
- 1% rule
- 1.00% ✓
- Cap rate
- 8.63%
- Cash-on-cash
- 8.34%
- DSCR
- 1.37
- GRM
- 8.3
CMA / ARV
No comps found within radius.
Projected returns pro-forma
6.04% appreciation · 3.0% rent growth · sell at horizon
- IRR
- 22.3%
- Equity multiple
- 2.48×
- Total profit
- $61,792
- Equity at exit
- $94,050
- IRR
- 21.2%
- Equity multiple
- 5.00×
- Total profit
- $167,067
- Equity at exit
- $170,887
Cash invested: $41,720 (down + closing). Projections, not guarantees.
Landlord ↔ Tenant lean methodology
- Overall (STATE)
- 41 Moderately Tenant-Leaning
- State Maine
- 41 Moderately Tenant-Leaning · D+2
- County
- — inherits STATE
- City
- — inherits STATE
ZIP-level market 04681
- Home prices YoY
- 3.6%
- Active inventory
- 18
- Price-to-rent
- 8.3×
Monthly cashflow live
- Estimated rent
- $1,495 medium interval (Pro) →
- Mortgage (P&I)
- −$781
- Tax from tax record
- −$48 /mo · $570/yr
- Insurance
- −$62
- HOA
- −$0
- Vacancy / Maint / Mgmt
- −$314
- Net cashflow
- $290
Break-even live
Sensitivity live
| Price | -10% $374 | -5% $332 | +0% $290 | +5% $248 | +10% $206 |
|---|---|---|---|---|---|
| Rent | -10% $172 | -5% $231 | +0% $290 | +5% $349 | +10% $408 |
| Rate | -1.0pp $365 | -0.5pp $328 | base $290 | +0.5pp $251 | +1.0pp $212 |
UW: 25.0% down · 7.5% · 30yr · 1.5% tax · 5.0% vac · 8.0% maint · 8.0% mgmt
Financing live
Cash to close
- Down payment
- $37,250
- Closing costs
- $4,470
- Reserves months
- —
- Total cash needed
- —
Loan-product check · same deal, 3 products live
Conventional
25% down · 7.5% · 30yr
- Down + closing
- —
- Monthly P&I
- —
- Monthly cashflow
- —
- DSCR
- —
- Eligible?
- —
Personal DTI + credit; lowest rate.
DSCR
20% down · 8.5% · 30yr
- Down + closing
- —
- Monthly P&I
- —
- Monthly cashflow
- —
- DSCR
- —
- Eligible?
- —
No personal income docs; deal must DSCR.
Hard money
10% down · 12.0% · 12mo
- Down + closing
- —
- Monthly P&I
- —
- Monthly cashflow
- —
- DSCR
- —
- Eligible?
- —
Short-term bridge; refi at stabilization.
Listing history 22 events
-
2026-06-21days on market $149,000 Active 33 DOM
-
2026-06-21days on market $149,000 Active 32 DOM
-
2026-06-18days on market $149,000 Active 30 DOM
-
2026-06-17days on market $149,000 Active 29 DOM
-
2026-06-16days on market $149,000 Active 28 DOM
-
2026-06-15days on market $149,000 Active 27 DOM
-
2026-06-13days on market $149,000 Active 25 DOM
-
2026-06-12days on market $149,000 Active 24 DOM
-
2026-06-09days on market $149,000 Active 21 DOM
-
2026-06-08days on market $149,000 Active 20 DOM
-
2026-06-07days on market $149,000 Active 19 DOM
-
2026-06-07pricedays on market $149,000 Active 18 DOM
-
2026-06-04days on market $165,000 Active 15 DOM
-
2026-06-02days on market $165,000 Active 14 DOM
-
2026-06-01days on market $165,000 Active 13 DOM
-
2026-05-31days on market $165,000 Active 12 DOM
-
2026-05-31days on market $165,000 Active 11 DOM
-
2026-05-19$165,000 Active
-
2025-06-20price $179,900
-
2025-03-31price $189,900
-
2025-03-25price $199,900
-
2025-03-20price $210,000
ⓘ Source: listings_history table (triggers on properties + properties_extension) + one-shot
backfill from property_details.listing_events for pre-trigger history.
Tax reassessment forecast ME · Partial reset (capped growth)
- Current annual tax
- $570 · $48/mo
- Projected year-2 tax
- $1,298 · $108/mo
- Expected delta
- +$728/yr (+$61/mo · 127.8%)
ⓘ Screening estimate from a state-policy table — verify with the county assessor before closing.
Climate risk First Street
- Flood 1/10 Low FEMA zone X (unshaded) · 0% chance over 30 yrs
- Wildfire 2/10 Low
- Heat 4/10 Moderate 7 d/yr ≥86°F today · 16 d/yr by 30 yrs out
- Wind 6/10 Major 75% chance of damaging wind over 30 yrs
- Air quality 1/10 Low 0 unhealthy d/yr today · 0 by 30 yrs out
Nearby sold comps map
Loading sold comps map…
Walkable amenities ~0.75 mi
Loading nearby amenities…
Taxation est. · year 1
- Rental income
- $17,940
- − Mortgage interest
- −$8,346
- − Property taxes
- −$570
- − Insurance
- −$745
- − Repairs & maintenance
- −$1,435
- − Management
- −$1,435
- − Depreciation
- −$4,335
- Taxable income
- $1,073
- Est. tax owed @ 24.0%
- −$258
- After-tax cash flow
- $3,223/yr
For passive investors: Depreciation is non-cash, so a rental often shows a tax loss while cash-flowing — sheltering income. Rental losses are passive: they offset passive income freely, and up to $25,000/yr can offset ordinary (W-2) income if you actively participate and your MAGI is under $100k (phasing out to $0 by $150k); unused losses carry forward. On sale, claimed depreciation is recaptured at up to 25%, and gains may owe capital-gains tax (a 1031 exchange can defer both). Figures are a year-1 estimate at your 24.0% rate — not tax advice; consult a CPA.
Schools (NCES district)
- District
- Deer Isle-Stonington CSD
- NCES district ID
- 2304895
- Math proficiency
- 15% ▬ 0.00%
- Reading proficiency
- 40% ▲ 15.00%
- Median HH income
- $43,358
- Composite
- 26.39/100
- National rank
- #12658
- State rank
- #173 of 185 in ME
Livability — Stonington
No livability data for this city. (Only ~50 U.S. cities are tracked.)
Census & demographics
- Population (ZIP)
- 906
Population outlook (Hancock County) Hauer SSP2
- Today (2025)
- 53,608 people
- By 2030
- 52,594 · -1.9%
- By 2040
- 49,556 · -7.6%
- By 2050
- 46,152 · -13.9%
- By 2075
- 39,678 · -26.0%
- By 2100
- 33,690 · -37.2%
Race, ethnicity, and origin ACS 2023
- Neighborhood character
- Predominantly White (97%)
- Race & ethnicity
- White 97% Hispanic / Latino 2%
- Common ancestry
- Slovak 7% Romanian 2% Scottish 2%
- Foreign-born
- 6% · Canada
Political lean MEDSL · Hancock
- 2024 margin
- D (+11.8) · D 54.7% · R 42.9% · Other 2.4%
- 2008→2024 swing
- -7.5pp toward R · 2008: 19.3pp · 2024: 11.8pp
- All cycles
- 2024: D+11.8 2020: D+12.4 2016: D+7.6 2012: D+16.7 2008: D+19.3
Not yet ingested
- Civics
- —
Market trends
- HPI YoY
- ▲ 6.04%
- Current HPI
- 175.5837
- Rent YoY
- —
- Metro
- —
- State GDP YoY
- —
- F500 in state
- 0
Price history
-21.4% since first listed5 events — show timeline
- 2026-05-19 Listed $165,000 MREIS
- 2025-06-20 Price Changed $179,900 MREIS
- 2025-03-31 Price Changed $189,900 MREIS
- 2025-03-25 Price Changed $199,900 MREIS
- 2025-03-20 Price Changed $210,000 MREIS
Property tax history
+3.7%/yrLatest (2025): $570 · +4.0% YoY. Source: county tax records.
Cash-flow waterfall
monthlySold comps — $/sqft
last 12 mo · ≤1 miLoading sold comps…