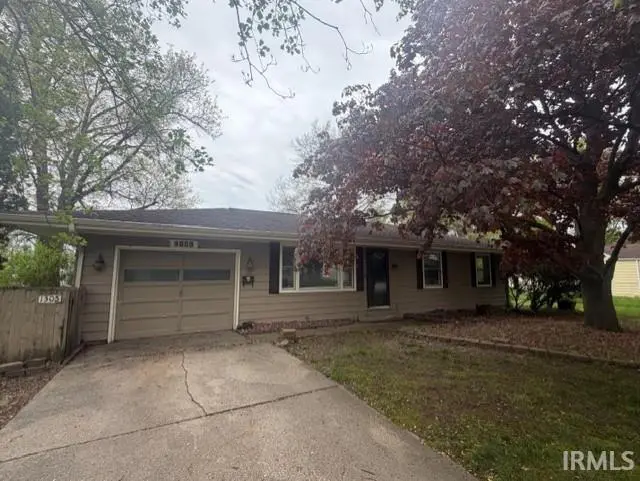
1305 Laurel St · Elkhart, IN
Flood risk 1/10 · Minimal
- FEMA flood zone
- X (unshaded)
- Chance of flooding over 30 yrs
- 0.0%
- Est. flood insurance / yr
- $507 – $1,088
Fire risk 1/10 · Minimal
- Est. fire insurance / yr
- $717 – $1,331
Heat risk 2/10 · Minimal
- Hot days now (above 101°F)
- 7 days/yr
- Hot days in 30 yrs
- 16 days/yr
Wind risk 2/10 · Minimal
- Chance of severe wind over 30 yrs
- —
Air-quality risk 3/10 · Minor
- Unhealthy air days now
- 2 days/yr
- Unhealthy air days in 30 yrs
- 3 days/yr
Risk factors via First Street. Map © Google.
Why this score? — see what drove the B- grade
The composite is a weighted blend of 9 inputs, each scored 0–100. Each bar is that input's sub-score; the figure is the points it added to the 100-point composite (weight × sub-score).
- Cash flow +25.0/30.0
- ARV discount +15.0/15.0
- DSCR +8.1/10.0
- 1% rule +5.9/10.0
- Rent growth +4.3/5.0
- Livability +3.4/5.0
- Condition / age +2.5/5.0
- Schools +1.8/10.0
- Appreciation +0.0/10.0
$120,000
🖨 Deal sheet (PDF) 📄 Offer letter ✓ Due diligence
Listing remarks
With a little TLC this could be an adorable 3 bedroom and 1 bath home. This home is located in a subdivision where the homes are very well manicured. The home offers a large fenced back yard on a corner lot.
Key facts
- Fenced back yard
- Corner lot
- 0.32 acre lot
Tags
Property features AI
Finance
- Other: Shed(s) on the property; Zoned R-1 One Family Dwelling
Exterior
- Parking: Attached garage with one parking space; Concrete driveway and off-street parking
- Utilities: Public water; Public sewer
- Home design: Single-family residence (site-built); One story
- Construction: Vinyl siding; Asphalt roof
- Exterior features: Patio; Chain link fencing; Corner, level lot
Interior
- Flooring: Carpet; Vinyl
- Bathrooms: One full bathroom (main level)
- Heating & cooling: Central air conditioning; Natural gas forced-air heating
- Interior features: One fireplace (no special features); Crawl space basement; Six total rooms
- Laundry & utility: Washer hookup on main level
Neighborhood map
What this means for you Summary
Snapshot
- This is a 3-bed/1.0-bath single-family listed at $120k.
Deal economics
- At list price, monthly cash flow is $260 ($3k/yr) — positive.
- The deal already cash-flows at list — no discount required.
- Meets the 1% rule at list price ($1k rent vs $120k).
- Cap rate 8.9% vs local median 4.0% in Elkhart — top-decile yield for the area; either an underpriced asset or a hidden risk that comps aren't pricing in. Stress-test before assuming the spread holds.
Location & tenants
- Location reads 68/100 on livability (#224 in IN) — a middle-class / working-renter tenant base. Strengths: cost of living A+, housing A+, health & safety A+; Watch: amenities C-, crime F, commute F.
- Elkhart Community Schools (urban): math 18% / reading 25% proficiency, ranked #271 of 301 in IN (top 90%) — low school quality limits family demand, transient renter base, plan for 1-2y turnover.
- Zoned schools: Mary Daly Elementary School (math 13% / reading 12%, grade F, #890 of 994 statewide, top 90%, 465 students, 78% FRL); West Side Middle School (math 15% / reading 31%, grade F, #263 of 330 statewide, top 80%, 582 students, 67% FRL); Elkhart High School (math 17% / reading 51%, grade F, #285 of 369 statewide, top 78%, 3,325 students, 63% FRL).
- Market conditions: Rents rising fast (+7.0%/yr); 270 active listings in the ZIP; 9 comparable units currently listed for rent nearby; rentals at typical pace (median 23d on market — plan ~3-4 weeks tenant-placement turnaround); 44% of comp listings sitting > 30 days — soft ceiling on asking rent; 484 units permitted in Elkhart County in 2024 (136 in 5+ unit buildings).
Forward outlook
- Local home prices are declining (-3.0%/yr); year-one equity from $830 of loan paydown is wiped out by about $4k of value loss. Plan a longer hold.
- Elkhart County population projected at +7% by 2050 — modest demand growth; plan on rents tracking national, not racing it.
- At projected returns (-3.0% appreciation + 7.0% rent growth), your $34k cash investment doubles in ~8 years — after that, you're playing with house money.
Negotiation context
- Only 13 days on market — expect competitive offers; lowballing is unlikely to land.
Questions for the listing agent
- Built in 1960 — when were the roof, HVAC, electrical panel, plumbing, and water heater last replaced?
- Is there a deadline driving the sale (1031 exchange, divorce, estate, relocation)? That informs how much negotiation room exists.
- Schools are F-rated, which usually means shorter tenancies and higher turnover. Who's the typical renter profile here, and what's been the actual vacancy rate?
- Crime grade is F in this area — have there been break-ins, vandalism, or insurance claims at this property in the last 3 years? What carrier currently insures it and at what premium?
- What's the average days-on-market for RENTAL listings here right now (not sales)? A rising rental-DOM trend means longer vacancies and softer asking-rent achievability than the comps imply.
- What's the recent tenant-quality profile in this submarket — average credit score on applications, eviction rate, late-payment / NSF rate, and stable-employment percentage? A property-management company in the area should have these aggregated.
- How much new for-sale + rental construction is in the pipeline within 1–3 miles? Heavy new supply typically softens prices + rents 12–24 months out; constrained supply supports both.
Investment metrics
- 1% rule
- 1.09% ✓
- Cap rate
- 8.90%
- Cash-on-cash
- 9.30%
- DSCR
- 1.41
- GRM
- 7.6
CMA / ARV
- ARV (median comp)
- $156,616
- List price
- $120,000
- Delta
- -23.38%
- Verdict
- UNDERPRICED
- Comps
- 20 within 1.0 mi
Show comp detail 12 sales within ~0.75 mi
| Address | Dist | Beds/Ba | Sqft | Sold | Price | $/sf | Match |
|---|---|---|---|---|---|---|---|
| 1501 Maple Row | 0.19mi | 2/1.0 (-1) | 1,042 (+0%) | 8mo | $186,500 | $179 | 79 |
| 1121 Maple Row | 0.16mi | 2/1.0 (-1) | 988 (-5%) | 6mo | $143,000 | $145 | 74 |
| 1323 Laurel St | 0.04mi | 3/1.0 | 1,168 (+12%) | 4mo | $165,000 | $141 | 74 |
| 418 Myrtle St | 0.41mi | 3/1.0 | 1,080 (+4%) | 8mo | $159,000 | $147 | 68 |
| 319 Massachusetts Ave | 0.58mi | 2/1.0 (-1) | 1,056 (+2%) | 1mo | $185,000 | $175 | 64 |
| 614 Maple Row | 0.52mi | 3/1.0 | 928 (-11%) | 4mo | $95,000 | $102 | 55 |
| 1320 Woodward Ave | 0.51mi | 2/1.0 (-1) | 980 (-6%) | 9mo | $195,000 | $199 | 54 |
| 148 Union St | 0.71mi | 3/1.0 | 1,130 (+9%) | 1mo | $175,000 | $155 | 52 |
| 1106 Strong Ave | 0.35mi | 2/1.0 (-1) | 896 (-14%) | 6mo | $189,000 | $211 | 50 |
| 1132 Edwardsburg Ave | 0.71mi | 2/1.0 (-1) | 1,101 (+6%) | 9mo | $67,500 | $61 | 44 |
| 321 Martin St | 0.72mi | 3/1.0 | 960 (-8%) | 12mo | $171,000 | $178 | 44 |
| 1107 Edwardsburg Ave | 0.68mi | 2/2.0 (-1) | 1,157 (+11%) | 3mo | $210,000 | $182 | 38 |
Match score weights: distance 35% · size 25% · config 20% · recency 20%. Top-matched comps best support the ARV.
Projected returns pro-forma
-3.0% appreciation · 7.03% rent growth · sell at horizon
- IRR
- 2.0%
- Equity multiple
- 1.08×
- Total profit
- $2,665
- Equity at exit
- $17,892
- IRR
- 15.1%
- Equity multiple
- 2.44×
- Total profit
- $48,315
- Equity at exit
- $10,375
Cash invested: $33,600 (down + closing). Projections, not guarantees.
Landlord ↔ Tenant lean methodology
- Overall (STATE)
- 90 Strongly Landlord-Friendly
- State Indiana
- 90 Strongly Landlord-Friendly · R+11
- County
- — inherits STATE
- City
- — inherits STATE
ZIP-level market 46514
- Rents YoY
- 7.0%
- Active inventory
- 270
- Price-to-rent
- 7.6×
Monthly cashflow live
- Estimated rent
- $1,312 high interval (Pro) →
- Mortgage (P&I)
- −$629
- Tax from tax record
- −$97 /mo · $1,163/yr
- Insurance
- −$50
- HOA
- −$0
- Vacancy / Maint / Mgmt
- −$276
- Net cashflow
- $260
Break-even live
Sensitivity live
| Price | -10% $328 | -5% $294 | +0% $260 | +5% $226 | +10% $193 |
|---|---|---|---|---|---|
| Rent | -10% $157 | -5% $209 | +0% $260 | +5% $312 | +10% $364 |
| Rate | -1.0pp $321 | -0.5pp $291 | base $260 | +0.5pp $229 | +1.0pp $198 |
UW: 25.0% down · 7.5% · 30yr · 1.5% tax · 5.0% vac · 8.0% maint · 8.0% mgmt
Financing live
Cash to close
- Down payment
- $30,000
- Closing costs
- $3,600
- Reserves months
- —
- Total cash needed
- —
Loan-product check · same deal, 3 products live
Conventional
25% down · 7.5% · 30yr
- Down + closing
- —
- Monthly P&I
- —
- Monthly cashflow
- —
- DSCR
- —
- Eligible?
- —
Personal DTI + credit; lowest rate.
DSCR
20% down · 8.5% · 30yr
- Down + closing
- —
- Monthly P&I
- —
- Monthly cashflow
- —
- DSCR
- —
- Eligible?
- —
No personal income docs; deal must DSCR.
Hard money
10% down · 12.0% · 12mo
- Down + closing
- —
- Monthly P&I
- —
- Monthly cashflow
- —
- DSCR
- —
- Eligible?
- —
Short-term bridge; refi at stabilization.
Rent comps 9 comps
| Address | Beds | Baths | Sqft | Rent | $/sqft | DOM | Units | Dist |
|---|---|---|---|---|---|---|---|---|
| 647 W Lexington Ave Unit C Elkhart, IN | 2.0 | 1.0 | 860 | $995 | $1.16 | 22d | 1 | 0.71mi |
| 660 Stamp Dr Elkhart, IN | 2.0 | 1.0 | 1120 | $1,250 | $1.12 | 22d | 1 | 0.78mi |
| 2301 W Lexington Ave Elkhart, IN | 2.0–3.0 | 1.5–2.0 | 1077 | $1,460 | $1.36 | 22d | 6 | 0.84mi |
| 323 Sherman St Unit A Elkhart, IN | 2.0 | 1.0 | 750 | $850 | $1.13 | 45d | 1 | 0.84mi |
| 524 W High St Unit 1/2 Elkhart, IN | 2.0 | 1.0 | 750 | $775 | $1.03 | 45d | 1 | 0.88mi |
| 229 W Jackson Blvd Elkhart, IN | 2.0 | 1.0 | 625 | $725 | $1.16 | 45d | 2 | 0.96mi |
| 1568 W Franklin St Elkhart, IN | 3.0 | 2.0 | 1486 | $1,600 | $1.08 | 22d | 1 | 1.04mi |
| 1023 Cone St Elkhart, IN | 2.0 | 1.0 | 1112 | $1,200 | $1.08 | 46d | 1 | 1.44mi |
| 200 Jr. Achievement Dr Elkhart, IN | 1.0–2.0 | 1.0–2.0 | 946 | $1,770 | $1.87 | 22d | 10 | 1.47mi |
Listing history 1 events
-
2026-05-07$120,000 Active 208-char remark
ⓘ Source: listings_history table (triggers on properties + properties_extension) + one-shot
backfill from property_details.listing_events for pre-trigger history.
Tax reassessment forecast IN · Partial reset (capped growth)
- Current annual tax
- $1,163 · $97/mo
- Projected year-2 tax
- $1,163 · $97/mo
- Expected delta
- $0/yr ($0/mo · 0.0%)
ⓘ Screening estimate from a state-policy table — verify with the county assessor before closing.
Climate risk First Street
- Flood 1/10 Low FEMA zone X (unshaded) · 0% chance over 30 yrs
- Wildfire 1/10 Low
- Heat 2/10 Low 7 d/yr ≥101°F today · 16 d/yr by 30 yrs out
- Wind 2/10 Low
- Air quality 3/10 Moderate 2 unhealthy d/yr today · 3 by 30 yrs out
Nearby sold comps map
Loading sold comps map…
Walkable amenities ~0.75 mi
Loading nearby amenities…
Taxation est. · year 1
- Rental income
- $15,746
- − Mortgage interest
- −$6,722
- − Property taxes
- −$1,163
- − Insurance
- −$600
- − Repairs & maintenance
- −$1,260
- − Management
- −$1,260
- − Depreciation
- −$3,491
- Taxable income
- $1,251
- Est. tax owed @ 24.0%
- −$300
- After-tax cash flow
- $2,825/yr
For passive investors: Depreciation is non-cash, so a rental often shows a tax loss while cash-flowing — sheltering income. Rental losses are passive: they offset passive income freely, and up to $25,000/yr can offset ordinary (W-2) income if you actively participate and your MAGI is under $100k (phasing out to $0 by $150k); unused losses carry forward. On sale, claimed depreciation is recaptured at up to 25%, and gains may owe capital-gains tax (a 1031 exchange can defer both). Figures are a year-1 estimate at your 24.0% rate — not tax advice; consult a CPA.
Schools (NCES district)
- District
- Elkhart Community Schools
- NCES district ID
- 1803270
- Math proficiency
- 18% ▼ -12.00%
- Reading proficiency
- 25% ▼ -9.00%
- Median HH income
- $42,881
- Composite
- 18.45/100
- National rank
- #8928
- State rank
- #271 of 301 in IN
Livability — Elkhart
- Score
- 68/100
- State rank
- #224
- US rank
- #9852
Category grades
Schools grade is shown separately in the Schools card above.
Census & demographics
- Census place
- Elkhart, IN
- County
- Elkhart County · 107,928 people
- City population
- 74,260
- Metro
- Elkhart-Goshen, IN
- Population (ZIP)
- 42,389
- Household income
- $65,833
- Rent vs Own
- Severe rent burden
- 1061.0
Population outlook (Elkhart County) Hauer SSP2
- Today (2025)
- 213,761 people
- By 2030
- 218,103 · +2.0%
- By 2040
- 225,381 · +5.4%
- By 2050
- 229,447 · +7.3%
- By 2075
- 232,856 · +8.9%
- By 2100
- 214,088 · +0.2%
Race, ethnicity, and origin ACS 2023
- Neighborhood character
- Predominantly White (74%)
- Race & ethnicity
- White 74% Hispanic / Latino 14% Two or more races 6% Black 5% Asian 1%
- Hispanic origin (detail)
- Mexican 10%
- Common ancestry
- Lithuanian 2% Romanian 2% Italian 2%
- Foreign-born
- 8% · Canada
- Languages at home
- 89% English-only · Spanish 10%
Political lean MEDSL · Elkhart
- 2024 margin
- Solid R (+32.4) · D 33.1% · R 65.5% · Other 1.4%
- 2008→2024 swing
- -21.2pp toward R · 2008: -11.2pp · 2024: -32.4pp
- All cycles
- 2024: R+32.4 2020: R+28.1 2016: R+32.4 2012: R+26.5 2008: R+11.2
Not yet ingested
- Civics
- —
Market trends
- HPI YoY
- ▼ -246.78%
- Current HPI
- 225.6
- Rent YoY
- ▲ 7.03%
- Metro
- Elkhart-Goshen, IN
- State GDP YoY
- ▲ 2.90%
- F500 in state
- 18
Industry mix (Fortune 500 HQ in IN)
| Industry | F500 HQs | Revenue |
|---|---|---|
| Industrial Machinery | 2 | $37B |
|
||
| Healthcare | 1 | $177B |
|
||
| Pharmaceuticals | 1 | $45B |
|
||
| Metals / Steel | 1 | $18B |
|
||
| Agriculture | 1 | $17B |
|
||
| Packaging | 1 | $12B |
|
||
Price history
2 events — show timeline
- 2026-05-20 Pending — IRMLS
- 2026-05-07 Listed $120,000 IRMLS
Property tax history
+4.1%/yrLatest (2025): $1,163 · +1.5% YoY. Source: county tax records.
Cash-flow waterfall
monthlySold comps — $/sqft
last 12 mo · ≤1 miLoading sold comps…