 🏗️ New Construction
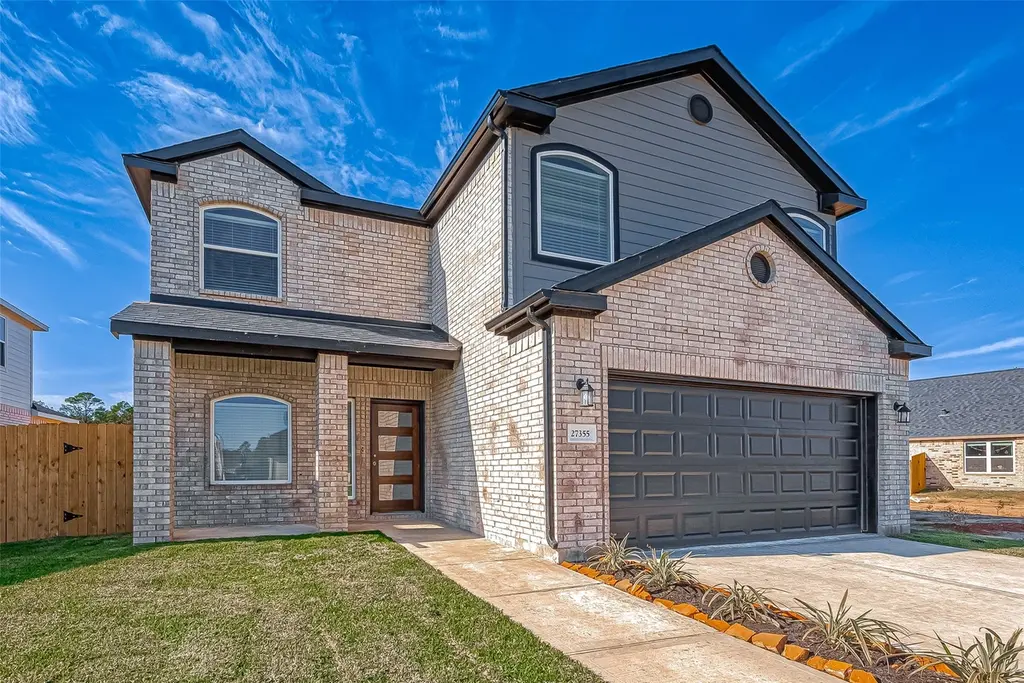
27211 Mockingbird Terrace Ln · Tomball, TX
Flood risk No data
- FEMA flood zone
- —
- Chance of flooding over 30 yrs
- —
- Est. flood insurance / yr
- —
Fire risk No data
- Est. fire insurance / yr
- —
Heat risk No data
- Hot days now (above threshold)
- —
- Hot days in 30 yrs
- —
Wind risk No data
- Chance of severe wind over 30 yrs
- —
Air-quality risk No data
- Unhealthy air days now
- —
- Unhealthy air days in 30 yrs
- —
Risk factors via First Street. Map © Google.
Why this score? — see what drove the C- grade
The composite is a weighted blend of 9 inputs, each scored 0–100. Each bar is that input's sub-score; the figure is the points it added to the 100-point composite (weight × sub-score).
- Cash flow +13.2/30.0
- Appreciation +10.0/10.0
- ARV discount +7.5/15.0
- DSCR +4.0/10.0
- Schools +3.9/10.0
- Livability +3.8/5.0
- 1% rule +2.7/10.0
- Rent growth +2.6/5.0
- Condition / age +2.5/5.0
$319,990
🖨 Deal sheet (PDF) 📄 Offer letter ✓ Due diligence
Listing remarks
This two-story home spans 2409 square feet and includes four bedrooms and 2 1/2 baths. The ground floor features the large dining/living room connected to the beautiful chef's kitchen with upgraded granite counters. The kitchen is also connected to the very spacious breakfast room and great room. A plan perfect for family gatherings! The master bedroom features a tub/shower combo with double vanity sinks and a huge walk-in closet, big enough for any shoe collection!! Upstairs offers a giant game room representing the heart of the 3 bedrooms surrounding it. No Back Neighbors!!! This home is an energy star builder home, which means it is designed to be energy efficient. Loaded with warranties
Key facts
- Giant game room
- Chef's kitchen
- 5,851 sq ft lot
Tags
Property features AI
Finance
- Other: Full ownership; New construction; Has additional parcels
- HOA & community: Community managed by Lead Association Management; Annual association fee of $450 (includes common areas); Community pool; Playground; Trails; Curbs
Exterior
- Parking: Attached garage with 2 spaces; Driveway; Garage door opener
- Security: Smoke detectors
- Utilities: Public water; Public sewer
- Home design: Residential property; New construction (built 2026); Faces east; Slab foundation
- Construction: Brick and cement siding construction; Composition roof; Built in 2026
- Exterior features: Deck; Patio; Private yard; Back yard fencing; Subdivision lot setting; Concrete road access
Interior
- Kitchen: Dishwasher; Free-standing range; Gas oven; Gas range; Microwave; Disposal; Instant hot water; Kitchen island; Breakfast bar; ENERGY STAR qualified appliances; Tankless water heater
- Bedrooms: Total rooms: 8
- Flooring: Carpet; Plank flooring; Vinyl
- Bathrooms: 2 full bathrooms; 1 half bathroom
- Heating & cooling: Central heating (gas); Central air (electric); Energy-efficient HVAC features
- Interior features: Breakfast bar; Double vanity; Granite counters; Hollywood bath; Kitchen island; Kitchen/family room combo; Primary bedroom with en-suite bath; Pantry; Soaking tub; Separate shower; Tub/shower combination; Window treatments; Ceiling fans; Programmable thermostat; Insulated doors; Low emissivity windows; Window coverings; Ventilation for improved indoor air quality
- Laundry & utility: Washer hookup; Electric dryer hookup
Neighborhood map
What this means for you Summary
Snapshot
- This is a 4-bed/2.5-bath land listed at $320k.
Deal economics
- At list price, monthly cash flow is $-5 ($-54/yr) — negative.
- To cash-flow at today's rent, offer at most $291k (9.1% below list).
- To meet the 1% rule (rent ≥ 1% of price), the offer needs to be $225k (29.6% below list).
- Recommended offer: $225k (29.6% below list) — sets the bar for 1% rule.
- Cap rate 6.3% vs local median 2.7% in Tomball — top-decile yield for the area; either an underpriced asset or a hidden risk that comps aren't pricing in. Stress-test before assuming the spread holds.
Location & tenants
- Location reads 75/100 on livability (#155 in TX, #4,239 nationally) — a middle-class / working-renter tenant base. Strengths: cost of living A+, housing A+, health & safety B+; Watch: amenities F, commute F.
- Magnolia ISD (rural): math 42% / reading 45% proficiency, ranked #247 of 826 in TX (top 30%) — families likely to look elsewhere, expect single-tenant / working-renter base with shorter leases.
- Zoned schools: Cedric C Smith (math 48% / reading 42%, grade D-, #1,133 of 4,322 statewide, top 27%, 724 students, 55% FRL); Bear Branch J H (math 44% / reading 46%, grade D, #479 of 1,662 statewide, top 29%, 1,076 students, 37% FRL); Magnolia H S (math 47% / reading 62%, grade C-, #379 of 1,632 statewide, top 26%, 2,248 students, 31% FRL) — zoned schools at 41% FRL track the district average.
- Market conditions: Rents flat; 1622 active listings in the ZIP; 1 comparable units currently listed for rent nearby; high-income renter base; 13,259 units permitted in Montgomery County in 2024 (1,402 in 5+ unit buildings).
Forward outlook
- In year one you build about $31k of equity ($2k loan paydown + $29k appreciation (10.0% local appreciation)).
- Montgomery County population projected at +65% by 2050 — long-run rental-demand tailwind backs the buy-and-hold thesis.
- At projected returns (10.0% appreciation + 0.3% rent growth), your $82k cash investment doubles in ~3 years — after that, you're playing with house money.
- By year 2, paydown + projected appreciation supports a ~$50k cash-out refi (75% LTV) — recoverable capital for the next deal without selling this one.
Negotiation context
- It's been on market 22 days — a 2% lower offer ($315k) is reasonable based on typical stale-listing flexibility.
- 6 sale attempts with the ask held roughly flat each time — persistent listings suggest the price (not the market) is what's stuck; bring a comps-based counter.
Questions for the listing agent
- What do current leases actually rent for vs. the listed asking? Can we see a recent rent roll and the last 12 months of T-12 income?
- What does the HOA fee cover, when was the last increase, and are there any pending special assessments or reserve-fund shortfalls?
- Is there a deadline driving the sale (1031 exchange, divorce, estate, relocation)? That informs how much negotiation room exists.
- Schools are B-rated — typically a magnet for longer-tenancy family renters. What's the average tenant stay here, and is there a school-zone premium baked into asking?
- What's the average days-on-market for RENTAL listings here right now (not sales)? A rising rental-DOM trend means longer vacancies and softer asking-rent achievability than the comps imply.
- What's the recent tenant-quality profile in this submarket — average credit score on applications, eviction rate, late-payment / NSF rate, and stable-employment percentage? A property-management company in the area should have these aggregated.
- How much new for-sale + rental construction is in the pipeline within 1–3 miles? Heavy new supply typically softens prices + rents 12–24 months out; constrained supply supports both.
Investment metrics
- 1% rule
- 0.77% ✗
- Cap rate
- 6.27%
- Cash-on-cash
- -0.07%
- DSCR
- 1.00
- GRM
- 10.8
CMA / ARV
- ARV (median comp)
- $291,731
- List price
- $319,990
- Delta
- 9.69%
- Verdict
- FAIR
- Comps
- 20 within 1.0 mi
Projected returns pro-forma
10.0% appreciation · 0.32% rent growth · sell at horizon
- IRR
- 23.4%
- Equity multiple
- 2.87×
- Total profit
- $152,572
- Equity at exit
- $262,815
- IRR
- 20.3%
- Equity multiple
- 6.37×
- Total profit
- $438,569
- Equity at exit
- $566,770
Cash invested: $81,685 (down + closing). Projections, not guarantees.
Landlord ↔ Tenant lean methodology
- Overall (STATE)
- 87 Strongly Landlord-Friendly
- State Texas
- 87 Strongly Landlord-Friendly · R+5
- County
- — inherits STATE
- City
- — inherits STATE
ZIP-level market 77354
- Home prices YoY
- 2.4%
- Rents YoY
- 0.3%
- Active inventory
- 1622
- Price-to-rent
- 11.8×
Monthly cashflow live
- Estimated rent
- $2,253 medium interval (Pro) →
- Mortgage (P&I)
- −$1,530
- Tax from tax record
- −$95 /mo · $1,141/yr
- Insurance
- −$122
- HOA
- −$38
- Vacancy / Maint / Mgmt
- −$473
- Net cashflow
- $-5
Break-even live
Sensitivity live
| Price | -10% $161 | -5% $78 | +0% $-5 | +5% $-87 | +10% $-170 |
|---|---|---|---|---|---|
| Rent | -10% $-183 | -5% $-94 | +0% $-5 | +5% $84 | +10% $173 |
| Rate | -1.0pp $142 | -0.5pp $70 | base $-5 | +0.5pp $-80 | +1.0pp $-157 |
UW: 25.0% down · 7.5% · 30yr · 1.5% tax · 5.0% vac · 8.0% maint · 8.0% mgmt
Financing live
Cash to close
- Down payment
- $72,933
- Closing costs
- $8,752
- Reserves months
- —
- Total cash needed
- —
Loan-product check · same deal, 3 products live
Conventional
25% down · 7.5% · 30yr
- Down + closing
- —
- Monthly P&I
- —
- Monthly cashflow
- —
- DSCR
- —
- Eligible?
- —
Personal DTI + credit; lowest rate.
DSCR
20% down · 8.5% · 30yr
- Down + closing
- —
- Monthly P&I
- —
- Monthly cashflow
- —
- DSCR
- —
- Eligible?
- —
No personal income docs; deal must DSCR.
Hard money
10% down · 12.0% · 12mo
- Down + closing
- —
- Monthly P&I
- —
- Monthly cashflow
- —
- DSCR
- —
- Eligible?
- —
Short-term bridge; refi at stabilization.
Rent comps 1 comps
| Address | Beds | Baths | Sqft | Rent | $/sqft | DOM | Units | Dist |
|---|---|---|---|---|---|---|---|---|
| 9829 Glen Brook Ln Magnolia, TX | 4.0 | 2.0 | 1637 | $1,999 | $1.22 | 4d | 1 | 0.50mi |
HOA detail
- Monthly dues
- $38 · $456/yr
Listing history 28 events
-
2026-06-18status $319,990 Pending 22 DOM
-
2026-06-17days on market $319,990 Active 22 DOM
-
2026-06-16days on market $319,990 Active 21 DOM
-
2026-06-15days on market $319,990 Active 20 DOM
-
2026-06-13days on market $319,990 Active 18 DOM
-
2026-06-09days on market $319,990 Active 14 DOM
-
2026-06-08days on market $319,990 Active 13 DOM
-
2026-06-07days on market $319,990 Active 12 DOM
-
2026-06-04days on market $319,990 Active 9 DOM
-
2026-06-03days on market $319,990 Active 8 DOM
-
2026-06-02days on market $319,990 Active 7 DOM
-
2026-06-01days on market $319,990 Active 6 DOM
-
2026-05-31days on market $319,990 Active 5 DOM
-
2026-04-29price $319,990 884-char remark
-
2026-04-18$328,995 Active 884-char remark
-
2026-04-18historical
-
2026-03-14price $328,995
-
2026-03-11$338,995 Active
-
2026-03-11historical
-
2026-03-05price $338,995
-
2026-01-27$348,995 Active
-
2026-01-27historical
-
2026-01-16price $348,995
-
2025-12-28price $333,995
-
2025-12-18$332,495 Active
-
2025-12-18historical
-
2025-11-22price $332,495
-
2025-11-11$330,495 Active
ⓘ Source: listings_history table (triggers on properties + properties_extension) + one-shot
backfill from property_details.listing_events for pre-trigger history.
Tax reassessment forecast TX · Resets to sale price
- Current annual tax
- $1,141 · $95/mo
- Projected year-2 tax
- $5,856 · $488/mo
- Expected delta
- +$4,715/yr (+$393/mo · 413.1%)
ⓘ Screening estimate from a state-policy table — verify with the county assessor before closing.
Nearby sold comps map
Loading sold comps map…
Walkable amenities ~0.75 mi
Loading nearby amenities…
Taxation est. · year 1
- Rental income
- $27,038
- − Mortgage interest
- −$16,341
- − Property taxes
- −$1,141
- − Insurance
- −$1,459
- − Repairs & maintenance
- −$2,163
- − Management
- −$2,163
- − HOA
- −$456
- − Depreciation
- −$8,487
- Taxable loss
- −$5,172
- Est. tax savings @ 24.0%
- +$1,241
- After-tax cash flow
- $1,187/yr
For passive investors: Depreciation is non-cash, so a rental often shows a tax loss while cash-flowing — sheltering income. Rental losses are passive: they offset passive income freely, and up to $25,000/yr can offset ordinary (W-2) income if you actively participate and your MAGI is under $100k (phasing out to $0 by $150k); unused losses carry forward. On sale, claimed depreciation is recaptured at up to 25%, and gains may owe capital-gains tax (a 1031 exchange can defer both). Figures are a year-1 estimate at your 24.0% rate — not tax advice; consult a CPA.
Schools (NCES district)
- District
- Magnolia ISD
- NCES district ID
- 4828740
- Math proficiency
- 42% ▼ -7.00%
- Reading proficiency
- 45% ▼ -4.00%
- Median HH income
- $71,692
- Composite
- 39.46/100
- National rank
- #3958
- State rank
- #247 of 826 in TX
Livability — Tomball
- Score
- 75/100
- State rank
- #155
- US rank
- #4239
Category grades
Schools grade is shown separately in the Schools card above.
Census & demographics
- County
- Montgomery County · 663,713 people
- City population
- 113,991
- Metro
- Houston-The Woodlands-Sugar Land, TX
- Population (ZIP)
- 44,900
- Household income
- $112,504
- Rent vs Own
- Severe rent burden
- 586.0
Population outlook (Montgomery County) Hauer SSP2
- Today (2025)
- 713,896 people
- By 2030
- 805,263 · +12.8%
- By 2040
- 992,708 · +39.1%
- By 2050
- 1,179,590 · +65.2%
- By 2075
- 1,628,084 · +128.1%
- By 2100
- 1,937,880 · +171.5%
Race, ethnicity, and origin ACS 2023
- Neighborhood character
- Predominantly White (66%)
- Race & ethnicity
- White 66% Hispanic / Latino 25% Two or more races 18% Black 3% Asian 1%
- Hispanic origin (detail)
- Mexican 14% Puerto Rican 1%
- Common ancestry
- Lithuanian 4% Slovak 2% Italian 2%
- Foreign-born
- 11% · Canada, Vietnam
- Languages at home
- 83% English-only · Spanish 15% Other Indo-European 1% German/W. Germanic 1%
Political lean MEDSL · Montgomery
- 2024 margin
- Solid R (+45.5) · D 26.8% · R 72.3%
- 2008→2024 swing
- +7.2pp toward D · 2008: -52.7pp · 2024: -45.5pp
- All cycles
- 2024: R+45.5 2020: R+43.8 2016: R+51.4 2012: R+60.7 2008: R+52.7
Not yet ingested
- Civics
- —
Market trends
- HPI YoY
- ▲ 12.09%
- Current HPI
- 512.87
- Rent YoY
- ▲ 0.32%
- Metro
- Houston-The Woodlands-Sugar Land, TX
- State GDP YoY
- ▲ 3.95%
- F500 in state
- 110
Industry mix (Fortune 500 HQ in TX)
| Industry | F500 HQs | Revenue |
|---|---|---|
| Energy | 16 | $1,198B |
|
||
| Technology | 5 | $198B |
|
||
| Engineering / Construction | 4 | $72B |
|
||
| Energy Services | 3 | $60B |
|
||
| Utilities | 3 | $41B |
|
||
| Healthcare | 2 | $330B |
|
||
Price history
-3.2% since first listed18 events — show timeline
- 2026-06-18 Pending — HARMLS
- 2026-05-26 Listing Removed — HARMLS
- 2026-05-26 Listed $319,990 HARMLS
- 2026-04-29 Price Changed $319,990 HARMLS
- 2026-04-18 Listing Removed — HARMLS
- 2026-04-18 Listed $328,995 HARMLS
- 2026-03-14 Price Changed $328,995 HARMLS
- 2026-03-11 Listing Removed — HARMLS
- 2026-03-11 Listed $338,995 HARMLS
- 2026-03-05 Price Changed $338,995 HARMLS
- 2026-01-27 Listing Removed — HARMLS
- 2026-01-27 Listed $348,995 HARMLS
- 2026-01-16 Price Changed $348,995 HARMLS
- 2025-12-28 Price Changed $333,995 HARMLS
- 2025-12-18 Listing Removed — HARMLS
- 2025-12-18 Listed $332,495 HARMLS
- 2025-11-22 Price Changed $332,495 HARMLS
- 2025-11-11 Listed $330,495 HARMLS
Property tax history
-30.1%/yrLatest (2025): $1,141 · -30.1% YoY. Source: county tax records.
Cash-flow waterfall
monthlySold comps — $/sqft
last 12 mo · ≤1 miLoading sold comps…