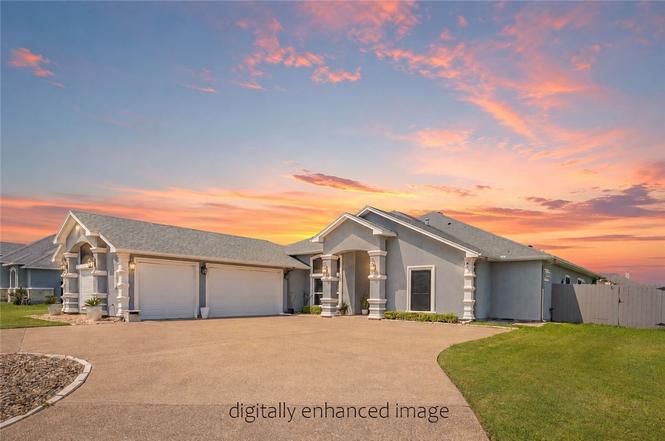
2126 Shady Oak St · Corpus Christi, TX
Flood risk 6/10 · Moderate
- FEMA flood zone
- X (unshaded)
- Chance of flooding over 30 yrs
- 0.55%
- Est. flood insurance / yr
- $507 – $1,088
Fire risk 4/10 · Minor
- Est. fire insurance / yr
- $1,222 – $2,270
Heat risk 10/10 · Severe
- Hot days now (above 108°F)
- 7 days/yr
- Hot days in 30 yrs
- 28 days/yr
Wind risk 9/10 · Severe
- Chance of severe wind over 30 yrs
- 99.0%
Air-quality risk 1/10 · Minimal
- Unhealthy air days now
- 0 days/yr
- Unhealthy air days in 30 yrs
- 0 days/yr
Risk factors via First Street. Map © Google.
Why this score? — see what drove the B+ grade
The composite is a weighted blend of 9 inputs, each scored 0–100. Each bar is that input's sub-score; the figure is the points it added to the 100-point composite (weight × sub-score).
- Cash flow +30.0/30.0
- 1% rule +10.0/10.0
- DSCR +10.0/10.0
- ARV discount +7.5/15.0
- Appreciation +6.6/10.0
- Schools +4.1/10.0
- Livability +3.9/5.0
- Rent growth +2.5/5.0
- Condition / age +2.5/5.0
$260,999
🖨 Deal sheet 📄 Offer letter ✓ Due diligence
Listing remarks MLS
Welcome to 2126 Shadi Street in beautiful Corpus Christi! This Coastal home provides an open living area that flows gracefully into the dining space and a well-appointed kitchen designed for both functionality and charm offering a gas stove and double oven! The bedrooms provide a retreat, each offering a sense of calm and privacy. Every corner of the home has been curated to feel both welcoming and refined. Outdoors, enjoy a spacious yard under the Texas sky. Thoughtful upgrades include French drains, hurricane shutters, gutters, blinds and a generator hook up! Perfectly positioned near local dining, shopping, and the scenic coastline, this home offers the best of Corpus Christi living!
Key facts
- Central game room
- Attached bathroom
- Walk-in closet
Tags
Neighborhood map
What this means for you Summary
Snapshot
- This is a 4-bed/2.5-bath single-family listed at $261k.
Deal economics
- At list price, monthly cash flow is $1k ($16k/yr) — positive.
- The deal already cash-flows at list — no discount required.
- Meets the 1% rule at list price ($4k rent vs $261k).
- Recommended offer: $238k (9.0% below list) — sets the bar for market timing.
- Cap rate 12.5% vs local median 3.6% in Corpus Christi — top-decile yield for the area; either an underpriced asset or a hidden risk that comps aren't pricing in. Stress-test before assuming the spread holds.
Location & tenants
- Location reads 78/100 on livability (#66 in TX, #2,404 nationally) — a middle-class / working-renter tenant base. Strengths: commute A+, cost of living A+, housing A+; Watch: crime F.
- Flour Bluff ISD (urban): math 43% / reading 51% proficiency, ranked #209 of 826 in TX (top 25%) — families likely to look elsewhere, expect single-tenant / working-renter base with shorter leases.
- Market conditions: 29 active listings in the ZIP; 1 comparable units currently listed for rent nearby; 1,397 units permitted in Nueces County in 2024 (47 in 5+ unit buildings).
Forward outlook
- In year one you build about $10k of equity ($2k loan paydown + $8k appreciation (3.1% local appreciation)).
- Nueces County population projected at +36% by 2050 — long-run rental-demand tailwind backs the buy-and-hold thesis.
- At projected returns (3.1% appreciation + 3.0% rent growth), your $73k cash investment doubles in ~3 years — after that, you're playing with house money.
- By year 4, paydown + projected appreciation supports a ~$34k cash-out refi (75% LTV) — recoverable capital for the next deal without selling this one.
Negotiation context
- It's been on market 109 days — a 9% lower offer ($238k) is reasonable based on typical stale-listing flexibility.
- 3 sale attempts since 7y ago; this cycle's ask has dropped $464k (64%) from the opening price — seller is motivated, your offer sets the floor, not the list.
Risks & watch-outs
- Climate carrying-cost: major flood risk; severe wind risk, 99% chance of damaging wind over 30y; extreme-heat days projected 7→28/yr by 2055 (HVAC capex compounding) — expect insurance premiums to compound above CPI over the hold.
Questions for the listing agent
- It's been on market 109 days. Have you received any prior offers? Is the seller open to a 9% concession, seller financing, or rate buy-down credit?
- Why hasn't it sold? Are there any deal-killer items the seller is aware of (foundation, flood, title, zoning, code violations)?
- Is there a deadline driving the sale (1031 exchange, divorce, estate, relocation)? That informs how much negotiation room exists.
- Crime grade is F in this area — have there been break-ins, vandalism, or insurance claims at this property in the last 3 years? What carrier currently insures it and at what premium?
- What's the average days-on-market for RENTAL listings here right now (not sales)? A rising rental-DOM trend means longer vacancies and softer asking-rent achievability than the comps imply.
- What's the recent tenant-quality profile in this submarket — average credit score on applications, eviction rate, late-payment / NSF rate, and stable-employment percentage? A property-management company in the area should have these aggregated.
- How much new for-sale + rental construction is in the pipeline within 1–3 miles? Heavy new supply typically softens prices + rents 12–24 months out; constrained supply supports both.
Investment metrics
- 1% rule
- 1.53% ✓
- Cap rate
- 12.53%
- Cash-on-cash
- 22.27%
- DSCR
- 1.99
- GRM
- 5.4
CMA / ARV
- ARV (on-the-fly)
- $750,458
- Comps found
- 9
Show comp detail 9 sales within ~0.75 mi
| Address | Dist | Beds/Ba | Sqft | Sold | Price | $/sf | Match |
|---|---|---|---|---|---|---|---|
| 2165 Rufus St | 0.16mi | 4/3.5 | 3,730 (+2%) | 12mo | $725,000 | $194 | 75 |
| 2157 Rufus St | 0.15mi | 4/3.5 | 3,765 (+3%) | 15mo | $725,000 | $193 | 71 |
| 2158 Shadi St | 0.09mi | 4/3.0 | 3,203 (-12%) | 6mo | $660,000 | $206 | 69 |
| 2150 Rufus St | 0.11mi | 5/3.5 (+1) | 3,557 (-2%) | 20mo | $773,000 | $217 | 65 |
| 2190 Arman St | 0.20mi | 4/3.0 | 3,480 (-4%) | 22mo | $709,000 | $204 | 63 |
| 2118 Rufus St | 0.08mi | 4/3.0 | 3,156 (-13%) | 14mo | $697,500 | $221 | 61 |
| 2165 Arman St | 0.13mi | 5/3.0 (+1) | 3,918 (+8%) | 17mo | $859,900 | $219 | 60 |
| 3525 Black Oak Dr | 0.52mi | 4/3.5 | 3,314 (-9%) | 21mo | $595,000 | $180 | 39 |
| 1701 Duval Ct | 0.72mi | 4/3.5 | 3,339 (-8%) | 15mo | $809,999 | $243 | 36 |
Match score weights: distance 35% · size 25% · config 20% · recency 20%. Top-matched comps best support the ARV.
Projected returns pro-forma
3.14% appreciation · 3.0% rent growth · sell at horizon
- IRR
- 28.7%
- Equity multiple
- 2.64×
- Total profit
- $119,765
- Equity at exit
- $119,356
- IRR
- 29.1%
- Equity multiple
- 5.15×
- Total profit
- $303,092
- Equity at exit
- $185,512
Cash invested: $73,080 (down + closing). Projections, not guarantees.
Landlord ↔ Tenant lean methodology
- Overall (STATE)
- 87 Strongly Landlord-Friendly
- State Texas
- 87 Strongly Landlord-Friendly · R+5
- County
- — inherits STATE
- City
- — inherits STATE
ZIP-level market 78409
- Home prices YoY
- 1.9%
- Active inventory
- 29
- Price-to-rent
- 5.4×
Monthly cashflow live
- Estimated rent
- $4,000 medium interval (Pro) →
- Mortgage (P&I)
- −$1,369
- Tax est. 1.5%
- −$326 /mo · $3,915/yr
- Insurance
- −$109
- HOA
- −$0
- Vacancy / Maint / Mgmt
- −$840
- Net cashflow
- $1,356
Break-even live
UW: 25.0% down · 7.5% · 30yr · 1.5% tax · 5.0% vac · 8.0% maint · 8.0% mgmt
Financing live
Cash to close
- Down payment
- $65,250
- Closing costs
- $7,830
- Reserves months
- —
- Total cash needed
- —
Loan-product check · same deal, 3 products live
Conventional
25% down · 7.5% · 30yr
- Down + closing
- —
- Monthly P&I
- —
- Monthly cashflow
- —
- DSCR
- —
- Eligible?
- —
Personal DTI + credit; lowest rate.
DSCR
20% down · 8.5% · 30yr
- Down + closing
- —
- Monthly P&I
- —
- Monthly cashflow
- —
- DSCR
- —
- Eligible?
- —
No personal income docs; deal must DSCR.
Hard money
10% down · 12.0% · 12mo
- Down + closing
- —
- Monthly P&I
- —
- Monthly cashflow
- —
- DSCR
- —
- Eligible?
- —
Short-term bridge; refi at stabilization.
Rent comps 1 comps
| Address | Beds | Baths | Sqft | Rent | $/sqft | DOM | Units | Dist |
|---|---|---|---|---|---|---|---|---|
| 3417 Newcastle Dr Corpus Christi, TX | 5.0 | 3.5 | 3259 | $4,000 | $1.23 | 43d | 1 | 0.66mi |
Listing history 23 events
-
2026-04-27status Pending
-
2026-04-20$725,000 Active 699-char remark
Show marketing remark (699 chars)
Welcome to 2126 Shadi Street in beautiful Corpus Christi! This Coastal home provides an open living area that flows gracefully into the dining space and a well-appointed kitchen designed for both functionality and charm offering a gas stove and double oven! The bedrooms provide a retreat, each offering a sense of calm and privacy. Every corner of the home has been curated to feel both welcoming and refined. Outdoors, enjoy a spacious yard under the Texas sky. Thoughtful upgrades include French drains, hurricane shutters, gutters, blinds and a generator hook up! Perfectly positioned near local dining, shopping, and the scenic coastline, this home offers the best of Corpus Christi living!
-
2026-04-17price $260,999
-
2026-04-09price $263,999
-
2026-04-03price $265,999
-
2026-03-28price $267,999
-
2026-03-24price $269,999
-
2026-03-12price $268,999
-
2026-02-13price $270,999
-
2026-02-10price $280,999
-
2026-02-06price $279,999
-
2026-02-04price $269,999
-
2026-01-31price $268,999
-
2026-01-21price $266,999
-
2026-01-08$267,999 New
-
2020-04-13historical
-
2020-04-10soldstatus Closed
-
2020-03-23status Pending
-
2020-02-08price $505,900
-
2020-01-25price $509,900
-
2019-12-27price $513,900
-
2019-08-27price $519,900
-
2019-05-28$545,000 Active
ⓘ Source: listings_history table (triggers on properties + properties_extension) + one-shot
backfill from property_details.listing_events for pre-trigger history.
Climate risk First Street
- Flood 6/10 Major FEMA zone X (unshaded) · 55% chance over 30 yrs
- Wildfire 4/10 Moderate
- Heat 10/10 Extreme 7 d/yr ≥108°F today · 28 d/yr by 30 yrs out
- Wind 9/10 Extreme 99% chance of damaging wind over 30 yrs
- Air quality 1/10 Low 0 unhealthy d/yr today · 0 by 30 yrs out
Nearby sold comps map
Loading sold comps map…
Walkable amenities ~0.75 mi
Loading nearby amenities…
Taxation est. · year 1
- Rental income
- $48,000
- − Mortgage interest
- −$14,620
- − Property taxes
- −$3,915
- − Insurance
- −$1,305
- − Repairs & maintenance
- −$3,840
- − Management
- −$3,840
- − Depreciation
- −$7,593
- Taxable income
- $12,887
- Est. tax owed @ 24.0%
- −$3,093
- After-tax cash flow
- $13,183/yr
For passive investors: Depreciation is non-cash, so a rental often shows a tax loss while cash-flowing — sheltering income. Rental losses are passive: they offset passive income freely, and up to $25,000/yr can offset ordinary (W-2) income if you actively participate and your MAGI is under $100k (phasing out to $0 by $150k); unused losses carry forward. On sale, claimed depreciation is recaptured at up to 25%, and gains may owe capital-gains tax (a 1031 exchange can defer both). Figures are a year-1 estimate at your 24.0% rate — not tax advice; consult a CPA.
Schools (NCES district)
- District
- Flour Bluff ISD
- NCES district ID
- 4819380
- Math proficiency
- 43% ▼ -12.00%
- Reading proficiency
- 51% ▼ -2.00%
- Median HH income
- $57,162
- Composite
- 40.96/100
- National rank
- #3604
- State rank
- #209 of 826 in TX
Livability — Corpus Christi
- Score
- 78/100
- State rank
- #66
- US rank
- #2404
Category grades
Schools grade is shown separately in the Schools card above.
Census & demographics
- Census place
- Corpus Christi, TX
- City population
- 296,836
- Population (ZIP)
- 2,504
Population outlook (Nueces County) Hauer SSP2
- Today (2025)
- 418,037 people
- By 2030
- 447,123 · +7.0%
- By 2040
- 505,911 · +21.0%
- By 2050
- 567,522 · +35.8%
- By 2075
- 729,686 · +74.6%
- By 2100
- 847,087 · +102.6%
Race, ethnicity, and origin ACS 2023
- Neighborhood character
- Predominantly Hispanic (73%)
- Race & ethnicity
- Hispanic / Latino 73% Two or more races 43% White 25% Native American 1%
- Hispanic origin (detail)
- Mexican 70%
- Common ancestry
- Romanian 1%
- Foreign-born
- 14% · Canada, Guatemala
- Languages at home
- 60% English-only · Spanish 39%
Political lean MEDSL · Nueces
- 2024 margin
- R (+11.5) · D 43.8% · R 55.3%
- 2008→2024 swing
- -7.1pp toward R · 2008: -4.4pp · 2024: -11.5pp
- All cycles
- 2024: R+11.5 2020: R+2.9 2016: R+1.5 2012: R+3.2 2008: R+4.4
Not yet ingested
- Civics
- —
Market trends
- HPI YoY
- ▲ 3.14%
- Current HPI
- 164.8665
- Rent YoY
- —
- Metro
- —
- State GDP YoY
- ▲ 3.95%
- F500 in state
- 110
Industry mix (Fortune 500 HQ in TX)
| Industry | F500 HQs | Revenue |
|---|---|---|
| Energy | 16 | $1,198B |
|
||
| Technology | 5 | $198B |
|
||
| Engineering / Construction | 4 | $72B |
|
||
| Energy Services | 3 | $60B |
|
||
| Utilities | 3 | $41B |
|
||
| Healthcare | 2 | $330B |
|
||
Price history
+33.0% since first listed23 events — show timeline
- 2026-04-27 Pending — LERA
- 2026-04-20 Listed $725,000 CBMLS
- 2026-04-17 Price Changed $260,999 LERA
- 2026-04-09 Price Changed $263,999 LERA
- 2026-04-03 Price Changed $265,999 LERA
- 2026-03-28 Price Changed $267,999 LERA
- 2026-03-24 Price Changed $269,999 LERA
- 2026-03-12 Price Changed $268,999 LERA
- 2026-02-13 Price Changed $270,999 LERA
- 2026-02-10 Price Changed $280,999 LERA
- 2026-02-06 Price Changed $279,999 LERA
- 2026-02-04 Price Changed $269,999 LERA
- 2026-01-31 Price Changed $268,999 LERA
- 2026-01-21 Price Changed $266,999 LERA
- 2026-01-08 Listed $267,999 LERA
- 2020-04-13 Delisted — CBMLS
- 2020-04-10 Sold (MLS) — CBMLS
- 2020-03-23 Pending — CBMLS
- 2020-02-08 Price Changed $505,900 CBMLS
- 2020-01-25 Price Changed $509,900 CBMLS
- 2019-12-27 Price Changed $513,900 CBMLS
- 2019-08-27 Price Changed $519,900 CBMLS
- 2019-05-28 Listed $545,000 CBMLS
Property tax history
+31.1%/yrLatest (2025): $14,467 · +13.0% YoY. Source: county tax records.
Cash-flow waterfall
monthlySold comps — $/sqft
last 12 mo · ≤1 miLoading sold comps…