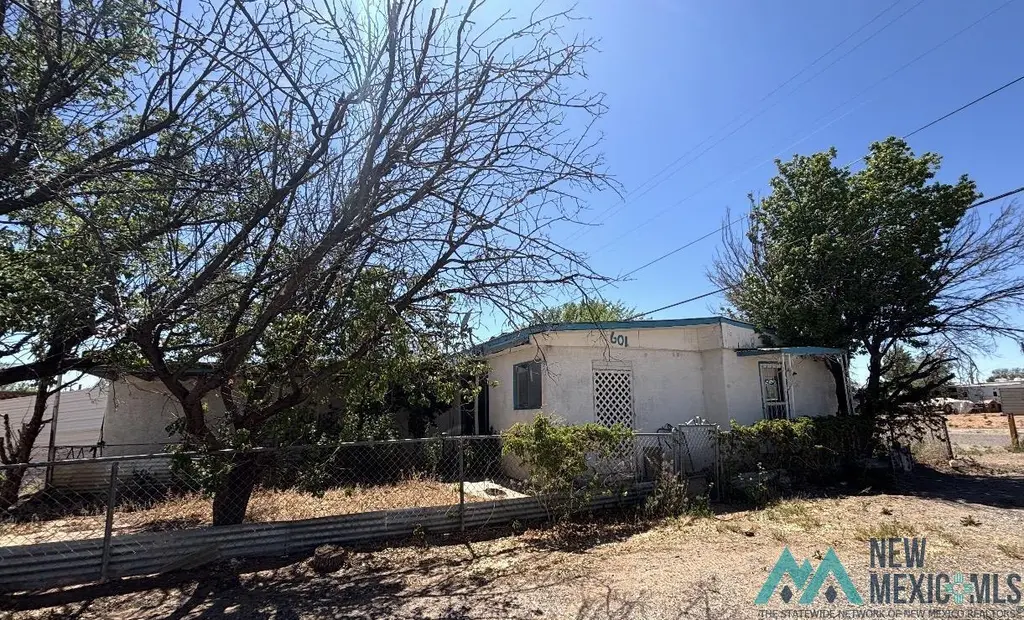
601 Valencia Ave · Milan, NM
Flood risk 3/10 · Minor
- FEMA flood zone
- X (shaded)
- Chance of flooding over 30 yrs
- 0.18%
- Est. flood insurance / yr
- $507 – $1,088
Fire risk 5/10 · Moderate
- Est. fire insurance / yr
- $706 – $1,312
Heat risk 3/10 · Minor
- Hot days now (above 92°F)
- 7 days/yr
- Hot days in 30 yrs
- 17 days/yr
Wind risk 1/10 · Minimal
- Chance of severe wind over 30 yrs
- —
Air-quality risk 1/10 · Minimal
- Unhealthy air days now
- 0 days/yr
- Unhealthy air days in 30 yrs
- 0 days/yr
Risk factors via First Street. Map © Google.
Why this score? — see what drove the B grade
The composite is a weighted blend of 9 inputs, each scored 0–100. Each bar is that input's sub-score; the figure is the points it added to the 100-point composite (weight × sub-score).
- Cash flow +30.0/30.0
- 1% rule +10.0/10.0
- DSCR +10.0/10.0
- ARV discount +7.5/15.0
- Appreciation +5.0/10.0
- Livability +2.9/5.0
- Rent growth +2.5/5.0
- Condition / age +2.5/5.0
- Schools +1.8/10.0
$45,000
🖨 Deal sheet (PDF) 📄 Offer letter ✓ Due diligence
Listing remarks
Affordable home that needs so work. Sits on a large corner lot with a 3 car detached garage. It needs interior and exterior work. Generate into an income property or fix up to your liking. Call for more information today!
Key facts
- Large corner lot
- Detached garage
- 0.42 acre lot
Tags
Property features AI
Finance
- Financial info: Annual tax amount reported as $1,000
Exterior
- Parking: Detached garage; 3 covered parking spaces (3 total parking spaces)
- Home design: Single-family residential property
- Exterior features: Lot of approximately 0.42 acres (about 18,295 sq ft)
Interior
- Bathrooms: 1 full bathroom
- Heating & cooling: No heating
- Interior features: No central heating (no heating system specified)
Neighborhood map
What this means for you Summary
Snapshot
- This is a 3-bed/1.0-bath other listed at $45k.
Deal economics
- At list price, monthly cash flow is $628 ($8k/yr) — positive.
- The deal already cash-flows at list — no discount required.
- Meets the 1% rule at list price ($1k rent vs $45k).
Location & tenants
- Location reads 58/100 on livability (#144 in NM) — a working-class tenant base; expect higher turnover. Strengths: cost of living A+, crime A-; Watch: health & safety C-, housing D, schools F.
- Grants-Cibola County Schools (town): math 14% / reading 22% proficiency, ranked #74 of 95 in NM (top 78%) — low school quality limits family demand, transient renter base, plan for 1-2y turnover; 70% free/reduced lunch — lower-income household profile, screen leases tightly.
- Market conditions: 17 active listings in the ZIP; 1 comparable units currently listed for rent nearby.
Forward outlook
- In year one you build about $2k of equity ($311 loan paydown + $1k appreciation (3.0% local appreciation)).
- Cibola County population projected at -14% by 2050 — secular population decline; favor cash flow + early exit over multi-decade hold.
- At projected returns (3.0% appreciation + 3.0% rent growth), your $13k cash investment doubles in ~2 years — after that, you're playing with house money.
Negotiation context
- Only 3 days on market — expect competitive offers; lowballing is unlikely to land.
Risks & watch-outs
- Climate carrying-cost: moderate wildfire risk — expect insurance premiums to compound above CPI over the hold.
Questions for the listing agent
- Built in 1964 — when were the roof, HVAC, electrical panel, plumbing, and water heater last replaced?
- Is there a deadline driving the sale (1031 exchange, divorce, estate, relocation)? That informs how much negotiation room exists.
- Schools are F-rated, which usually means shorter tenancies and higher turnover. Who's the typical renter profile here, and what's been the actual vacancy rate?
- What's the average days-on-market for RENTAL listings here right now (not sales)? A rising rental-DOM trend means longer vacancies and softer asking-rent achievability than the comps imply.
- What's the recent tenant-quality profile in this submarket — average credit score on applications, eviction rate, late-payment / NSF rate, and stable-employment percentage? A property-management company in the area should have these aggregated.
- How much new for-sale + rental construction is in the pipeline within 1–3 miles? Heavy new supply typically softens prices + rents 12–24 months out; constrained supply supports both.
Investment metrics
- 1% rule
- 2.56% ✓
- Cap rate
- 23.04%
- Cash-on-cash
- 59.81%
- DSCR
- 3.66
- GRM
- 3.3
CMA / ARV
No comps found within radius.
Projected returns pro-forma
3.0% appreciation · 3.0% rent growth · sell at horizon
- IRR
- 64.7%
- Equity multiple
- 4.60×
- Total profit
- $45,417
- Equity at exit
- $20,234
- IRR
- 64.2%
- Equity multiple
- 9.38×
- Total profit
- $105,630
- Equity at exit
- $31,183
Cash invested: $12,600 (down + closing). Projections, not guarantees.
Landlord ↔ Tenant lean methodology
- Overall (STATE)
- 55 Moderately Landlord-Leaning
- State New Mexico
- 55 Moderately Landlord-Leaning · D+3
- County
- — inherits STATE
- City
- — inherits STATE
ZIP-level market 87021
- Active inventory
- 17
- Price-to-rent
- 3.3×
Monthly cashflow live
- Estimated rent
- $1,150 medium interval (Pro) →
- Mortgage (P&I)
- −$236
- Tax from tax record
- −$26 /mo · $309/yr
- Insurance
- −$19
- HOA
- −$0
- Vacancy / Maint / Mgmt
- −$242
- Net cashflow
- $628
Break-even live
Sensitivity live
| Price | -10% $653 | -5% $641 | +0% $628 | +5% $615 | +10% $603 |
|---|---|---|---|---|---|
| Rent | -10% $537 | -5% $583 | +0% $628 | +5% $673 | +10% $719 |
| Rate | -1.0pp $651 | -0.5pp $639 | base $628 | +0.5pp $616 | +1.0pp $604 |
UW: 25.0% down · 7.5% · 30yr · 1.5% tax · 5.0% vac · 8.0% maint · 8.0% mgmt
Financing live
Cash to close
- Down payment
- $11,250
- Closing costs
- $1,350
- Reserves months
- —
- Total cash needed
- —
Loan-product check · same deal, 3 products live
Conventional
25% down · 7.5% · 30yr
- Down + closing
- —
- Monthly P&I
- —
- Monthly cashflow
- —
- DSCR
- —
- Eligible?
- —
Personal DTI + credit; lowest rate.
DSCR
20% down · 8.5% · 30yr
- Down + closing
- —
- Monthly P&I
- —
- Monthly cashflow
- —
- DSCR
- —
- Eligible?
- —
No personal income docs; deal must DSCR.
Hard money
10% down · 12.0% · 12mo
- Down + closing
- —
- Monthly P&I
- —
- Monthly cashflow
- —
- DSCR
- —
- Eligible?
- —
Short-term bridge; refi at stabilization.
Rent comps 1 comps
| Address | Beds | Baths | Sqft | Rent | $/sqft | DOM | Units | Dist |
|---|---|---|---|---|---|---|---|---|
| 1415 Willow Dr Milan, NM | 2.0 | 2.0 | 1100 | $1,150 | $1.05 | 44d | 1 | 1.00mi |
Listing history 4 events
-
2026-06-18days on market $45,000 Active 3 DOM
-
2026-06-17days on market $45,000 Active 2 DOM
-
2026-06-16remarks 221-char remark
-
2026-06-16$45,000 Active 1 DOM
ⓘ Source: listings_history table (triggers on properties + properties_extension) + one-shot
backfill from property_details.listing_events for pre-trigger history.
Tax reassessment forecast NM · Resets to sale price
- Current annual tax
- $309 · $26/mo
- Projected year-2 tax
- $360 · $30/mo
- Expected delta
- +$51/yr (+$4/mo · 16.4%)
ⓘ Screening estimate from a state-policy table — verify with the county assessor before closing.
Climate risk First Street
- Flood 3/10 Moderate FEMA zone X (shaded) · 18% chance over 30 yrs
- Wildfire 5/10 Major
- Heat 3/10 Moderate 7 d/yr ≥92°F today · 17 d/yr by 30 yrs out
- Wind 1/10 Low
- Air quality 1/10 Low 0 unhealthy d/yr today · 0 by 30 yrs out
Nearby sold comps map
Loading sold comps map…
Walkable amenities ~0.75 mi
Loading nearby amenities…
Taxation est. · year 1
- Rental income
- $13,800
- − Mortgage interest
- −$2,521
- − Property taxes
- −$309
- − Insurance
- −$225
- − Repairs & maintenance
- −$1,104
- − Management
- −$1,104
- − Depreciation
- −$1,309
- Taxable income
- $7,228
- Est. tax owed @ 24.0%
- −$1,735
- After-tax cash flow
- $5,801/yr
For passive investors: Depreciation is non-cash, so a rental often shows a tax loss while cash-flowing — sheltering income. Rental losses are passive: they offset passive income freely, and up to $25,000/yr can offset ordinary (W-2) income if you actively participate and your MAGI is under $100k (phasing out to $0 by $150k); unused losses carry forward. On sale, claimed depreciation is recaptured at up to 25%, and gains may owe capital-gains tax (a 1031 exchange can defer both). Figures are a year-1 estimate at your 24.0% rate — not tax advice; consult a CPA.
Schools (NCES district)
- District
- Grants-Cibola County Schools
- NCES district ID
- 3501170
- Math proficiency
- 14% —
- Reading proficiency
- 22% —
- Median HH income
- $35,996
- Composite
- 18.23/100
- National rank
- #14064
- State rank
- #74 of 95 in NM
Livability — Milan
- Score
- 58/100
- State rank
- #144
- US rank
- #21042
Category grades
Schools grade is shown separately in the Schools card above.
Census & demographics
- Census place
- Milan, NM
- Population (ZIP)
- 3,164
Population outlook (Cibola County) Hauer SSP2
- Today (2025)
- 26,324 people
- By 2030
- 25,594 · -2.8%
- By 2040
- 24,117 · -8.4%
- By 2050
- 22,568 · -14.3%
- By 2075
- 18,653 · -29.1%
- By 2100
- 12,719 · -51.7%
Race, ethnicity, and origin ACS 2023
- Neighborhood character
- Diverse neighborhood (Simpson 0.70)
- Race & ethnicity
- Hispanic / Latino 51% Two or more races 33% Native American 25% White 21% Asian 2%
- Hispanic origin (detail)
- Mexican 13%
- Common ancestry
- Italian 11% Scottish 2% Lithuanian 1%
- Foreign-born
- 2% · China
- Languages at home
- 68% English-only · Spanish 15% Chinese 1%
Political lean MEDSL · Cibola
- 2024 margin
- Toss-up / Even · D 49.6% · R 48.0% · Other 2.4%
- 2008→2024 swing
- -28.1pp toward R · 2008: 29.6pp · 2024: 1.6pp
- All cycles
- 2024: D+1.6 2020: D+8.7 2016: D+6.8 2012: D+23.8 2008: D+29.6
Not yet ingested
- Civics
- —
Market trends
- HPI YoY
- —
- Current HPI
- —
- Rent YoY
- —
- Metro
- —
- State GDP YoY
- —
- F500 in state
- 0
Price history
1 event — show timeline
- 2026-06-14 Listed $45,000 NMMLS
Property tax history
-1.4%/yrLatest (2025): $309 · -34.7% YoY. Source: county tax records.
Cash-flow waterfall
monthlySold comps — $/sqft
last 12 mo · ≤1 miLoading sold comps…