9 Clay St · Adams, NY
Flood risk 1/10 · Minimal
- FEMA flood zone
- X
- Chance of flooding over 30 yrs
- 0.0%
- Est. flood insurance / yr
- $473 – $860
Fire risk 1/10 · Minimal
- Est. fire insurance / yr
- $691 – $1,283
Heat risk 1/10 · Minimal
- Hot days now (above 89°F)
- 7 days/yr
- Hot days in 30 yrs
- 16 days/yr
Wind risk 1/10 · Minimal
- Chance of severe wind over 30 yrs
- 1.0%
Air-quality risk 3/10 · Minor
- Unhealthy air days now
- 2 days/yr
- Unhealthy air days in 30 yrs
- 3 days/yr
Risk factors via First Street. Map © Google.
Why this score? — see what drove the B- grade
The composite is a weighted blend of 9 inputs, each scored 0–100. Each bar is that input's sub-score; the figure is the points it added to the 100-point composite (weight × sub-score).
- Cash flow +19.9/30.0
- ARV discount +15.0/15.0
- Appreciation +10.0/10.0
- DSCR +6.3/10.0
- 1% rule +5.9/10.0
- Schools +4.1/10.0
- Livability +3.4/5.0
- Rent growth +2.5/5.0
- Condition / age +2.5/5.0
$164,900
🖨 Deal sheet 📄 Offer letter ✓ Due diligence
Listing remarks
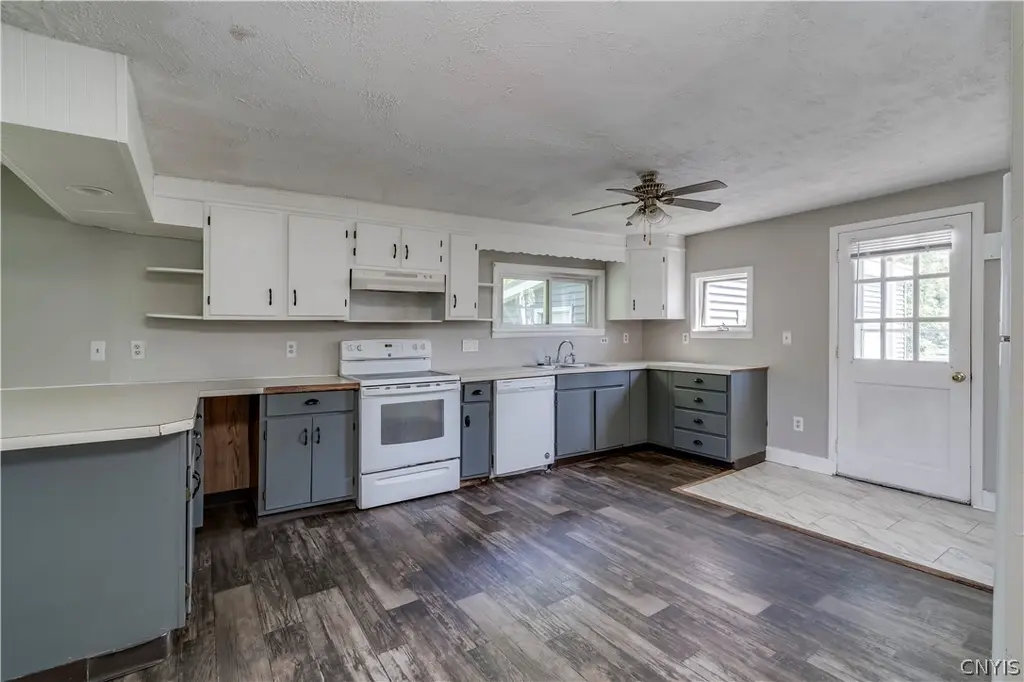
Great Village Home! This property was recently taken back in a forecloser and is priced to move. All the major appliances have been replaced in the last 5 years as has the roof. The home in vinyl siding so little to know maintenance on thge exterior. The property has giant rooms throughout the home and has a nice open floor plan. The attahed two car garage provides plenty of storage as well as a place to park your vehicles in the winter to keep them out of the weather. Conveninetly located near downtown Adams and only a mile from I-81 for quick access to Ft. Drum or Watertown. The onwer will give buyers $2500 cash at closing for repiars or moving expenses.
Key facts
- Open floor plan
- Vinyl siding
- Roof replaced
Tags
Property features AI
Exterior
- Parking: Attached garage with 2 parking spaces
- Utilities: Public water connected; Sewer connected
- Home design: Single-story home; Existing (resale) property; Vinyl siding
- Construction: Stone foundation; Vinyl siding
- Exterior features: Gravel driveway; Rectangular residential lot; City street frontage; Lot dimensions approximately 129 x 79
Interior
- Kitchen: Dishwasher; Electric oven; Electric range; Refrigerator; Electric water heater
- Bedrooms: One bedroom on the main level
- Flooring: Carpet; Hardwood; Vinyl; Varies
- Bathrooms: One full bathroom; One half bathroom
- Heating & cooling: Gas forced-air heating
- Interior features: Den; Separate/formal dining room; Eat-in kitchen; Bedroom on main level; Full basement
- Laundry & utility: Main level laundry
Neighborhood map
What this means for you Summary
Snapshot
- This is a 3-bed/1.5-bath single-family listed at $165k.
Deal economics
- At list price, monthly cash flow is $198 ($2k/yr) — positive.
- The deal already cash-flows at list — no discount required.
- Meets the 1% rule at list price ($2k rent vs $165k).
Location & tenants
- Location reads 67/100 on livability (#607 in NY) — a middle-class / working-renter tenant base. Strengths: housing A+, crime A, cost of living B+; Watch: employment C-, health & safety D, amenities F.
- South Jefferson Central School District (rural): math 35% / reading 60% proficiency, ranked #420 of 590 in NY (top 71%) — families likely to look elsewhere, expect single-tenant / working-renter base with shorter leases.
- Market conditions: 33 active listings in the ZIP; 1 comparable units currently listed for rent nearby; 196 units permitted in Jefferson County in 2024 (0 in 5+ unit buildings).
Forward outlook
- In year one you build about $18k of equity ($1k loan paydown + $16k appreciation (10.0% local appreciation)).
- Jefferson County population projected at -12% by 2050 — secular population decline; favor cash flow + early exit over multi-decade hold.
- At projected returns (10.0% appreciation + 3.0% rent growth), your $46k cash investment doubles in ~3 years — after that, you're playing with house money.
- By year 3, paydown + projected appreciation supports a ~$45k cash-out refi (75% LTV) — recoverable capital for the next deal without selling this one.
Negotiation context
- Only 14 days on market — expect competitive offers; lowballing is unlikely to land.
- 4 sale attempts since 13y ago; this cycle's ask has dropped $11k (6%) from the opening price — seller is motivated, your offer sets the floor, not the list.
- Current owner paid $141k; 17% above their basis — modest negotiation headroom, anchor on the comps not their cost.
Risks & watch-outs
- Watch-outs: built in 1890 — expect roof / HVAC / electrical / plumbing capex.
Questions for the listing agent
- Built in 1890 — when were the roof, HVAC, electrical panel, plumbing, and water heater last replaced?
- Is there a deadline driving the sale (1031 exchange, divorce, estate, relocation)? That informs how much negotiation room exists.
- Schools are B-rated — typically a magnet for longer-tenancy family renters. What's the average tenant stay here, and is there a school-zone premium baked into asking?
- What's the average days-on-market for RENTAL listings here right now (not sales)? A rising rental-DOM trend means longer vacancies and softer asking-rent achievability than the comps imply.
- What's the recent tenant-quality profile in this submarket — average credit score on applications, eviction rate, late-payment / NSF rate, and stable-employment percentage? A property-management company in the area should have these aggregated.
- How much new for-sale + rental construction is in the pipeline within 1–3 miles? Heavy new supply typically softens prices + rents 12–24 months out; constrained supply supports both.
Investment metrics
- 1% rule
- 1.09% ✓
- Cap rate
- 7.74%
- Cash-on-cash
- 5.16%
- DSCR
- 1.23
- GRM
- 7.6
CMA / ARV
- ARV (on-the-fly)
- $290,427
- Comps found
- 2
Show comp detail 2 sales within ~0.75 mi
| Address | Dist | Beds/Ba | Sqft | Sold | Price | $/sf | Match |
|---|---|---|---|---|---|---|---|
| 10347 N Park St | 0.57mi | 3/2.0 | 2,047 (-8%) | 20mo | $268,000 | $131 | 42 |
| 16635 County Route 84 | 0.61mi | 4/1.5 (+1) | 2,370 (+7%) | 20mo | $227,000 | $96 | 38 |
Match score weights: distance 35% · size 25% · config 20% · recency 20%. Top-matched comps best support the ARV.
Projected returns pro-forma
10.0% appreciation · 3.0% rent growth · sell at horizon
- IRR
- 28.0%
- Equity multiple
- 3.22×
- Total profit
- $102,521
- Equity at exit
- $148,555
- IRR
- 24.4%
- Equity multiple
- 7.33×
- Total profit
- $292,129
- Equity at exit
- $320,364
Cash invested: $46,172 (down + closing). Projections, not guarantees.
Landlord ↔ Tenant lean methodology
- Overall (STATE)
- 15 Strongly Tenant-Friendly
- State New York
- 15 Strongly Tenant-Friendly · D+10
- County
- — inherits STATE
- City
- — inherits STATE
ZIP-level market 13605
- Home prices YoY
- 12.7%
- Active inventory
- 33
- Price-to-rent
- 7.6×
Monthly cashflow live
- Estimated rent
- $1,800 medium interval (Pro) →
- Mortgage (P&I)
- −$865
- Tax from tax record
- −$290 /mo · $3,482/yr
- Insurance
- −$69
- HOA
- −$0
- Vacancy / Maint / Mgmt
- −$378
- Net cashflow
- $198
Break-even live
UW: 25.0% down · 7.5% · 30yr · 1.5% tax · 5.0% vac · 8.0% maint · 8.0% mgmt
Financing live
Cash to close
- Down payment
- $41,225
- Closing costs
- $4,947
- Reserves months
- —
- Total cash needed
- —
Loan-product check · same deal, 3 products live
Conventional
25% down · 7.5% · 30yr
- Down + closing
- —
- Monthly P&I
- —
- Monthly cashflow
- —
- DSCR
- —
- Eligible?
- —
Personal DTI + credit; lowest rate.
DSCR
20% down · 8.5% · 30yr
- Down + closing
- —
- Monthly P&I
- —
- Monthly cashflow
- —
- DSCR
- —
- Eligible?
- —
No personal income docs; deal must DSCR.
Hard money
10% down · 12.0% · 12mo
- Down + closing
- —
- Monthly P&I
- —
- Monthly cashflow
- —
- DSCR
- —
- Eligible?
- —
Short-term bridge; refi at stabilization.
Rent comps 1 comps
| Address | Beds | Baths | Sqft | Rent | $/sqft | DOM | Units | Dist |
|---|---|---|---|---|---|---|---|---|
| 9193 US Route 11 Adams, NY | 3.0 | 1.0 | 1472 | $1,800 | $1.22 | 43d | 1 | 0.68mi |
Listing history 11 events
-
2026-06-19days on market $164,900 Active 14 DOM
-
2026-06-18days on market $164,900 Active 13 DOM
-
2026-06-17days on market $164,900 Active 12 DOM
-
2026-06-16days on market $164,900 Active 11 DOM
-
2026-06-15days on market $164,900 Active 10 DOM
-
2026-06-14days on market $164,900 Active 8 DOM
-
2026-06-12pricedays on market $164,900 Active 7 DOM
-
2026-06-09days on market $175,900 Active 4 DOM
-
2026-06-08days on market $175,900 Active 3 DOM
-
2026-06-07remarks 664-char remark
-
2026-06-07$175,900 Active 2 DOM
ⓘ Source: listings_history table (triggers on properties + properties_extension) + one-shot
backfill from property_details.listing_events for pre-trigger history.
Tax reassessment forecast NY · Partial reset (capped growth)
- Current annual tax
- $3,482 · $290/mo
- Projected year-2 tax
- $3,482 · $290/mo
- Expected delta
- $0/yr ($0/mo · 0.0%)
ⓘ Screening estimate from a state-policy table — verify with the county assessor before closing.
Climate risk First Street
- Flood 1/10 Low FEMA zone X · 0% chance over 30 yrs
- Wildfire 1/10 Low
- Heat 1/10 Low 7 d/yr ≥89°F today · 16 d/yr by 30 yrs out
- Wind 1/10 Low 100% chance of damaging wind over 30 yrs
- Air quality 3/10 Moderate 2 unhealthy d/yr today · 3 by 30 yrs out
Nearby sold comps map
Loading sold comps map…
Walkable amenities ~0.75 mi
Loading nearby amenities…
Taxation est. · year 1
- Rental income
- $21,600
- − Mortgage interest
- −$9,237
- − Property taxes
- −$3,482
- − Insurance
- −$824
- − Repairs & maintenance
- −$1,728
- − Management
- −$1,728
- − Depreciation
- −$4,797
- Taxable loss
- −$197
- Est. tax savings @ 24.0%
- +$47
- After-tax cash flow
- $2,427/yr
For passive investors: Depreciation is non-cash, so a rental often shows a tax loss while cash-flowing — sheltering income. Rental losses are passive: they offset passive income freely, and up to $25,000/yr can offset ordinary (W-2) income if you actively participate and your MAGI is under $100k (phasing out to $0 by $150k); unused losses carry forward. On sale, claimed depreciation is recaptured at up to 25%, and gains may owe capital-gains tax (a 1031 exchange can defer both). Figures are a year-1 estimate at your 24.0% rate — not tax advice; consult a CPA.
Schools (NCES district)
- District
- South Jefferson Central School District
- NCES district ID
- 3602340
- Math proficiency
- 35% ▼ -18.00%
- Reading proficiency
- 60% ▲ 10.00%
- Median HH income
- $56,872
- Composite
- 41.27/100
- National rank
- #3522
- State rank
- #420 of 590 in NY
Livability — Adams
- Score
- 67/100
- State rank
- #607
- US rank
- #10970
Category grades
Schools grade is shown separately in the Schools card above.
Census & demographics
- Census place
- Adams, NY
- Population (ZIP)
- 5,106
Population outlook (Jefferson County) Hauer SSP2
- Today (2025)
- 111,748 people
- By 2030
- 109,370 · -2.1%
- By 2040
- 103,828 · -7.1%
- By 2050
- 98,523 · -11.8%
- By 2075
- 91,422 · -18.2%
- By 2100
- 78,214 · -30.0%
Race, ethnicity, and origin ACS 2023
- Neighborhood character
- Predominantly White (90%)
- Race & ethnicity
- White 90% Two or more races 5% Black 3% Hispanic / Latino 2%
- Common ancestry
- Lithuanian 5% Slovak 5% Romanian 4%
- Foreign-born
- 2% · Canada
- Languages at home
- 98% English-only · German/W. Germanic 1%
Political lean MEDSL · Jefferson
- 2024 margin
- Strong R (+23.6) · D 38.2% · R 61.8%
- 2008→2024 swing
- -18.3pp toward R · 2008: -5.3pp · 2024: -23.6pp
- All cycles
- 2024: R+23.6 2020: R+19.0 2016: R+22.4 2012: R+2.9 2008: R+5.3
Not yet ingested
- Civics
- —
Market trends
- HPI YoY
- ▲ 39.95%
- Current HPI
- 354.8216
- Rent YoY
- —
- Metro
- —
- State GDP YoY
- ▲ 2.60%
- F500 in state
- 92
Industry mix (Fortune 500 HQ in NY)
| Industry | F500 HQs | Revenue |
|---|---|---|
| Financial Services | 10 | $950B |
|
||
| Consumer Goods | 9 | $162B |
|
||
| Insurance | 4 | $225B |
|
||
| Telecommunications | 2 | $144B |
|
||
| Pharmaceuticals | 2 | $112B |
|
||
| Media / Entertainment | 2 | $69B |
|
||
Price history
+290.9% since first listed10 events — show timeline
- 2026-06-05 Listed $175,900 CNYIS
- 2022-04-18 Sold (Public Records) $140,600 Public Records
- 2019-12-09 Listing Removed — CNYIS
- 2019-04-20 Listed $119,900 CNYIS
- 2018-05-03 Listing Removed — CNYIS
- 2018-04-10 Listed $136,900 CNYIS
- 2016-11-01 Sold (Public Records) $75,000 Public Records
- 2014-01-06 Listing Removed — CNYIS
- 2013-09-02 Listed $130,000 CNYIS
- 2004-12-21 Sold (Public Records) $45,000 Public Records
Property tax history
+3.2%/yrLatest (2025): $3,482 · +1.9% YoY. Source: county tax records.
Cash-flow waterfall
monthlySold comps — $/sqft
last 12 mo · ≤1 miLoading sold comps…