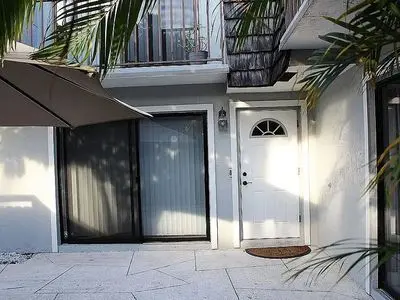
760 NW 10th Ter · North River Shores, FL
Flood risk 7/10 · Major
- FEMA flood zone
- X (shaded)
- Chance of flooding over 30 yrs
- 0.74%
- Est. flood insurance / yr
- $507 – $1,088
Fire risk 1/10 · Minimal
- Est. fire insurance / yr
- $947 – $1,759
Heat risk 10/10 · Severe
- Hot days now (above 106°F)
- 7 days/yr
- Hot days in 30 yrs
- 24 days/yr
Wind risk 10/10 · Severe
- Chance of severe wind over 30 yrs
- 99.0%
Air-quality risk 2/10 · Minimal
- Unhealthy air days now
- 1 days/yr
- Unhealthy air days in 30 yrs
- 1 days/yr
Risk factors via First Street. Map © Google.
Why this score? — see what drove the C+ grade
The composite is a weighted blend of 9 inputs, each scored 0–100. Each bar is that input's sub-score; the figure is the points it added to the 100-point composite (weight × sub-score).
- Cash flow +25.7/30.0
- 1% rule +9.1/10.0
- DSCR +8.6/10.0
- ARV discount +7.5/15.0
- Schools +4.5/10.0
- Livability +3.7/5.0
- Condition / age +2.5/5.0
- Rent growth +2.3/5.0
- Appreciation +0.0/10.0
$225,000
🖨 Deal sheet (PDF) 📄 Offer letter ✓ Due diligence
Listing remarks MLS
Charming townhome located in North River Shores. This 2 bedroom, 2 bath townhome is located close to beaches, shopping and downtown area. Private courtyard and community pool. New A/C 2017 and new water heater. Available for immediate occupancy.
Key facts
- Pool and cabana
- Bedroom balcony
- Built 1980
Tags
Neighborhood map
What this means for you Summary
Snapshot
- This is a 2-bed/2.5-bath condo listed at $225k.
Deal economics
- At list price, monthly cash flow is $472 ($6k/yr) — positive.
- The deal already cash-flows at list — no discount required.
- Meets the 1% rule at list price ($3k rent vs $225k).
- Recommended offer: $218k (3.0% below list) — sets the bar for market timing.
- Cap rate 9.2% vs local median 5.7% in North River Shores — top-decile yield for the area; either an underpriced asset or a hidden risk that comps aren't pricing in. Stress-test before assuming the spread holds.
Location & tenants
- Location reads 74/100 on livability (#292 in FL, #4,906 nationally) — a middle-class / working-renter tenant base. Strengths: crime A+, housing A+, employment B+; Watch: schools D+, amenities F, commute F.
- Martin (suburban): math 52% / reading 53% proficiency, ranked #24 of 73 in FL (top 33%) — acceptable for families but not a draw, mixed tenant base, ~2y average lease.
- Market conditions: Rents soft (-0.7%/yr); 256 active listings in the ZIP; 29 comparable units currently listed for rent nearby; rentals at typical pace (median 24d on market — plan ~3-4 weeks tenant-placement turnaround); 737 units permitted in Martin County in 2024 (167 in 5+ unit buildings).
- At $3,163/mo this rent would consume 61% of the median local household income ($63k/yr) (locally 1408% of renters already pay >50% of income on rent) — very limited rent-growth headroom before tenants either downsize or default.
Forward outlook
- Local home prices are declining (-3.0%/yr); year-one equity from $2k of loan paydown is wiped out by about $7k of value loss. Plan a longer hold.
- Martin County population projected at +19% by 2050 — long-run rental-demand tailwind backs the buy-and-hold thesis.
Negotiation context
- It's been on market 35 days — a 3% lower offer ($218k) is reasonable based on typical stale-listing flexibility.
- 4 sale attempts since 14y ago with the ask held roughly flat each time — persistent listings suggest the price (not the market) is what's stuck; bring a comps-based counter.
- Current owner paid $112k; list at $225k implies a 101% gain — meaningful room to come down on a strong offer.
Risks & watch-outs
- Watch-outs: flood insurance adds $66/mo.
- Climate carrying-cost: major flood risk; severe wind risk, 99% chance of damaging wind over 30y; extreme-heat days projected 7→24/yr by 2055 (HVAC capex compounding) — expect insurance premiums to compound above CPI over the hold.
Questions for the listing agent
- It's been on market 35 days. Have you received any prior offers? Is the seller open to a 3% concession, seller financing, or rate buy-down credit?
- What's the actual annual flood-insurance premium (NFIP or private), and is the property in a SFHA with mandatory coverage?
- What does the HOA fee cover, when was the last increase, and are there any pending special assessments or reserve-fund shortfalls?
- Any open or pending special assessments — roof, HVAC, plumbing, elevator, façade? What's the per-unit balance and payoff schedule, and is the seller paying it off at close or rolling it to the buyer?
- Is there a deadline driving the sale (1031 exchange, divorce, estate, relocation)? That informs how much negotiation room exists.
- Schools are D-rated, which usually means shorter tenancies and higher turnover. Who's the typical renter profile here, and what's been the actual vacancy rate?
- What's the average days-on-market for RENTAL listings here right now (not sales)? A rising rental-DOM trend means longer vacancies and softer asking-rent achievability than the comps imply.
- What's the recent tenant-quality profile in this submarket — average credit score on applications, eviction rate, late-payment / NSF rate, and stable-employment percentage? A property-management company in the area should have these aggregated.
- How much new apartment / multifamily construction is in the pipeline within 1–3 miles? Heavy new supply (>2% of stock underway) typically softens rents 12–24 months out; light construction supports rent growth.
Investment metrics
- 1% rule
- 1.41% ✓
- Cap rate
- 9.16%
- Cash-on-cash
- 10.25%
- DSCR
- 1.46
- GRM
- 5.9
CMA / ARV
No comps found within radius.
Projected returns pro-forma
-3.0% appreciation · 0.0% rent growth · sell at horizon
- IRR
- -6.8%
- Equity multiple
- 0.76×
- Total profit
- $-15,350
- Equity at exit
- $33,548
- IRR
- -2.6%
- Equity multiple
- 0.86×
- Total profit
- $-9,135
- Equity at exit
- $19,454
Cash invested: $63,000 (down + closing). Projections, not guarantees.
Landlord ↔ Tenant lean methodology
- Overall (STATE)
- 87 Strongly Landlord-Friendly
- State Florida
- 87 Strongly Landlord-Friendly · R+3
- County
- — inherits STATE
- City
- — inherits STATE
ZIP-level market 34994
- Home prices YoY
- -27.1%
- Rents YoY
- -0.7%
- Active inventory
- 256
- Price-to-rent
- 5.9×
Monthly cashflow live
- Estimated rent
- $3,163 high interval (Pro) →
- Mortgage (P&I)
- −$1,180
- Tax from tax record
- −$237 /mo · $2,845/yr
- Insurance
- −$94
- Flood insurance flood zone
- −$66 /mo · $798/yr
- HOA est. from 2 same-building comps
- −$450
- Vacancy / Maint / Mgmt
- −$664
- Net cashflow
- $472
Break-even live
Sensitivity live
| Price | -10% $599 | -5% $535 | +0% $472 | +5% $408 | +10% $344 |
|---|---|---|---|---|---|
| Rent | -10% $222 | -5% $347 | +0% $472 | +5% $597 | +10% $722 |
| Rate | -1.0pp $585 | -0.5pp $529 | base $472 | +0.5pp $413 | +1.0pp $354 |
UW: 25.0% down · 7.5% · 30yr · 1.5% tax · 5.0% vac · 8.0% maint · 8.0% mgmt
Financing live
Cash to close
- Down payment
- $56,250
- Closing costs
- $6,750
- Reserves months
- —
- Total cash needed
- —
Loan-product check · same deal, 3 products live
Conventional
25% down · 7.5% · 30yr
- Down + closing
- —
- Monthly P&I
- —
- Monthly cashflow
- —
- DSCR
- —
- Eligible?
- —
Personal DTI + credit; lowest rate.
DSCR
20% down · 8.5% · 30yr
- Down + closing
- —
- Monthly P&I
- —
- Monthly cashflow
- —
- DSCR
- —
- Eligible?
- —
No personal income docs; deal must DSCR.
Hard money
10% down · 12.0% · 12mo
- Down + closing
- —
- Monthly P&I
- —
- Monthly cashflow
- —
- DSCR
- —
- Eligible?
- —
Short-term bridge; refi at stabilization.
Rent comps 29 comps
| Address | Beds | Baths | Sqft | Rent | $/sqft | DOM | Units | Dist |
|---|---|---|---|---|---|---|---|---|
| 964 NW Spruce Ridge Dr Unit D1 Stuart, FL | 2.0 | 2.0 | 1056 | $2,200 | $2.08 | 24d | 1 | 0.19mi |
| 875 NW Flagler Ave #302 Stuart, FL | 2.0 | 2.0 | 1082 | $2,900 | $2.68 | 14d | 1 | 0.36mi |
| 875 NW Flagler Ave #404 Stuart, FL | 2.0 | 2.0 | 1183 | $5,250 | $4.44 | 24d | 1 | 0.36mi |
| 975 NW Flagler Ave Stuart, FL | 2.0 | 2.0 | 1226 | $2,800 | $2.28 | 24d | 1 | 0.36mi |
| 975 NW Flagler Ave #407 Stuart, FL | 2.0 | 2.0 | 1226 | $4,500 | $3.67 | 24d | 1 | 0.36mi |
| 975 NW Flagler Ave #306 Stuart, FL | 2.0 | 2.0 | 1182 | $2,500 | $2.12 | 24d | 1 | 0.36mi |
| 975 NW Flagler Ave #403 Stuart, FL | 2.0 | 2.0 | 1082 | $3,000 | $2.77 | 24d | 1 | 0.36mi |
| 975 NW Flagler Ave #307 Stuart, FL | 2.0 | 2.0 | 1226 | $2,750 | $2.24 | 24d | 1 | 0.36mi |
| 415 NW Flagler Ave #403 Stuart, FL | 2.0 | 2.0 | 1082 | $3,000 | $2.77 | 24d | 1 | 0.50mi |
| 275 NW Flagler Ave #204 Stuart, FL | 3.0 | 2.0 | 1391 | $6,500 | $4.67 | 24d | 1 | 0.59mi |
| 275 NW Flagler Ave #205 Stuart, FL | 2.0 | 2.0 | 1183 | $2,800 | $2.37 | 24d | 1 | 0.59mi |
| 215 NW Flagler Ave #202 Stuart, FL | 2.0 | 2.0 | 1182 | $2,500 | $2.12 | 24d | 1 | 0.62mi |
| 1398 NW Cavendish Ct Stuart, FL | 2.0–3.0 | 2.5 | 1242 | $2,393 | $1.93 | 22d | 11 | 0.63mi |
| 1655 NW Fork Rd Stuart, FL | 2.0 | 2.0 | 1390 | $3,600 | $2.59 | 24d | 1 | 0.71mi |
| 1900 NW Federal Hwy Stuart, FL | 1.0–2.0 | 1.0–2.0 | 1013 | $3,973 | $3.92 | 14d | 21 | 0.77mi |
| 257 Preserve Trl N Stuart, FL | 3.0 | 2.5 | 1652 | $2,700 | $1.63 | 24d | 1 | 0.96mi |
| 2201 NW Federal Hwy Stuart, FL | 1.0–3.0 | 1.0–2.0 | 1080 | $2,530 | $2.34 | 14d | 18 | 1.10mi |
| 1001 NE Baker Rd Stuart, FL | 1.0–3.0 | 1.0–2.0 | 952 | $2,280 | $2.40 | 14d | 27 | 1.14mi |
| 1479 SW Seahawk Way Palm City, FL | 3.0 | 3.0 | 1876 | $6,800 | $3.62 | 24d | 1 | 1.17mi |
| 1360 SW Albatross Way Palm City, FL | 3.0 | 2.5 | 1979 | $10,500 | $5.31 | 24d | 1 | 1.20mi |
| 590 NE Lima Vias Jensen Beach, FL | 2.0 | 2.0 | 1295 | $3,300 | $2.55 | 24d | 1 | 1.24mi |
| 1967 NW Palmetto Ter Stuart, FL | 3.0 | 2.0 | 2179 | $8,500 | $3.90 | 24d | 1 | 1.26mi |
| 201 SW Joan Jefferson Way Stuart, FL | 2.0–3.0 | 2.0 | 1400 | $2,545 | $1.82 | 14d | 10 | 1.30mi |
| 41 SW Seminole St Stuart, FL | 3.0 | 1.0–2.5 | 1353 | $13,167 | $9.73 | 24d | 3 | 1.30mi |
| 47 SW Osceola St #206 Stuart, FL | 2.0 | 2.0 | 1276 | $4,000 | $3.13 | 24d | 1 | 1.32mi |
| 47 SW Osceola St Unit UN206 Stuart, FL | 2.0 | 2.0 | 1276 | $3,900 | $3.06 | 24d | 1 | 1.32mi |
| 1010 NW Fresco Way Jensen Beach, FL | 1.0–3.0 | 1.0–2.0 | 1011 | $2,122 | $2.10 | 14d | 10 | 1.38mi |
| 404 SW Camden Ave Stuart, FL | 2.0 | 1.0 | 1940 | $2,850 | $1.47 | 14d | 1 | 1.47mi |
| 310 SE Denver Ave Unit 2 Stuart, FL | 2.0 | 2.0 | 1300 | $2,900 | $2.23 | 14d | 1 | 1.50mi |
HOA detail condo
- Monthly dues
- $0 · $0/yr
- Likely covers
- waterpool
- Assessments
- None detected in remarks — confirm with the listing agent.
Listing history 25 events
-
2026-06-18days on market $225,000 Active 35 DOM
-
2026-06-17days on market $225,000 Active 34 DOM
-
2026-06-16days on market $225,000 Active 33 DOM
-
2026-06-15days on market $225,000 Active 32 DOM
-
2026-06-14days on market $225,000 Active 30 DOM
-
2026-06-13days on market $225,000 Active 29 DOM
-
2026-06-10days on market $225,000 Active 27 DOM
-
2026-06-09days on market $225,000 Active 26 DOM
-
2026-06-08days on market $225,000 Active 25 DOM
-
2026-06-07days on market $225,000 Active 24 DOM
-
2026-06-03days on market $225,000 Active 20 DOM
-
2026-06-02days on market $225,000 Active 19 DOM
-
2026-06-01days on market $225,000 Active 18 DOM
-
2026-05-31days on market $225,000 Active 17 DOM
-
2026-05-31days on market $225,000 Active 16 DOM
-
2026-05-14$225,000 Active 497-char remark
-
2017-07-22soldstatus $112,000
-
2017-07-21soldstatus $112,000 Sold 245-char remark
Show marketing remark (245 chars)
Charming townhome located in North River Shores. This 2 bedroom, 2 bath townhome is located close to beaches, shopping and downtown area. Private courtyard and community pool. New A/C 2017 and new water heater. Available for immediate occupancy.
-
2017-06-08status Pending 245-char remark
Show marketing remark (245 chars)
Charming townhome located in North River Shores. This 2 bedroom, 2 bath townhome is located close to beaches, shopping and downtown area. Private courtyard and community pool. New A/C 2017 and new water heater. Available for immediate occupancy.
-
2017-05-30status Active 245-char remark
Show marketing remark (245 chars)
Charming townhome located in North River Shores. This 2 bedroom, 2 bath townhome is located close to beaches, shopping and downtown area. Private courtyard and community pool. New A/C 2017 and new water heater. Available for immediate occupancy.
-
2017-05-29status Pending 245-char remark
Show marketing remark (245 chars)
Charming townhome located in North River Shores. This 2 bedroom, 2 bath townhome is located close to beaches, shopping and downtown area. Private courtyard and community pool. New A/C 2017 and new water heater. Available for immediate occupancy.
-
2017-05-26$119,000 Active 245-char remark
Show marketing remark (245 chars)
Charming townhome located in North River Shores. This 2 bedroom, 2 bath townhome is located close to beaches, shopping and downtown area. Private courtyard and community pool. New A/C 2017 and new water heater. Available for immediate occupancy.
-
2013-07-01historical
-
2012-06-23$98,900
-
2000-07-27soldstatus $59,900
ⓘ Source: listings_history table (triggers on properties + properties_extension) + one-shot
backfill from property_details.listing_events for pre-trigger history.
Tax reassessment forecast FL · Resets to sale price
- Current annual tax
- $2,845 · $237/mo
- Projected year-2 tax
- $2,845 · $237/mo
- Expected delta
- $0/yr ($0/mo · 0.0%)
ⓘ Screening estimate from a state-policy table — verify with the county assessor before closing.
Climate risk First Street
- Flood 7/10 Severe FEMA zone X (shaded) · 74% chance over 30 yrs
- Wildfire 1/10 Low
- Heat 10/10 Extreme 7 d/yr ≥106°F today · 24 d/yr by 30 yrs out
- Wind 10/10 Extreme 99% chance of damaging wind over 30 yrs
- Air quality 2/10 Low 1 unhealthy d/yr today · 1 by 30 yrs out
Nearby sold comps map
Loading sold comps map…
Walkable amenities ~0.75 mi
Loading nearby amenities…
Taxation est. · year 1
- Rental income
- $37,957
- − Mortgage interest
- −$12,603
- − Property taxes
- −$2,845
- − Insurance
- −$1,922
- − Repairs & maintenance
- −$3,037
- − Management
- −$3,037
- − HOA
- −$5,400
- − Depreciation
- −$6,545
- Taxable income
- $2,568
- Est. tax owed @ 24.0%
- −$616
- After-tax cash flow
- $5,044/yr
For passive investors: Depreciation is non-cash, so a rental often shows a tax loss while cash-flowing — sheltering income. Rental losses are passive: they offset passive income freely, and up to $25,000/yr can offset ordinary (W-2) income if you actively participate and your MAGI is under $100k (phasing out to $0 by $150k); unused losses carry forward. On sale, claimed depreciation is recaptured at up to 25%, and gains may owe capital-gains tax (a 1031 exchange can defer both). Figures are a year-1 estimate at your 24.0% rate — not tax advice; consult a CPA.
Schools (NCES district)
- District
- Martin
- NCES district ID
- 1201290
- Math proficiency
- 52% ▼ -14.00%
- Reading proficiency
- 53% ▼ -4.00%
- Median HH income
- $52,482
- Composite
- 45.1/100
- National rank
- #2690
- State rank
- #24 of 73 in FL
Livability — North River Shores
- Score
- 74/100
- State rank
- #292
- US rank
- #4906
Category grades
Schools grade is shown separately in the Schools card above.
Census & demographics
- Census place
- North River Shores, FL
- County
- Martin County · 165,223 people
- Metro
- Port St. Lucie, FL
- Population (ZIP)
- 18,737
- Household income
- $62,533
- Rent vs Own
- Severe rent burden
- 1408.0
Population outlook (Martin County) Hauer SSP2
- Today (2025)
- 172,383 people
- By 2030
- 180,192 · +4.5%
- By 2040
- 194,114 · +12.6%
- By 2050
- 204,992 · +18.9%
- By 2075
- 229,641 · +33.2%
- By 2100
- 232,146 · +34.7%
Race, ethnicity, and origin ACS 2023
- Neighborhood character
- Majority White (65%)
- Race & ethnicity
- White 65% Hispanic / Latino 21% Two or more races 12% Black 11%
- Hispanic origin (detail)
- Mexican 6% Puerto Rican 5% Cuban 1%
- Common ancestry
- Romanian 5% Lithuanian 3% Slovak 2%
- Foreign-born
- 12% · Canada
- Languages at home
- 80% English-only · Spanish 16% Russian/Polish/Slavic 2% Other Indo-European 1%
Political lean MEDSL · Martin
- 2024 margin
- Solid R (+31.1) · D 34.1% · R 65.2%
- 2008→2024 swing
- -17.5pp toward R · 2008: -13.6pp · 2024: -31.1pp
- All cycles
- 2024: R+31.1 2020: R+24.6 2016: R+26.9 2012: R+22.9 2008: R+13.6
Not yet ingested
- Civics
- —
Market trends
- HPI YoY
- ▼ -130.08%
- Current HPI
- 349.7061
- Rent YoY
- ▼ -0.69%
- Metro
- Port St. Lucie, FL
- State GDP YoY
- ▲ 3.28%
- F500 in state
- 36
Industry mix (Fortune 500 HQ in FL)
| Industry | F500 HQs | Revenue |
|---|---|---|
| Industrial Technology | 2 | $29B |
|
||
| Insurance | 2 | $17B |
|
||
| Retail | 1 | $60B |
|
||
| Technology Distribution | 1 | $58B |
|
||
| Homebuilding | 1 | $35B |
|
||
| Technology Manufacturing | 1 | $35B |
|
||
Price history
+275.6% since first listed10 events — show timeline
- 2026-05-14 Listed $225,000 FSBO.com
- 2017-07-22 Sold (Public Records) $112,000 Public Records
- 2017-07-21 Sold (MLS) $112,000 MCRTC
- 2017-06-08 Pending — MCRTC
- 2017-05-30 Relisted — MCRTC
- 2017-05-29 Pending — MCRTC
- 2017-05-26 Listed $119,000 MCRTC
- 2013-07-01 Listing Removed — MCRTC
- 2012-06-23 Listed $98,900 MCRTC
- 2000-07-27 Sold (Public Records) $59,900 Public Records
Property tax history
+9.2%/yrLatest (2025): $2,845 · +1.4% YoY. Source: county tax records.
Cash-flow waterfall
monthlySold comps — $/sqft
last 12 mo · ≤1 miLoading sold comps…