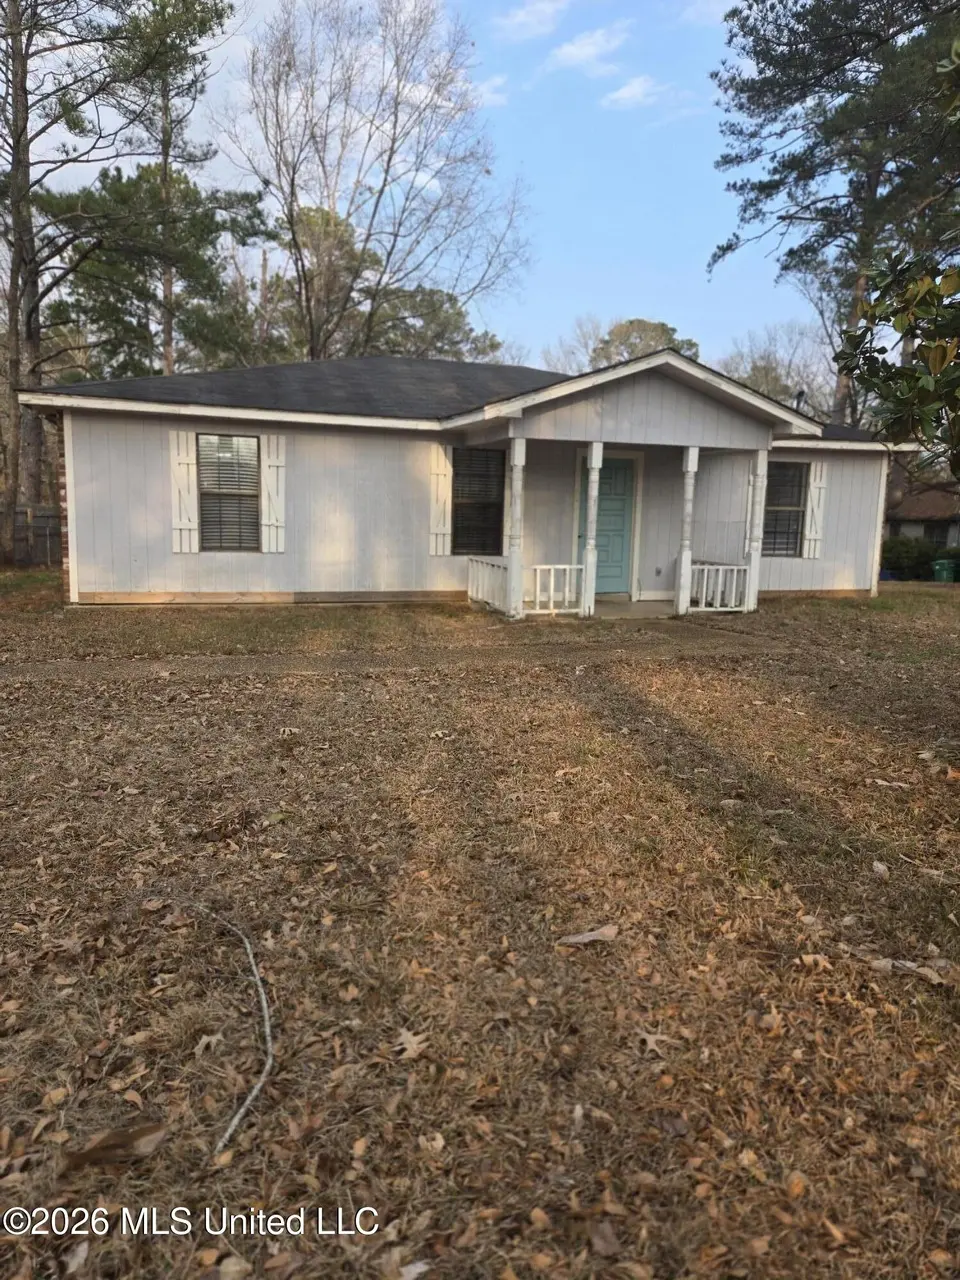
1056 Lake Dockery Rd · Byram, MS
Flood risk 1/10 · Minimal
- FEMA flood zone
- X (unshaded)
- Chance of flooding over 30 yrs
- 0.0%
- Est. flood insurance / yr
- $507 – $1,088
Fire risk 4/10 · Minor
- Est. fire insurance / yr
- $1,241 – $2,305
Heat risk 7/10 · Major
- Hot days now (above 108°F)
- 7 days/yr
- Hot days in 30 yrs
- 20 days/yr
Wind risk 8/10 · Major
- Chance of severe wind over 30 yrs
- 80.0%
Air-quality risk 1/10 · Minimal
- Unhealthy air days now
- 0 days/yr
- Unhealthy air days in 30 yrs
- 0 days/yr
Risk factors via First Street. Map © Google.
Why this score? — see what drove the C- grade
The composite is a weighted blend of 9 inputs, each scored 0–100. Each bar is that input's sub-score; the figure is the points it added to the 100-point composite (weight × sub-score).
- Cash flow +18.4/30.0
- ARV discount +15.0/15.0
- DSCR +5.8/10.0
- 1% rule +4.5/10.0
- Livability +3.5/5.0
- Rent growth +2.5/5.0
- Condition / age +2.5/5.0
- Schools +2.4/10.0
- Appreciation +0.0/10.0
$149,900
🖨 Deal sheet 📄 Offer letter ✓ Due diligence
Listing remarks MLS
Unbelievable price for this great starter home! 3-bedroom, 2 bath split plan with large den, eat in kitchen and back porch. There are two parking spaces in back and two in front, partially fenced yard and a small fully fenced area for puppy play! All of this conveniently located in Byram, MS. The commute is minutes to anything in the metro area... work, entertainment, medical care, etc. You have access to beautiful, 44-acre Lake Dockery! Don't miss the opportunity to own this special property!
Key facts
- Lake dockery
- Large den
- Fully fenced area
Tags
Neighborhood map
What this means for you Summary
Snapshot
- This is a 2-bed/2.0-bath single-family listed at $150k.
Deal economics
- At list price, monthly cash flow is $139 ($2k/yr) — positive.
- The deal already cash-flows at list — no discount required.
- To meet the 1% rule (rent ≥ 1% of price), the offer needs to be $142k (5.2% below list).
- Recommended offer: $141k (6.0% below list) — sets the bar for market timing.
- Cap rate 7.4% vs local median 4.1% in Byram — top-decile yield for the area; either an underpriced asset or a hidden risk that comps aren't pricing in. Stress-test before assuming the spread holds.
Location & tenants
- Location reads 69/100 on livability (#45 in MS) — a middle-class / working-renter tenant base. Strengths: crime A+, cost of living A+, housing A+; Watch: schools C-, amenities F, commute F.
- Hinds County School District (rural): math 25% / reading 29% proficiency, ranked #70 of 130 in MS (top 54%) — low school quality limits family demand, transient renter base, plan for 1-2y turnover; 64% free/reduced lunch — lower-income household profile, screen leases tightly.
- Market conditions: 105 active listings in the ZIP; 11 comparable units currently listed for rent nearby; rentals at typical pace (median 21d on market — plan ~3-4 weeks tenant-placement turnaround); 167 units permitted in Hinds County in 2024 (0 in 5+ unit buildings).
Forward outlook
- Local home prices are declining (-3.0%/yr); year-one equity from $1k of loan paydown is wiped out by about $4k of value loss. Plan a longer hold.
- Hinds County population projected to shrink 6% by 2050 — rents likely to lag national; underwrite the cash flow, not the appreciation.
Negotiation context
- It's been on market 62 days — a 6% lower offer ($141k) is reasonable based on typical stale-listing flexibility.
- 3 sale attempts since 13y ago with the ask held roughly flat each time — persistent listings suggest the price (not the market) is what's stuck; bring a comps-based counter.
Risks & watch-outs
- Climate carrying-cost: severe wind risk, 80% chance of damaging wind over 30y; extreme-heat days projected 7→20/yr by 2055 (HVAC capex compounding) — expect insurance premiums to compound above CPI over the hold.
Questions for the listing agent
- It's been on market 62 days. Have you received any prior offers? Is the seller open to a 6% concession, seller financing, or rate buy-down credit?
- Why hasn't it sold? Are there any deal-killer items the seller is aware of (foundation, flood, title, zoning, code violations)?
- Is there a deadline driving the sale (1031 exchange, divorce, estate, relocation)? That informs how much negotiation room exists.
- What's the average days-on-market for RENTAL listings here right now (not sales)? A rising rental-DOM trend means longer vacancies and softer asking-rent achievability than the comps imply.
- What's the recent tenant-quality profile in this submarket — average credit score on applications, eviction rate, late-payment / NSF rate, and stable-employment percentage? A property-management company in the area should have these aggregated.
- How much new for-sale + rental construction is in the pipeline within 1–3 miles? Heavy new supply typically softens prices + rents 12–24 months out; constrained supply supports both.
Investment metrics
- 1% rule
- 0.95% ✗
- Cap rate
- 7.41%
- Cash-on-cash
- 3.98%
- DSCR
- 1.18
- GRM
- 8.8
CMA / ARV
- ARV (median comp)
- $208,305
- List price
- $149,900
- Delta
- -28.04%
- Verdict
- UNDERPRICED
- Comps
- 20 within 1.0 mi
Show comp detail 8 sales within ~0.75 mi
| Address | Dist | Beds/Ba | Sqft | Sold | Price | $/sf | Match |
|---|---|---|---|---|---|---|---|
| 1056 Lake Dockery Rd | 0.00mi | 3/2.0 (+1) | 1,271 (0%) | 1mo | $149,900 | $118 | 94 |
| 124 Lake Dockery Dr | 0.36mi | 3/2.0 (+1) | 1,327 (+4%) | 8mo | $199,900 | $151 | 64 |
| 78 Walsh Cv | 0.22mi | 3/2.0 (+1) | 1,395 (+10%) | 8mo | $195,000 | $140 | 62 |
| 125 Churchill Pl | 0.56mi | 3/2.0 (+1) | 1,388 (+9%) | 2mo | $209,900 | $151 | 52 |
| 33 Brock Dr | 0.16mi | 3/2.0 (+1) | 1,437 (+13%) | 17mo | $199,900 | $139 | 52 |
| 127 Torrence Cv | 0.73mi | 3/2.0 (+1) | 1,328 (+4%) | 4mo | $190,000 | $143 | 50 |
| 100 Torrence Cv | 0.62mi | 3/2.0 (+1) | 1,390 (+9%) | 12mo | $190,000 | $137 | 41 |
| 640 Byram Meadows Dr | 0.72mi | 3/2.0 (+1) | 1,414 (+11%) | 18mo | $210,000 | $149 | 28 |
Match score weights: distance 35% · size 25% · config 20% · recency 20%. Top-matched comps best support the ARV.
Projected returns pro-forma
-3.0% appreciation · 3.0% rent growth · sell at horizon
- IRR
- -10.1%
- Equity multiple
- 0.63×
- Total profit
- $-15,435
- Equity at exit
- $22,351
- IRR
- -0.7%
- Equity multiple
- 0.95×
- Total profit
- $-2,070
- Equity at exit
- $12,961
Cash invested: $41,972 (down + closing). Projections, not guarantees.
Landlord ↔ Tenant lean methodology
- Overall (STATE)
- 90 Strongly Landlord-Friendly
- State Mississippi
- 90 Strongly Landlord-Friendly · R+11
- County
- — inherits STATE
- City
- — inherits STATE
ZIP-level market 39272
- Home prices YoY
- -9.8%
- Active inventory
- 105
- Price-to-rent
- 8.8×
Monthly cashflow live
- Estimated rent
- $1,420 high interval (Pro) →
- Mortgage (P&I)
- −$786
- Tax from tax record
- −$134 /mo · $1,612/yr
- Insurance
- −$62
- HOA
- −$0
- Vacancy / Maint / Mgmt
- −$298
- Net cashflow
- $139
Break-even live
UW: 25.0% down · 7.5% · 30yr · 1.5% tax · 5.0% vac · 8.0% maint · 8.0% mgmt
Financing live
Cash to close
- Down payment
- $37,475
- Closing costs
- $4,497
- Reserves months
- —
- Total cash needed
- —
Loan-product check · same deal, 3 products live
Conventional
25% down · 7.5% · 30yr
- Down + closing
- —
- Monthly P&I
- —
- Monthly cashflow
- —
- DSCR
- —
- Eligible?
- —
Personal DTI + credit; lowest rate.
DSCR
20% down · 8.5% · 30yr
- Down + closing
- —
- Monthly P&I
- —
- Monthly cashflow
- —
- DSCR
- —
- Eligible?
- —
No personal income docs; deal must DSCR.
Hard money
10% down · 12.0% · 12mo
- Down + closing
- —
- Monthly P&I
- —
- Monthly cashflow
- —
- DSCR
- —
- Eligible?
- —
Short-term bridge; refi at stabilization.
Rent comps 11 comps
| Address | Beds | Baths | Sqft | Rent | $/sqft | DOM | Units | Dist |
|---|---|---|---|---|---|---|---|---|
| 100 Byram Dr Byram, MS | 2.0 | 2.0 | 1050 | $1,250 | $1.19 | 44d | 1 | 0.77mi |
| 100 Byram Dr Byram, MS | 2.0 | 2.0 | 1050 | $1,380 | $1.31 | 21d | 1 | 0.77mi |
| 100 Byram Dr Byram, MS | 2.0 | 2.0 | 1050 | $1,250 | $1.19 | 14d | 1 | 0.77mi |
| 257 Gaddy Dr Byram, MS | 3.0 | 2.0 | 1400 | $1,900 | $1.36 | 14d | 1 | 0.78mi |
| 350 Byram Dr Byram, MS | 2.0 | 2.0 | 987 | $1,215 | $1.23 | 21d | 1 | 0.90mi |
| 350 Byram Dr Byram, MS | 1.0 | 1.0 | 875 | $1,175 | $1.34 | 44d | 1 | 0.90mi |
| 1000 Spring Lake Blvd Byram, MS | 2.0 | 2.0 | 1112 | $1,485 | $1.34 | 44d | 1 | 0.98mi |
| 1000 Spring Lake Blvd Byram, MS | 2.0 | 2.0 | 1156 | $1,470 | $1.27 | 14d | 1 | 0.98mi |
| 1000 Spring Lake Blvd Byram, MS | 3.0 | 2.0 | 1356 | $1,615 | $1.19 | 21d | 1 | 0.98mi |
| 1000 Spring Lake Blvd Byram, MS | 1.0 | 1.0 | 948 | $1,160 | $1.22 | 23d | 1 | 0.98mi |
| 306 Gary Daniels Dr Byram, MS | 3.0 | 2.0 | 1517 | $1,595 | $1.05 | 44d | 1 | 1.18mi |
Listing history 11 events
-
2026-05-08status Pending 505-char remark
Show marketing remark (505 chars)
Unbelievable price for this great starter home! 3-bedroom, 2 bath split plan with large den, eat in kitchen and back porch. There are two parking spaces in back and two in front, partially fenced yard and a small fully fenced area for puppy play! All of this conveniently located in Byram, MS. The commute is minutes to anything in the metro area... work, entertainment, medical care, etc. You have access to beautiful, 44-acre Lake Dockery! Don't miss the opportunity to own this special property!
-
2026-03-05$149,900 Active 505-char remark
Show marketing remark (505 chars)
Unbelievable price for this great starter home! 3-bedroom, 2 bath split plan with large den, eat in kitchen and back porch. There are two parking spaces in back and two in front, partially fenced yard and a small fully fenced area for puppy play! All of this conveniently located in Byram, MS. The commute is minutes to anything in the metro area... work, entertainment, medical care, etc. You have access to beautiful, 44-acre Lake Dockery! Don't miss the opportunity to own this special property!
-
2021-10-08historical
-
2018-02-01soldstatus
-
2017-12-27soldstatus
-
2017-11-06soldstatus
-
2015-01-28soldstatus
-
2014-12-15$27,000
-
2013-04-29$36,000
-
2001-08-16soldstatus
-
1988-07-22soldstatus
ⓘ Source: listings_history table (triggers on properties + properties_extension) + one-shot
backfill from property_details.listing_events for pre-trigger history.
Tax reassessment forecast MS · Resets to sale price
- Current annual tax
- $1,612 · $134/mo
- Projected year-2 tax
- $1,612 · $134/mo
- Expected delta
- $0/yr ($0/mo · 0.0%)
ⓘ Screening estimate from a state-policy table — verify with the county assessor before closing.
Climate risk First Street
- Flood 1/10 Low FEMA zone X (unshaded) · 0% chance over 30 yrs
- Wildfire 4/10 Moderate
- Heat 7/10 Severe 7 d/yr ≥108°F today · 20 d/yr by 30 yrs out
- Wind 8/10 Severe 80% chance of damaging wind over 30 yrs
- Air quality 1/10 Low 0 unhealthy d/yr today · 0 by 30 yrs out
Nearby sold comps map
Loading sold comps map…
Walkable amenities ~0.75 mi
Loading nearby amenities…
Taxation est. · year 1
- Rental income
- $17,044
- − Mortgage interest
- −$8,397
- − Property taxes
- −$1,612
- − Insurance
- −$750
- − Repairs & maintenance
- −$1,364
- − Management
- −$1,364
- − Depreciation
- −$4,361
- Taxable loss
- −$802
- Est. tax savings @ 24.0%
- +$192
- After-tax cash flow
- $1,863/yr
For passive investors: Depreciation is non-cash, so a rental often shows a tax loss while cash-flowing — sheltering income. Rental losses are passive: they offset passive income freely, and up to $25,000/yr can offset ordinary (W-2) income if you actively participate and your MAGI is under $100k (phasing out to $0 by $150k); unused losses carry forward. On sale, claimed depreciation is recaptured at up to 25%, and gains may owe capital-gains tax (a 1031 exchange can defer both). Figures are a year-1 estimate at your 24.0% rate — not tax advice; consult a CPA.
Schools (NCES district)
- District
- Hinds County School District
- NCES district ID
- 2801860
- Math proficiency
- 25% ▼ -16.00%
- Reading proficiency
- 29% ▼ -5.00%
- Median HH income
- $53,335
- Composite
- 24.02/100
- National rank
- #7771
- State rank
- #70 of 130 in MS
Livability — Byram
- Score
- 69/100
- State rank
- #45
- US rank
- #8178
Category grades
Schools grade is shown separately in the Schools card above.
Census & demographics
- Census place
- Byram, MS
- City population
- 14,161
- Population (ZIP)
- 14,161
Population outlook (Hinds County) Hauer SSP2
- Today (2025)
- 242,528 people
- By 2030
- 241,113 · -0.6%
- By 2040
- 235,557 · -2.9%
- By 2050
- 226,946 · -6.4%
- By 2075
- 199,995 · -17.5%
- By 2100
- 164,165 · -32.3%
Race, ethnicity, and origin ACS 2023
- Neighborhood character
- Predominantly Black (75%)
- Race & ethnicity
- Black 75% White 22% Two or more races 2% Hispanic / Latino 2%
- Common ancestry
- Swedish 2% Lithuanian 1%
- Foreign-born
- 1% · Vietnam
- Languages at home
- 98% English-only · Spanish 1%
Political lean MEDSL · Hinds
- 2024 margin
- Solid D (+46.1) · D 72.4% · R 26.3% · Other 1.4%
- 2008→2024 swing
- +7.1pp toward D · 2008: 39.0pp · 2024: 46.1pp
- All cycles
- 2024: D+46.1 2020: D+48.3 2016: D+43.7 2012: D+45.1 2008: D+39.0
Not yet ingested
- Civics
- —
Market trends
- HPI YoY
- ▼ -20.11%
- Current HPI
- 184.3215
- Rent YoY
- —
- Metro
- —
- State GDP YoY
- —
- F500 in state
- 0
Price history
+316.4% since first listed11 events — show timeline
- 2026-05-08 Pending — MLSU
- 2026-03-05 Listed $149,900 MLSU
- 2021-10-08 Listing Removed — MLSU
- 2018-02-01 Sold (Public Records) — Public Records
- 2017-12-27 Sold (Public Records) — Public Records
- 2017-11-06 Sold (Public Records) — Public Records
- 2015-01-28 Sold (MLS) — MLSU
- 2014-12-15 Listed $27,000 MLSU
- 2013-04-29 Listed $36,000 MLSU
- 2001-08-16 Sold (Public Records) — Public Records
- 1988-07-22 Sold (Public Records) — Public Records
Property tax history
+1.3%/yrLatest (2025): $1,612 · +3.7% YoY. Source: county tax records.
Cash-flow waterfall
monthlySold comps — $/sqft
last 12 mo · ≤1 miLoading sold comps…