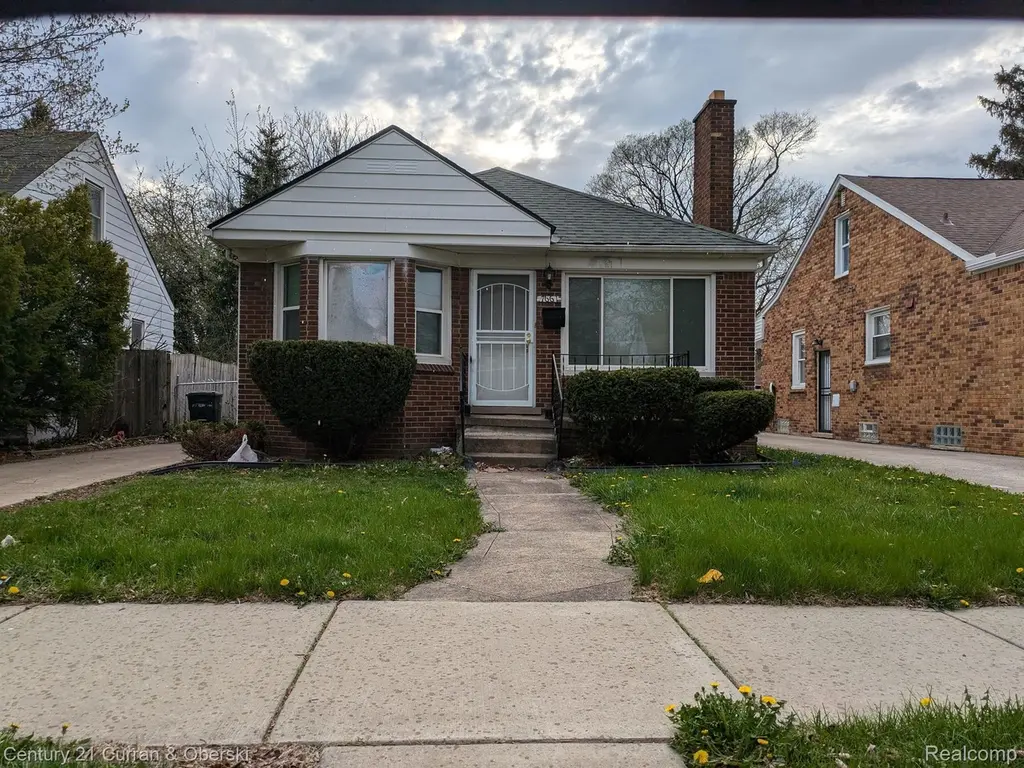
7661 Penrod St · Detroit, MI
Flood risk 1/10 · Minimal
- FEMA flood zone
- X (unshaded)
- Chance of flooding over 30 yrs
- 0.0%
- Est. flood insurance / yr
- $473 – $860
Fire risk 1/10 · Minimal
- Est. fire insurance / yr
- $784 – $1,456
Heat risk 3/10 · Minor
- Hot days now (above 97°F)
- 7 days/yr
- Hot days in 30 yrs
- 15 days/yr
Wind risk 2/10 · Minimal
- Chance of severe wind over 30 yrs
- —
Air-quality risk 3/10 · Minor
- Unhealthy air days now
- 2 days/yr
- Unhealthy air days in 30 yrs
- 4 days/yr
Risk factors via First Street. Map © Google.
Why this score? — see what drove the C+ grade
The composite is a weighted blend of 9 inputs, each scored 0–100. Each bar is that input's sub-score; the figure is the points it added to the 100-point composite (weight × sub-score).
- Cash flow +29.5/30.0
- DSCR +10.0/10.0
- 1% rule +8.4/10.0
- ARV discount +7.5/15.0
- Livability +3.7/5.0
- Condition / age +2.5/5.0
- Rent growth +1.9/5.0
- Schools +1.3/10.0
- Appreciation +0.0/10.0
$98,000
🖨 Deal sheet (PDF) 📄 Offer letter ✓ Due diligence
Listing remarks MLS
Investor special , very well maintained house. Buy it by itself or as a bundle with these listings :9553 Auburn , 18651 Warwick , 16559 Mansfield , 18699 Forrer . .. BATVAI
Key facts
- 5,663 sq ft lot
- Garage
- Built 1949
Neighborhood map
What this means for you Summary
Snapshot
- This is a 3-bed/1.0-bath single-family listed at $98k.
Deal economics
- At list price, monthly cash flow is $352 ($4k/yr) — positive.
- The deal already cash-flows at list — no discount required.
- Meets the 1% rule at list price ($1k rent vs $98k).
- Recommended offer: $86k (12.0% below list) — sets the bar for market timing.
Location & tenants
- Location reads 73/100 on livability (#218 in MI) — a middle-class / working-renter tenant base. Strengths: amenities A+, commute A+, cost of living A+; Watch: schools F, crime F, employment F.
- Detroit Public Schools Community District (urban): math 10% / reading 24% proficiency, ranked #499 of 540 in MI (top 92%) — low school quality limits family demand, transient renter base, plan for 1-2y turnover; 90% free/reduced lunch — lower-income household profile, screen leases tightly.
- Market conditions: Rents soft (-2.3%/yr); 367 active listings in the ZIP; 30 comparable units currently listed for rent nearby; rentals at typical pace (median 23d on market — plan ~3-4 weeks tenant-placement turnaround); lower-income renter base — watch delinquency; 2,639 units permitted in Wayne County in 2024 (1,216 in 5+ unit buildings).
- At $1,314/mo this rent would consume 51% of the median local household income ($31k/yr) (locally 4144% of renters already pay >50% of income on rent) — very limited rent-growth headroom before tenants either downsize or default.
Forward outlook
- Local home prices are declining (-3.0%/yr); year-one equity from $678 of loan paydown is wiped out by about $3k of value loss. Plan a longer hold.
- Wayne County population projected at -17% by 2050 — secular population decline; favor cash flow + early exit over multi-decade hold.
Negotiation context
- It's been on market 380 days — a 12% lower offer ($86k) is reasonable based on typical stale-listing flexibility.
- 8 sale attempts since 21y ago; this cycle's ask is 3% above the opening price — seller raised mid-cycle; expect resistance to lowballs.
- Current owner paid $15k; list at $98k implies a 553% gain — meaningful room to come down on a strong offer.
Risks & watch-outs
- Watch-outs: built in 1949 — expect roof / HVAC / electrical / plumbing capex.
Questions for the listing agent
- It's been on market 380 days. Have you received any prior offers? Is the seller open to a 12% concession, seller financing, or rate buy-down credit?
- Built in 1949 — when were the roof, HVAC, electrical panel, plumbing, and water heater last replaced?
- Why hasn't it sold? Are there any deal-killer items the seller is aware of (foundation, flood, title, zoning, code violations)?
- Is there a deadline driving the sale (1031 exchange, divorce, estate, relocation)? That informs how much negotiation room exists.
- Schools are F-rated, which usually means shorter tenancies and higher turnover. Who's the typical renter profile here, and what's been the actual vacancy rate?
- Crime grade is F in this area — have there been break-ins, vandalism, or insurance claims at this property in the last 3 years? What carrier currently insures it and at what premium?
- What's the average days-on-market for RENTAL listings here right now (not sales)? A rising rental-DOM trend means longer vacancies and softer asking-rent achievability than the comps imply.
- What's the recent tenant-quality profile in this submarket — average credit score on applications, eviction rate, late-payment / NSF rate, and stable-employment percentage? A property-management company in the area should have these aggregated.
- How much new for-sale + rental construction is in the pipeline within 1–3 miles? Heavy new supply typically softens prices + rents 12–24 months out; constrained supply supports both.
Investment metrics
- 1% rule
- 1.34% ✓
- Cap rate
- 10.60%
- Cash-on-cash
- 15.39%
- DSCR
- 1.68
- GRM
- 6.2
CMA / ARV
- ARV (median comp)
- $60,432
- List price
- $98,000
- Delta
- 62.17%
- Verdict
- OVERPRICED
- Comps
- 20 within 1.0 mi
Show comp detail 12 sales within ~0.75 mi
| Address | Dist | Beds/Ba | Sqft | Sold | Price | $/sf | Match |
|---|---|---|---|---|---|---|---|
| 7667 Greenview Ave | 0.12mi | 3/1.0 | 960 (-4%) | 2mo | $65,100 | $68 | 85 |
| 8449 Penrod St | 0.49mi | 3/1.0 | 1,011 (+1%) | 0mo | $95,000 | $94 | 76 |
| 6712 Artesian St | 0.62mi | 3/1.0 | 1,000 (-0%) | 1mo | $97,500 | $98 | 69 |
| 6760 Warwick St | 0.61mi | 3/1.0 | 960 (-4%) | 2mo | $70,000 | $73 | 63 |
| 7296 Auburn St | 0.69mi | 3/1.0 | 968 (-4%) | 2mo | $38,000 | $39 | 60 |
| 8427 Piedmont St | 0.64mi | 3/1.0 | 1,056 (+5%) | 2mo | $62,000 | $59 | 60 |
| 8309 Brace St | 0.46mi | 3/1.5 | 864 (-14%) | 1mo | $28,500 | $33 | 52 |
| 7756 Westwood St | 0.54mi | 3/1.0 | 871 (-13%) | 2mo | $90,000 | $103 | 51 |
| 8626 Brace St | 0.61mi | 3/1.0 | 1,124 (+12%) | 2mo | $65,000 | $58 | 50 |
| 8225 Grandville Ave | 0.60mi | 2/1.0 (-1) | 906 (-10%) | 2mo | $36,500 | $40 | 49 |
| 6789 Grandmont Ave | 0.74mi | 2/1.0 (-1) | 911 (-9%) | 1mo | $80,000 | $88 | 44 |
| 8686 Artesian St | 0.71mi | 3/1.0 | 864 (-14%) | 2mo | $35,000 | $41 | 42 |
Match score weights: distance 35% · size 25% · config 20% · recency 20%. Top-matched comps best support the ARV.
Projected returns pro-forma
-3.0% appreciation · 0.0% rent growth · sell at horizon
- IRR
- 2.7%
- Equity multiple
- 1.10×
- Total profit
- $2,709
- Equity at exit
- $14,612
- IRR
- 9.1%
- Equity multiple
- 1.60×
- Total profit
- $16,445
- Equity at exit
- $8,473
Cash invested: $27,440 (down + closing). Projections, not guarantees.
Landlord ↔ Tenant lean methodology
- Overall (STATE)
- 62 Landlord-Friendly
- State Michigan
- 62 Landlord-Friendly · EVEN
- County
- — inherits STATE
- City
- — inherits STATE
ZIP-level market 48228
- Rents YoY
- -2.3%
- Active inventory
- 367
- Price-to-rent
- 6.2×
Monthly cashflow live
- Estimated rent
- $1,314 high interval (Pro) →
- Mortgage (P&I)
- −$514
- Tax from tax record
- −$131 /mo · $1,574/yr
- Insurance
- −$41
- HOA
- −$0
- Vacancy / Maint / Mgmt
- −$276
- Net cashflow
- $352
Break-even live
Sensitivity live
| Price | -10% $407 | -5% $380 | +0% $352 | +5% $324 | +10% $296 |
|---|---|---|---|---|---|
| Rent | -10% $248 | -5% $300 | +0% $352 | +5% $404 | +10% $456 |
| Rate | -1.0pp $401 | -0.5pp $377 | base $352 | +0.5pp $327 | +1.0pp $301 |
UW: 25.0% down · 7.5% · 30yr · 1.5% tax · 5.0% vac · 8.0% maint · 8.0% mgmt
Financing live
Cash to close
- Down payment
- $24,500
- Closing costs
- $2,940
- Reserves months
- —
- Total cash needed
- —
Loan-product check · same deal, 3 products live
Conventional
25% down · 7.5% · 30yr
- Down + closing
- —
- Monthly P&I
- —
- Monthly cashflow
- —
- DSCR
- —
- Eligible?
- —
Personal DTI + credit; lowest rate.
DSCR
20% down · 8.5% · 30yr
- Down + closing
- —
- Monthly P&I
- —
- Monthly cashflow
- —
- DSCR
- —
- Eligible?
- —
No personal income docs; deal must DSCR.
Hard money
10% down · 12.0% · 12mo
- Down + closing
- —
- Monthly P&I
- —
- Monthly cashflow
- —
- DSCR
- —
- Eligible?
- —
Short-term bridge; refi at stabilization.
Rent comps 30 comps
| Address | Beds | Baths | Sqft | Rent | $/sqft | DOM | Units | Dist |
|---|---|---|---|---|---|---|---|---|
| 8262 Rosemont Ave Detroit, MI | 3.0 | 1.0 | 836 | $1,200 | $1.44 | 6d | 1 | 0.38mi |
| 8451 Rosemont Ave Detroit, MI | 3.0 | 1.0 | 867 | $1,150 | $1.33 | 45d | 1 | 0.49mi |
| 6490 Stahelin Ave Detroit, MI | 3.0 | 1.0 | 960 | $1,299 | $1.35 | 18d | 1 | 0.67mi |
| 6761 Memorial Ave Detroit, MI | 3.0 | 1.0 | 1060 | $1,100 | $1.04 | 25d | 1 | 0.68mi |
| 8850 Rosemont Ave Detroit, MI | 3.0 | 1.0 | 933 | $1,100 | $1.18 | 19d | 1 | 0.74mi |
| 19301 Joy Rd Apt 1 Detroit, MI | 2.0 | 1.0 | 750 | $1,100 | $1.47 | 45d | 1 | 0.83mi |
| 7794 Vaughan St Detroit, MI | 3.0 | 1.0 | 1000 | $1,450 | $1.45 | 18d | 1 | 0.86mi |
| 9090 Stahelin Ave Detroit, MI | 2.0 | 1.0 | 787 | $1,250 | $1.59 | 45d | 1 | 0.92mi |
| 7312 Mansfield St Detroit, MI | 4.0 | 1.0 | 1300 | $1,400 | $1.08 | 18d | 1 | 0.94mi |
| 7419 Rutherford St Detroit, MI | 2.0 | 1.0 | 981 | $1,100 | $1.12 | 0d | 1 | 0.94mi |
| 9108 Archdale St Detroit, MI | 3.0 | 1.0 | 1000 | $1,300 | $1.30 | 6d | 1 | 0.95mi |
| 8283 Vaughan St Detroit, MI | 3.0 | 1.0 | 1058 | $1,294 | $1.22 | 6d | 1 | 0.96mi |
| 7411 Stout St Detroit, MI | 3.0 | 1.0 | 888 | $1,428 | $1.61 | 14d | 1 | 1.00mi |
| 20431 Tireman St Detroit, MI | 3.0 | 1.0 | 1020 | $1,350 | $1.32 | 19d | 1 | 1.03mi |
| 6474 Saint Marys St Detroit, MI | 3.0 | 1.0 | 1237 | $1,350 | $1.09 | 45d | 1 | 1.07mi |
| 5777 Southfield Fwy Detroit, MI | 2.0 | 1.0–2.0 | 667 | $1,530 | $2.29 | 0d | 7 | 1.13mi |
| 6874 Country Ln Dearborn Heights, MI | 2.0 | 1.5 | 1400 | $1,500 | $1.07 | 45d | 1 | 1.15mi |
| 18450 W Chicago Detroit, MI | 1.0–2.0 | 1.0 | 687 | $1,117 | $1.62 | 0d | 15 | 1.19mi |
| 20571 Brooklawn Dr Dearborn Heights, MI | 3.0 | 2.0 | 1254 | $1,850 | $1.48 | 45d | 1 | 1.29mi |
| 19449 W Chicago St Detroit, MI | 3.0 | 1.5 | 950 | $1,500 | $1.58 | 45d | 1 | 1.30mi |
| 19440 W Chicago St Detroit, MI | 3.0 | 1.5 | 1200 | $1,225 | $1.02 | 23d | 1 | 1.33mi |
| 19440 W Chicago St Detroit, MI | 3.0 | 1.5 | 1200 | $1,225 | $1.02 | 19d | 1 | 1.33mi |
| 9220 Mansfield St Detroit, MI | 3.0 | 1.0 | 1200 | $1,300 | $1.08 | 45d | 1 | 1.33mi |
| 5965 Evergreen Rd Dearborn Heights, MI | 1.0–2.0 | 1.0 | 825 | $1,350 | $1.64 | 6d | 1 | 1.35mi |
| 8331 Whitcomb St Detroit, MI | 4.0 | 1.0 | 1342 | $1,350 | $1.01 | 23d | 1 | 1.38mi |
| 8270 Trinity St Detroit, MI | 3.0 | 1.0 | 806 | $1,528 | $1.90 | 45d | 1 | 1.39mi |
| 9345 Rutherford St Unit 3 Detroit, MI | 2.0 | 1.0 | 850 | $1,050 | $1.24 | 25d | 1 | 1.42mi |
| 8604 Whitcomb St Detroit, MI | 3.0 | 2.0 | 1033 | $1,300 | $1.26 | 45d | 1 | 1.45mi |
| 9222 Forrer St Detroit, MI | 3.0 | 1.0 | 947 | $1,450 | $1.53 | 18d | 1 | 1.46mi |
| 8047 Robson St Detroit, MI | 3.0 | 2.0 | 1184 | $1,200 | $1.01 | 45d | 1 | 1.48mi |
Listing history 47 events
-
2026-06-21days on market $98,000 Active 380 DOM
-
2026-06-18days on market $98,000 Active 377 DOM
-
2026-06-17days on market $98,000 Active 376 DOM
-
2026-06-15days on market $98,000 Active 374 DOM
-
2026-06-13days on market $98,000 Active 372 DOM
-
2026-06-13days on market $98,000 Active 371 DOM
-
2026-06-09days on market $98,000 Active 368 DOM
-
2026-06-08days on market $98,000 Active 367 DOM
-
2026-06-07days on market $98,000 Active 366 DOM
-
2026-06-04days on market $98,000 Active 363 DOM
-
2026-06-03days on market $98,000 Active 362 DOM
-
2026-06-01days on market $98,000 Active 360 DOM
-
2026-05-31days on market $98,000 Active 359 DOM
-
2026-05-21price $98,000 172-char remark
Show marketing remark (172 chars)
Investor special , very well maintained house. Buy it by itself or as a bundle with these listings :9553 Auburn , 18651 Warwick , 16559 Mansfield , 18699 Forrer . .. BATVAI
-
2026-05-20price $98,000 174-char remark
Show marketing remark (174 chars)
Investor special , very well maintained house. Buy it by itself or as a bundle with these listings :9553 Auburn , 18651 Warwick , 16559 Mansfield , 18699 Forrer . .. BATVAI
-
2026-05-08status Active 174-char remark
Show marketing remark (172 chars)
Investor special , very well maintained house. Buy it by itself or as a bundle with these listings :9553 Auburn , 18651 Warwick , 16559 Mansfield , 18699 Forrer . .. BATVAI
-
2026-05-08status Active 172-char remark
Show marketing remark (172 chars)
Investor special , very well maintained house. Buy it by itself or as a bundle with these listings :9553 Auburn , 18651 Warwick , 16559 Mansfield , 18699 Forrer . .. BATVAI
-
2026-04-01status Pending 172-char remark
Show marketing remark (174 chars)
Investor special , very well maintained house. Buy it by itself or as a bundle with these listings :9553 Auburn , 18651 Warwick , 16559 Mansfield , 18699 Forrer . .. BATVAI
-
2026-04-01status Pending 174-char remark
Show marketing remark (174 chars)
Investor special , very well maintained house. Buy it by itself or as a bundle with these listings :9553 Auburn , 18651 Warwick , 16559 Mansfield , 18699 Forrer . .. BATVAI
-
2026-03-17price $105,000 172-char remark
Show marketing remark (172 chars)
Investor special , very well maintained house. Buy it by itself or as a bundle with these listings :9553 Auburn , 18651 Warwick , 16559 Mansfield , 18699 Forrer . .. BATVAI
-
2026-03-16price $105,000 174-char remark
Show marketing remark (174 chars)
Investor special , very well maintained house. Buy it by itself or as a bundle with these listings :9553 Auburn , 18651 Warwick , 16559 Mansfield , 18699 Forrer . .. BATVAI
-
2025-12-30price $125,000 172-char remark
Show marketing remark (172 chars)
Investor special , very well maintained house. Buy it by itself or as a bundle with these listings :9553 Auburn , 18651 Warwick , 16559 Mansfield , 18699 Forrer . .. BATVAI
-
2025-12-29price $125,000 174-char remark
Show marketing remark (174 chars)
Investor special , very well maintained house. Buy it by itself or as a bundle with these listings :9553 Auburn , 18651 Warwick , 16559 Mansfield , 18699 Forrer . .. BATVAI
-
2025-10-07price $110,000 172-char remark
Show marketing remark (172 chars)
Investor special , very well maintained house. Buy it by itself or as a bundle with these listings :9553 Auburn , 18651 Warwick , 16559 Mansfield , 18699 Forrer . .. BATVAI
-
2025-10-06price $110,000 174-char remark
Show marketing remark (174 chars)
Investor special , very well maintained house. Buy it by itself or as a bundle with these listings :9553 Auburn , 18651 Warwick , 16559 Mansfield , 18699 Forrer . .. BATVAI
-
2025-07-29price $95,000 172-char remark
Show marketing remark (174 chars)
Investor special , very well maintained house. Buy it by itself or as a bundle with these listings :9553 Auburn , 18651 Warwick , 16559 Mansfield , 18699 Forrer . .. BATVAI
-
2025-07-29price $95,000 174-char remark
Show marketing remark (174 chars)
Investor special , very well maintained house. Buy it by itself or as a bundle with these listings :9553 Auburn , 18651 Warwick , 16559 Mansfield , 18699 Forrer . .. BATVAI
-
2025-05-06price $105,000 172-char remark
Show marketing remark (172 chars)
Investor special , very well maintained house. Buy it by itself or as a bundle with these listings :9553 Auburn , 18651 Warwick , 16559 Mansfield , 18699 Forrer . .. BATVAI
-
2025-05-05price $105,000 174-char remark
Show marketing remark (174 chars)
Investor special , very well maintained house. Buy it by itself or as a bundle with these listings :9553 Auburn , 18651 Warwick , 16559 Mansfield , 18699 Forrer . .. BATVAI
-
2025-04-30$95,000 Active 174-char remark
Show marketing remark (172 chars)
Investor special , very well maintained house. Buy it by itself or as a bundle with these listings :9553 Auburn , 18651 Warwick , 16559 Mansfield , 18699 Forrer . .. BATVAI
-
2025-04-30$95,000 Active 172-char remark
Show marketing remark (172 chars)
Investor special , very well maintained house. Buy it by itself or as a bundle with these listings :9553 Auburn , 18651 Warwick , 16559 Mansfield , 18699 Forrer . .. BATVAI
-
2025-04-29historical $95,000 172-char remark
Show marketing remark (172 chars)
Investor special , very well maintained house. Buy it by itself or as a bundle with these listings :9553 Auburn , 18651 Warwick , 16559 Mansfield , 18699 Forrer . .. BATVAI
-
2012-06-06soldstatus $15,000
-
2012-06-06soldstatus $15,000
-
2012-05-18soldstatus $15,000
-
2012-05-18soldstatus $15,000
-
2012-02-08historical
-
2012-02-01$15,900
-
2012-02-01$15,900
-
2012-01-24soldstatus $99,383
-
2012-01-24soldstatus $99,383
-
2005-07-20soldstatus $58,300
-
2005-07-20soldstatus $58,300
-
2005-06-10historical
-
2005-04-28$59,900
-
2005-04-28$59,900
-
1994-07-07soldstatus $32,000
ⓘ Source: listings_history table (triggers on properties + properties_extension) + one-shot
backfill from property_details.listing_events for pre-trigger history.
Tax reassessment forecast MI · Partial reset (capped growth)
- Current annual tax
- $1,574 · $131/mo
- Projected year-2 tax
- $1,574 · $131/mo
- Expected delta
- $0/yr ($0/mo · 0.0%)
ⓘ Screening estimate from a state-policy table — verify with the county assessor before closing.
Climate risk First Street
- Flood 1/10 Low FEMA zone X (unshaded) · 0% chance over 30 yrs
- Wildfire 1/10 Low
- Heat 3/10 Moderate 7 d/yr ≥97°F today · 15 d/yr by 30 yrs out
- Wind 2/10 Low
- Air quality 3/10 Moderate 2 unhealthy d/yr today · 4 by 30 yrs out
Nearby sold comps map
Loading sold comps map…
Walkable amenities ~0.75 mi
Loading nearby amenities…
Taxation est. · year 1
- Rental income
- $15,764
- − Mortgage interest
- −$5,490
- − Property taxes
- −$1,574
- − Insurance
- −$490
- − Repairs & maintenance
- −$1,261
- − Management
- −$1,261
- − Depreciation
- −$2,851
- Taxable income
- $2,838
- Est. tax owed @ 24.0%
- −$681
- After-tax cash flow
- $3,542/yr
For passive investors: Depreciation is non-cash, so a rental often shows a tax loss while cash-flowing — sheltering income. Rental losses are passive: they offset passive income freely, and up to $25,000/yr can offset ordinary (W-2) income if you actively participate and your MAGI is under $100k (phasing out to $0 by $150k); unused losses carry forward. On sale, claimed depreciation is recaptured at up to 25%, and gains may owe capital-gains tax (a 1031 exchange can defer both). Figures are a year-1 estimate at your 24.0% rate — not tax advice; consult a CPA.
Schools (NCES district)
- District
- Detroit Public Schools Community District
- NCES district ID
- 2601103
- Math proficiency
- 10% ▼ -2.00%
- Reading proficiency
- 24% ▲ 6.00%
- Median HH income
- $25,815
- Composite
- 13.06/100
- National rank
- #9564
- State rank
- #499 of 540 in MI
Livability — Detroit
- Score
- 73/100
- State rank
- #218
- US rank
- #5427
Category grades
Schools grade is shown separately in the Schools card above.
Census & demographics
- Census place
- Detroit, MI
- County
- Wayne County · 1,562,939 people
- City population
- 572,865
- Metro
- Detroit-Warren-Dearborn, MI
- Population (ZIP)
- 50,117
- Household income
- $30,680
- Rent vs Own
- Severe rent burden
- 4144.0
Population outlook (Wayne County) Hauer SSP2
- Today (2025)
- 1,675,273 people
- By 2030
- 1,620,300 · -3.3%
- By 2040
- 1,502,341 · -10.3%
- By 2050
- 1,384,039 · -17.4%
- By 2075
- 1,124,592 · -32.9%
- By 2100
- 881,193 · -47.4%
Race, ethnicity, and origin ACS 2023
- Neighborhood character
- Predominantly Black (71%)
- Race & ethnicity
- Black 71% White 16% Two or more races 7% Hispanic / Latino 6%
- Hispanic origin (detail)
- Mexican 3% Puerto Rican 2%
- Common ancestry
- Arab 2% Romanian 2% Lithuanian 1%
- Foreign-born
- 11% · Canada
- Languages at home
- 82% English-only · Arabic 11% Spanish 5%
Political lean MEDSL · Wayne
- 2024 margin
- Strong D (+29.0) · D 62.7% · R 33.7% · Other 3.6%
- 2008→2024 swing
- -20.5pp toward R · 2008: 49.5pp · 2024: 29.0pp
- All cycles
- 2024: D+29.0 2020: D+38.1 2016: D+37.3 2012: D+46.9 2008: D+49.5
Not yet ingested
- Civics
- —
Market trends
- HPI YoY
- ▼ -160.81%
- Current HPI
- 168.6843
- Rent YoY
- ▼ -2.30%
- Metro
- Detroit-Warren-Dearborn, MI
- State GDP YoY
- ▲ 1.37%
- F500 in state
- 28
Industry mix (Fortune 500 HQ in MI)
| Industry | F500 HQs | Revenue |
|---|---|---|
| Automotive Parts | 3 | $48B |
|
||
| Automotive | 2 | $372B |
|
||
| Chemicals | 1 | $45B |
|
||
| Automotive Retail | 1 | $29B |
|
||
| Healthcare / Medical Devices | 1 | $23B |
|
||
| Automotive Technology | 1 | $20B |
|
||
Price history
+206.2% since first listed34 events — show timeline
- 2026-05-21 Price Changed $98,000 MiRealSource-MiMLS
- 2026-05-20 Price Changed $98,000 REALCOMP
- 2026-05-08 Relisted — REALCOMP
- 2026-05-08 Relisted — MiRealSource-MiMLS
- 2026-04-01 Pending — MiRealSource-MiMLS
- 2026-04-01 Pending — REALCOMP
- 2026-03-17 Price Changed $105,000 MiRealSource-MiMLS
- 2026-03-16 Price Changed $105,000 REALCOMP
- 2025-12-30 Price Changed $125,000 MiRealSource-MiMLS
- 2025-12-29 Price Changed $125,000 REALCOMP
- 2025-10-07 Price Changed $110,000 MiRealSource-MiMLS
- 2025-10-06 Price Changed $110,000 REALCOMP
- 2025-07-29 Price Changed $95,000 MiRealSource-MiMLS
- 2025-07-29 Price Changed $95,000 REALCOMP
- 2025-05-06 Price Changed $105,000 MiRealSource-MiMLS
- 2025-05-05 Price Changed $105,000 REALCOMP
- 2025-04-30 Listed $95,000 REALCOMP
- 2025-04-30 Listed $95,000 MiRealSource-MiMLS
- 2025-04-29 Coming Soon $95,000 MiRealSource-MiMLS
- 2012-06-06 Sold (Public Records) $15,000 Public Records
- 2012-06-06 Sold (Public Records) $15,000 Public Records
- 2012-05-18 Sold (MLS) $15,000 REALCOMP
- 2012-05-18 Sold (MLS) $15,000 MiRealSource-MiMLS
- 2012-02-08 Listing Removed — MiRealSource-MiMLS
- 2012-02-01 Listed $15,900 REALCOMP
- 2012-02-01 Listed $15,900 MiRealSource-MiMLS
- 2012-01-24 Sold (Public Records) $99,383 Public Records
- 2012-01-24 Sold (Public Records) $99,383 Public Records
- 2005-07-20 Sold (MLS) $58,300 MiRealSource-MiMLS
- 2005-07-20 Sold (MLS) $58,300 REALCOMP
- 2005-06-10 Listing Removed — MiRealSource-MiMLS
- 2005-04-28 Listed $59,900 MiRealSource-MiMLS
- 2005-04-28 Listed $59,900 REALCOMP
- 1994-07-07 Sold (Public Records) $32,000 Public Records
Property tax history
+2.7%/yrLatest (2025): $1,574 · -9.5% YoY. Source: county tax records.
Cash-flow waterfall
monthlySold comps — $/sqft
last 12 mo · ≤1 miLoading sold comps…