 Duplex
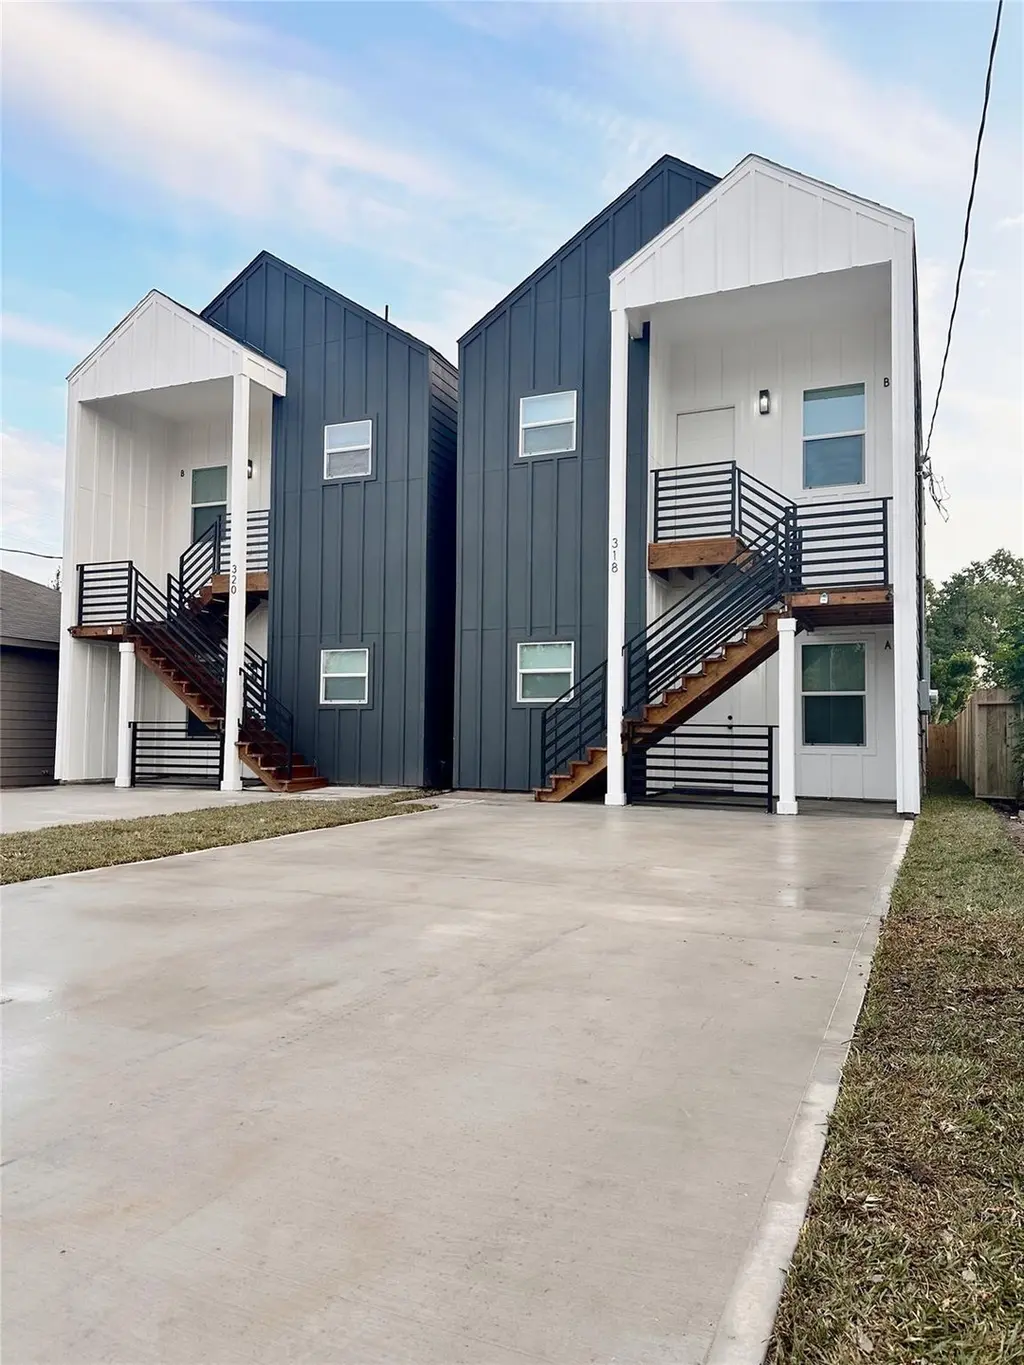
318 Tennessee St · Houston, TX
Flood risk 4/10 · Minor
- FEMA flood zone
- X (unshaded)
- Chance of flooding over 30 yrs
- 0.2%
- Est. flood insurance / yr
- $507 – $1,088
Fire risk 3/10 · Minor
- Est. fire insurance / yr
- $1,222 – $2,270
Heat risk 9/10 · Severe
- Hot days now (above 109°F)
- 7 days/yr
- Hot days in 30 yrs
- 22 days/yr
Wind risk 9/10 · Severe
- Chance of severe wind over 30 yrs
- 99.0%
Air-quality risk 2/10 · Minimal
- Unhealthy air days now
- 2 days/yr
- Unhealthy air days in 30 yrs
- 2 days/yr
Risk factors via First Street. Map © Google.
Why this score? — see what drove the D- grade
The composite is a weighted blend of 9 inputs, each scored 0–100. Each bar is that input's sub-score; the figure is the points it added to the 100-point composite (weight × sub-score).
- Appreciation +10.0/10.0
- Cash flow +8.0/30.0
- Livability +3.7/5.0
- ARV discount +3.6/15.0
- 1% rule +3.1/10.0
- Schools +2.8/10.0
- Rent growth +2.5/5.0
- Condition / age +2.5/5.0
- DSCR +2.1/10.0
$399,000
🖨 Deal sheet 📄 Offer letter ✓ Due diligence
Multi-family units
County records classify this as Multi-Family (2-4 Unit). Listing-text estimate: 2 units. confirmed
Listing remarks MLS
Prime investment opportunity in a vibrant Houston location, just minutes from downtown and within a short stroll to a nearby park. This thoughtfully designed duplex combines modern aesthetics with practical functionality, featuring soaring 10-foot ceilings, quartz countertops, soft-close kitchen drawers, and fully tiled baths from tub to ceiling. All-electric systems, individual driveways, gutters, and separate utilities reduce upkeep while maximizing rental appeal. Each unit offers a bright, open layout and high-quality finishes, attracting a wide tenant pool. The property’s turnkey condition ensures a smooth transition for investors seeking immediate income. Positioned in a strategic urban neighborhood, this duplex blends contemporary design, comfort, and long-term profitability, making it an exceptional choice for those looking to secure a stable, income-generating asset in Houston’s growing rental market.
Key facts
- Quartz countertops
- Fully tiled baths
- Nearby park
Tags
Neighborhood map
What this means for you Summary
Snapshot
- This is a 2 × 3-bed/2.0-bath units multifamily listed at $399k.
Deal economics
- At list price, monthly cash flow is $-405 ($-5k/yr) — negative. Per door: $-203/mo.
- To cash-flow at today's rent, offer at most $327k (18.0% below list).
- To meet the 1% rule (rent ≥ 1% of price), the offer needs to be $322k (19.4% below list).
- Recommended offer: $322k (19.4% below list) — sets the bar for 1% rule.
- Cap rate 5.1% vs local median 3.2% in Houston — top-decile yield for the area; either an underpriced asset or a hidden risk that comps aren't pricing in. Stress-test before assuming the spread holds.
Location & tenants
- Location reads 74/100 on livability (#184 in TX, #4,771 nationally) — a middle-class / working-renter tenant base. Strengths: amenities A+, cost of living A+, housing A+; Watch: schools D, crime F.
- Galena Park ISD (suburban): math 32% / reading 33% proficiency, ranked #578 of 826 in TX (top 70%) — families likely to look elsewhere, expect single-tenant / working-renter base with shorter leases; 74% free/reduced lunch — lower-income household profile, screen leases tightly.
- Market conditions: 153 active listings in the ZIP; 1 comparable units currently listed for rent nearby; 29,883 units permitted in Harris County in 2024 (8,621 in 5+ unit buildings).
- At $3,215/mo this rent would consume 80% of the median local household income ($48k/yr) (locally 457% of renters already pay >50% of income on rent) — very limited rent-growth headroom before tenants either downsize or default.
Forward outlook
- In year one you build about $43k of equity ($3k loan paydown + $40k appreciation (10.0% local appreciation)).
- Harris County population projected at +47% by 2050 — long-run rental-demand tailwind backs the buy-and-hold thesis.
- By year 2, paydown + projected appreciation supports a ~$69k cash-out refi (75% LTV) — recoverable capital for the next deal without selling this one.
Negotiation context
- It's been on market 111 days — a 9% lower offer ($363k) is reasonable based on typical stale-listing flexibility.
- 6 sale attempts since 3y ago with the ask held roughly flat each time — persistent listings suggest the price (not the market) is what's stuck; bring a comps-based counter.
Risks & watch-outs
- Climate carrying-cost: severe wind risk, 99% chance of damaging wind over 30y; extreme-heat days projected 7→22/yr by 2055 (HVAC capex compounding) — expect insurance premiums to compound above CPI over the hold.
Questions for the listing agent
- What do current leases actually rent for vs. the listed asking? Can we see a recent rent roll and the last 12 months of T-12 income?
- It's been on market 111 days. Have you received any prior offers? Is the seller open to a 19% concession, seller financing, or rate buy-down credit?
- Can we see the unit-by-unit rent roll, current vacancy, and any below-market leases? What's the average tenancy length?
- What capital expenditures (roof, boiler, parking lot, exteriors) have been made in the last 5 years, and what's planned in the next 2?
- Why hasn't it sold? Are there any deal-killer items the seller is aware of (foundation, flood, title, zoning, code violations)?
- Is there a deadline driving the sale (1031 exchange, divorce, estate, relocation)? That informs how much negotiation room exists.
- Schools are D-rated, which usually means shorter tenancies and higher turnover. Who's the typical renter profile here, and what's been the actual vacancy rate?
- Crime grade is F in this area — have there been break-ins, vandalism, or insurance claims at this property in the last 3 years? What carrier currently insures it and at what premium?
- The area grade is low — what's the realistic commute time and amenity access for the typical tenant pool here? Any planned neighborhood developments (good or bad) we should know about?
- What's the average days-on-market for RENTAL listings here right now (not sales)? A rising rental-DOM trend means longer vacancies and softer asking-rent achievability than the comps imply.
- What's the recent tenant-quality profile in this submarket — average credit score on applications, eviction rate, late-payment / NSF rate, and stable-employment percentage? A property-management company in the area should have these aggregated.
- How much new apartment / multifamily construction is in the pipeline within 1–3 miles? Heavy new supply (>2% of stock underway) typically softens rents 12–24 months out; light construction supports rent growth.
Investment metrics
- 1% rule
- 0.81% ✗
- Cap rate
- 5.07%
- Cash-on-cash
- -4.35%
- DSCR
- 0.81
- GRM
- 10.3
CMA / ARV
- ARV (median comp)
- $367,104
- List price
- $399,000
- Delta
- 8.69%
- Verdict
- FAIR
- Comps
- 20 within 1.0 mi
Show comp detail 5 sales within ~0.75 mi
| Address | Dist | Beds/Ba | Sqft | Sold | Price | $/sf | Match |
|---|---|---|---|---|---|---|---|
| 405 Clearwater AB St | 0.13mi | 6/2.0 | 2,368 (+11%) | 12mo | $369,900 | $156 | 58 |
| 407 Clearwater AB St | 0.13mi | 6/2.0 | 2,368 (+11%) | 12mo | $369,900 | $156 | 58 |
| 328 Clearwater AB St | 0.14mi | 6/2.0 | 2,368 (+11%) | 13mo | $369,900 | $156 | 57 |
| 330 Clearwater AB St | 0.14mi | 6/2.0 | 2,368 (+11%) | 13mo | $369,900 | $156 | 57 |
| 9715 Stedman | 0.55mi | 6/2.0 | 2,000 (-6%) | 20mo | $375,000 | $188 | 39 |
Match score weights: distance 35% · size 25% · config 20% · recency 20%. Top-matched comps best support the ARV.
Projected returns pro-forma
10.0% appreciation · 3.0% rent growth · sell at horizon
- IRR
- 21.2%
- Equity multiple
- 2.72×
- Total profit
- $191,648
- Equity at exit
- $359,451
- IRR
- 19.2%
- Equity multiple
- 6.24×
- Total profit
- $585,003
- Equity at exit
- $775,169
Cash invested: $111,720 (down + closing). Projections, not guarantees.
Landlord ↔ Tenant lean methodology
- Overall (STATE)
- 87 Strongly Landlord-Friendly
- State Texas
- 87 Strongly Landlord-Friendly · R+5
- County
- — inherits STATE
- City
- — inherits STATE
ZIP-level market 77029
- Home prices YoY
- 7.2%
- Active inventory
- 153
- Price-to-rent
- 20.7×
Monthly cashflow live
- Estimated rent
- $3,215 high interval (Pro) →
- Mortgage (P&I)
- −$2,092
- Tax from tax record
- −$687 /mo · $8,240/yr
- Insurance
- −$166
- HOA
- −$0
- Vacancy / Maint / Mgmt
- −$675
- Net cashflow
- $-405
Break-even live
2-unit breakdown (identical units grouped — click to expand)
| Units | Beds | Baths | Est. rent |
|---|---|---|---|
| 2× units | 3 | 2 | $3,216 |
| #1 | 3 | 2 | $1,608 |
| #2 | 3 | 2 | $1,608 |
| Total (2 units) | $3,215 | ||
UW: 25.0% down · 7.5% · 30yr · 1.5% tax · 5.0% vac · 8.0% maint · 8.0% mgmt
Financing live
Cash to close
- Down payment
- $99,750
- Closing costs
- $11,970
- Reserves months
- —
- Total cash needed
- —
Loan-product check · same deal, 3 products live
Conventional
25% down · 7.5% · 30yr
- Down + closing
- —
- Monthly P&I
- —
- Monthly cashflow
- —
- DSCR
- —
- Eligible?
- —
Personal DTI + credit; lowest rate.
DSCR
20% down · 8.5% · 30yr
- Down + closing
- —
- Monthly P&I
- —
- Monthly cashflow
- —
- DSCR
- —
- Eligible?
- —
No personal income docs; deal must DSCR.
Hard money
10% down · 12.0% · 12mo
- Down + closing
- —
- Monthly P&I
- —
- Monthly cashflow
- —
- DSCR
- —
- Eligible?
- —
Short-term bridge; refi at stabilization.
Rent comps 1 comps
| Address | Beds | Baths | Sqft | Rent | $/sqft | DOM | Units | Dist |
|---|---|---|---|---|---|---|---|---|
| 220 Armstrong St Houston, TX | 5.0 | 2.0 | 1900 | $2,000 | $1.05 | 43d | 1 | 0.53mi |
Listing history 34 events
-
2026-06-18days on market $399,000 Active 111 DOM
-
2026-06-17days on market $399,000 Active 110 DOM
-
2026-06-16days on market $399,000 Active 109 DOM
-
2026-06-15days on market $399,000 Active 108 DOM
-
2026-06-13days on market $399,000 Active 106 DOM
-
2026-06-13days on market $399,000 Active 105 DOM
-
2026-06-09days on market $399,000 Active 102 DOM
-
2026-06-08days on market $399,000 Active 101 DOM
-
2026-06-07days on market $399,000 Active 100 DOM
-
2026-06-04days on market $399,000 Active 97 DOM
-
2026-06-03days on market $399,000 Active 96 DOM
-
2026-06-02days on market $399,000 Active 95 DOM
-
2026-06-01days on market $399,000 Active 94 DOM
-
2026-05-31days on market $399,000 Active 93 DOM
-
2026-02-27$399,000 Active 934-char remark
Show marketing remark (934 chars)
Prime investment opportunity in a vibrant Houston location, just minutes from downtown and within a short stroll to a nearby park. This thoughtfully designed duplex combines modern aesthetics with practical functionality, featuring soaring 10-foot ceilings, quartz countertops, soft-close kitchen drawers, and fully tiled baths from tub to ceiling. All-electric systems, individual driveways, gutters, and separate utilities reduce upkeep while maximizing rental appeal. Each unit offers a bright, open layout and high-quality finishes, attracting a wide tenant pool. The property’s turnkey condition ensures a smooth transition for investors seeking immediate income. Positioned in a strategic urban neighborhood, this duplex blends contemporary design, comfort, and long-term profitability, making it an exceptional choice for those looking to secure a stable, income-generating asset in Houston’s growing rental market.
-
2025-07-08soldstatus
-
2025-05-23historical $1,800
-
2025-05-01$1,800
-
2025-02-20historical $1,800
-
2025-01-15$1,800
-
2025-01-03soldstatus
-
2025-01-02soldstatus Sold 953-char remark
Show marketing remark (953 chars)
Exceptional Investment Opportunity: Brand New Duplex, Ideal for Discerning Investors/Owners! Stunning, Purposefully designed to meet the exacting demands of the savvy investor. Crafted with meticulous attention to detail and built to the highest industry standards, this property promises not only an exceptional living space but also a highly lucrative investment opportunity. 10ft walls, quartz countertop, kitchen drawers soft close. Tile from Tub to ceiling. Key Features: 1.Prime Location. 2.Contemporary Design. 3.Thoughtful Layout. 4.Quality Craftsmanship. 5.Investment Potential. 6.Turnkey Investment. No gas, All electric; Gutters; Individual, Driveways, and utilities. This duplex presents a turnkey investment opportunity. You can expect minimal upfront maintenance costs and a smooth transition into the rental market. Don't miss out on this rare chance to secure a lucrative investment property that effortlessly combines modern aesthetics.
-
2024-12-04status Pending 953-char remark
Show marketing remark (953 chars)
Exceptional Investment Opportunity: Brand New Duplex, Ideal for Discerning Investors/Owners! Stunning, Purposefully designed to meet the exacting demands of the savvy investor. Crafted with meticulous attention to detail and built to the highest industry standards, this property promises not only an exceptional living space but also a highly lucrative investment opportunity. 10ft walls, quartz countertop, kitchen drawers soft close. Tile from Tub to ceiling. Key Features: 1.Prime Location. 2.Contemporary Design. 3.Thoughtful Layout. 4.Quality Craftsmanship. 5.Investment Potential. 6.Turnkey Investment. No gas, All electric; Gutters; Individual, Driveways, and utilities. This duplex presents a turnkey investment opportunity. You can expect minimal upfront maintenance costs and a smooth transition into the rental market. Don't miss out on this rare chance to secure a lucrative investment property that effortlessly combines modern aesthetics.
-
2024-11-21price $389,900 953-char remark
Show marketing remark (953 chars)
Exceptional Investment Opportunity: Brand New Duplex, Ideal for Discerning Investors/Owners! Stunning, Purposefully designed to meet the exacting demands of the savvy investor. Crafted with meticulous attention to detail and built to the highest industry standards, this property promises not only an exceptional living space but also a highly lucrative investment opportunity. 10ft walls, quartz countertop, kitchen drawers soft close. Tile from Tub to ceiling. Key Features: 1.Prime Location. 2.Contemporary Design. 3.Thoughtful Layout. 4.Quality Craftsmanship. 5.Investment Potential. 6.Turnkey Investment. No gas, All electric; Gutters; Individual, Driveways, and utilities. This duplex presents a turnkey investment opportunity. You can expect minimal upfront maintenance costs and a smooth transition into the rental market. Don't miss out on this rare chance to secure a lucrative investment property that effortlessly combines modern aesthetics.
-
2024-11-02$400,000 Active 953-char remark
Show marketing remark (953 chars)
Exceptional Investment Opportunity: Brand New Duplex, Ideal for Discerning Investors/Owners! Stunning, Purposefully designed to meet the exacting demands of the savvy investor. Crafted with meticulous attention to detail and built to the highest industry standards, this property promises not only an exceptional living space but also a highly lucrative investment opportunity. 10ft walls, quartz countertop, kitchen drawers soft close. Tile from Tub to ceiling. Key Features: 1.Prime Location. 2.Contemporary Design. 3.Thoughtful Layout. 4.Quality Craftsmanship. 5.Investment Potential. 6.Turnkey Investment. No gas, All electric; Gutters; Individual, Driveways, and utilities. This duplex presents a turnkey investment opportunity. You can expect minimal upfront maintenance costs and a smooth transition into the rental market. Don't miss out on this rare chance to secure a lucrative investment property that effortlessly combines modern aesthetics.
-
2024-10-23historical
-
2024-10-03$395,500 Active
-
2023-12-14soldstatus
-
2023-12-13soldstatus Sold
-
2023-11-17status Pending
-
2023-07-20$65,000 Active
-
2020-08-07soldstatus
-
2018-03-29soldstatus
-
1988-01-02soldstatus
ⓘ Source: listings_history table (triggers on properties + properties_extension) + one-shot
backfill from property_details.listing_events for pre-trigger history.
Tax reassessment forecast TX · Resets to sale price
- Current annual tax
- $8,240 · $687/mo
- Projected year-2 tax
- $8,240 · $687/mo
- Expected delta
- $0/yr ($0/mo · 0.0%)
ⓘ Screening estimate from a state-policy table — verify with the county assessor before closing.
Climate risk First Street
- Flood 4/10 Moderate FEMA zone X (unshaded) · 20% chance over 30 yrs
- Wildfire 3/10 Moderate
- Heat 9/10 Extreme 7 d/yr ≥109°F today · 22 d/yr by 30 yrs out
- Wind 9/10 Extreme 99% chance of damaging wind over 30 yrs
- Air quality 2/10 Low 2 unhealthy d/yr today · 2 by 30 yrs out
Nearby sold comps map
Loading sold comps map…
Walkable amenities ~0.75 mi
Loading nearby amenities…
Taxation est. · year 1
- Rental income
- $38,580
- − Mortgage interest
- −$22,350
- − Property taxes
- −$8,240
- − Insurance
- −$1,995
- − Repairs & maintenance
- −$3,086
- − Management
- −$3,086
- − Depreciation
- −$11,607
- Taxable loss
- −$11,785
- Est. tax savings @ 24.0%
- +$2,828
- After-tax cash flow
- $-2,037/yr
For passive investors: Depreciation is non-cash, so a rental often shows a tax loss while cash-flowing — sheltering income. Rental losses are passive: they offset passive income freely, and up to $25,000/yr can offset ordinary (W-2) income if you actively participate and your MAGI is under $100k (phasing out to $0 by $150k); unused losses carry forward. On sale, claimed depreciation is recaptured at up to 25%, and gains may owe capital-gains tax (a 1031 exchange can defer both). Figures are a year-1 estimate at your 24.0% rate — not tax advice; consult a CPA.
Schools (NCES district)
- District
- Galena Park ISD
- NCES district ID
- 4820250
- Math proficiency
- 32% ▼ -20.00%
- Reading proficiency
- 33% ▼ -7.00%
- Median HH income
- $43,158
- Composite
- 27.62/100
- National rank
- #6927
- State rank
- #578 of 826 in TX
Livability — Houston
- Score
- 74/100
- State rank
- #184
- US rank
- #4771
Category grades
Schools grade is shown separately in the Schools card above.
Census & demographics
- Census place
- Houston, TX
- County
- Harris County · 4,702,590 people
- City population
- 3,226,434
- Metro
- Houston-The Woodlands-Sugar Land, TX
- Population (ZIP)
- 16,154
- Household income
- $48,279
- Rent vs Own
- Severe rent burden
- 457.0
Population outlook (Harris County) Hauer SSP2
- Today (2025)
- 5,571,493 people
- By 2030
- 6,089,821 · +9.3%
- By 2040
- 7,142,806 · +28.2%
- By 2050
- 8,185,864 · +46.9%
- By 2075
- 10,574,329 · +89.8%
- By 2100
- 12,109,958 · +117.4%
Race, ethnicity, and origin ACS 2023
- Neighborhood character
- Predominantly Hispanic (72%)
- Race & ethnicity
- Hispanic / Latino 72% Two or more races 32% Black 22% White 5%
- Hispanic origin (detail)
- Mexican 66%
- Foreign-born
- 31% · Canada
- Languages at home
- 39% English-only · Spanish 61%
Political lean MEDSL · Harris
- 2024 margin
- Lean D (+5.5) · D 52.0% · R 46.4% · Other 1.6%
- 2008→2024 swing
- +3.9pp toward D · 2008: 1.6pp · 2024: 5.5pp
- All cycles
- 2024: D+5.5 2020: D+13.3 2016: D+12.4 2012: D+0.1 2008: D+1.6
Not yet ingested
- Civics
- —
Market trends
- HPI YoY
- ▲ 18.53%
- Current HPI
- 276.1811
- Rent YoY
- —
- Metro
- Houston-The Woodlands-Sugar Land, TX
- State GDP YoY
- ▲ 3.95%
- F500 in state
- 110
Industry mix (Fortune 500 HQ in TX)
| Industry | F500 HQs | Revenue |
|---|---|---|
| Energy | 16 | $1,198B |
|
||
| Technology | 5 | $198B |
|
||
| Engineering / Construction | 4 | $72B |
|
||
| Energy Services | 3 | $60B |
|
||
| Utilities | 3 | $41B |
|
||
| Healthcare | 2 | $330B |
|
||
Price history
+513.8% since first listed20 events — show timeline
- 2026-02-27 Listed $399,000 HARMLS
- 2025-07-08 Sold (Public Records) — Public Records
- 2025-05-23 Rental Removed $1,800 RenterWarehouse
- 2025-05-01 Listed for Rent $1,800 RenterWarehouse
- 2025-02-20 Rental Removed $1,800 HARMLS
- 2025-01-15 Listed for Rent $1,800 HARMLS
- 2025-01-03 Sold (Public Records) — Public Records
- 2025-01-02 Sold (MLS) — HARMLS
- 2024-12-04 Pending — HARMLS
- 2024-11-21 Price Changed $389,900 HARMLS
- 2024-11-02 Listed $400,000 HARMLS
- 2024-10-23 Listing Removed — HARMLS
- 2024-10-03 Listed $395,500 HARMLS
- 2023-12-14 Sold (Public Records) — Public Records
- 2023-12-13 Sold (MLS) — HARMLS
- 2023-11-17 Pending — HARMLS
- 2023-07-20 Listed $65,000 HARMLS
- 2020-08-07 Sold (Public Records) — Public Records
- 2018-03-29 Sold (Public Records) — Public Records
- 1988-01-02 Sold (Public Records) — Public Records
Property tax history
+19.9%/yrLatest (2025): $8,240 · +1336.0% YoY. Source: county tax records.
Cash-flow waterfall
monthlySold comps — $/sqft
last 12 mo · ≤1 miLoading sold comps…