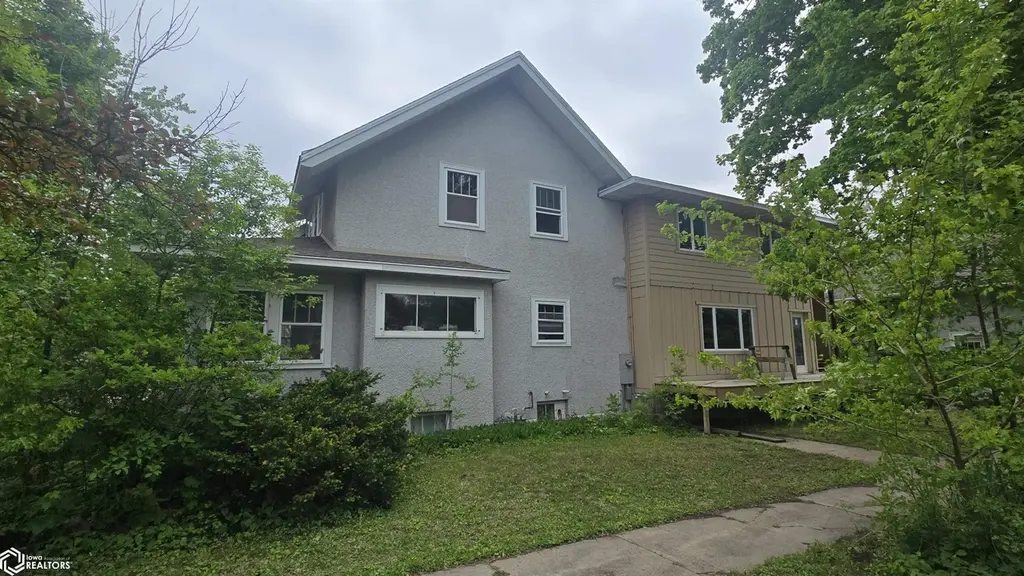
506 S 6th St · Forest City, IA
Flood risk 1/10 · Minimal
- FEMA flood zone
- X (unshaded)
- Chance of flooding over 30 yrs
- 0.0%
- Est. flood insurance / yr
- $473 – $860
Fire risk 2/10 · Minimal
- Est. fire insurance / yr
- $902 – $1,676
Heat risk 2/10 · Minimal
- Hot days now (above 100°F)
- 7 days/yr
- Hot days in 30 yrs
- 16 days/yr
Wind risk 2/10 · Minimal
- Chance of severe wind over 30 yrs
- —
Air-quality risk 1/10 · Minimal
- Unhealthy air days now
- 0 days/yr
- Unhealthy air days in 30 yrs
- 0 days/yr
Risk factors via First Street. Map © Google.
Why this score? — see what drove the B grade
The composite is a weighted blend of 9 inputs, each scored 0–100. Each bar is that input's sub-score; the figure is the points it added to the 100-point composite (weight × sub-score).
- Cash flow +30.0/30.0
- 1% rule +10.0/10.0
- DSCR +10.0/10.0
- ARV discount +7.5/15.0
- Schools +6.1/10.0
- Livability +3.9/5.0
- Rent growth +2.5/5.0
- Condition / age +2.5/5.0
- Appreciation +0.0/10.0
$80,000
🖨 Deal sheet 📄 Offer letter ✓ Due diligence
Listing remarks
Endless Possibilities Await! This spacious canvas is ready for your creative vision! Positioned for 7 bedrooms and 3.5 baths, this home has been gutted and is primed for a full renovation. Key updates include some pex plumbing and partial rewiring already completed. Imagine the potential as you transform this diamond in the rough into a stunning residence that reflects your unique style. Plus, enjoy the added bonus of a detached garage with a full loft. Don’t miss this opportunity to create your ideal home. Bring your ideas and inspiration—this is truly a project where the possibilities are LIMITLESS!
Key facts
- Full loft
- Pex plumbing
- Partial rewiring
Tags
Property features AI
Finance
- Other: Annual tax information available
Exterior
- Parking: Detached 1-car garage
- Utilities: Public water; Public sewer
- Home design: Two levels; Single-family residence; Residential property
- Construction: HardiPlank and stucco exterior
- Exterior features: Lot approximately 0.2 acres (66 x 132); Located in FC ORIGINAL TOWN; center of town location
Interior
- Bathrooms: 3 full bathrooms; 1 half bathroom
- Heating & cooling: Central air conditioning; Forced air heating
- Interior features: Basement
Neighborhood map
What this means for you Summary
Snapshot
- This is a 7-bed/1.0-bath single-family listed at $80k.
Deal economics
- At list price, monthly cash flow is $568 ($7k/yr) — positive.
- The deal already cash-flows at list — no discount required.
- Meets the 1% rule at list price ($1k rent vs $80k).
- Cap rate 14.8% vs local median 4.1% in Forest City — top-decile yield for the area; either an underpriced asset or a hidden risk that comps aren't pricing in. Stress-test before assuming the spread holds.
Location & tenants
- Location reads 77/100 on livability (#160 in IA, #2,902 nationally) — a middle-class / working-renter tenant base. Strengths: cost of living A+, health & safety A+, housing A; Watch: employment C-, amenities F, commute F.
- Forest City Community School District (town): math 67% / reading 78% proficiency, ranked #111 of 289 in IA (top 38%) — strong family-tenant draw, lease renewals of 3-5y typical.
- Market conditions: 45 active listings in the ZIP; 6 units permitted in Winnebago County in 2024 (0 in 5+ unit buildings).
Forward outlook
- Local home prices are declining (-3.0%/yr); year-one equity from $553 of loan paydown is wiped out by about $2k of value loss. Plan a longer hold.
- Winnebago County population projected at -10% by 2050 — secular population decline; favor cash flow + early exit over multi-decade hold.
- At projected returns (-3.0% appreciation + 3.0% rent growth), your $22k cash investment doubles in ~4 years — after that, you're playing with house money.
Negotiation context
- Only 14 days on market — expect competitive offers; lowballing is unlikely to land.
- Current owner paid $23k; list at $80k implies a 248% gain — meaningful room to come down on a strong offer.
Risks & watch-outs
- Watch-outs: built in 1908 — expect roof / HVAC / electrical / plumbing capex.
Questions for the listing agent
- Built in 1908 — when were the roof, HVAC, electrical panel, plumbing, and water heater last replaced?
- Is there a deadline driving the sale (1031 exchange, divorce, estate, relocation)? That informs how much negotiation room exists.
- Schools are B-rated — typically a magnet for longer-tenancy family renters. What's the average tenant stay here, and is there a school-zone premium baked into asking?
- What's the average days-on-market for RENTAL listings here right now (not sales)? A rising rental-DOM trend means longer vacancies and softer asking-rent achievability than the comps imply.
- What's the recent tenant-quality profile in this submarket — average credit score on applications, eviction rate, late-payment / NSF rate, and stable-employment percentage? A property-management company in the area should have these aggregated.
- How much new for-sale + rental construction is in the pipeline within 1–3 miles? Heavy new supply typically softens prices + rents 12–24 months out; constrained supply supports both.
Investment metrics
- 1% rule
- 1.69% ✓
- Cap rate
- 14.81%
- Cash-on-cash
- 30.43%
- DSCR
- 2.35
- GRM
- 4.9
CMA / ARV
No comps found within radius.
Projected returns pro-forma
-3.0% appreciation · 3.0% rent growth · sell at horizon
- IRR
- 25.1%
- Equity multiple
- 2.04×
- Total profit
- $23,204
- Equity at exit
- $11,928
- IRR
- 32.8%
- Equity multiple
- 3.98×
- Total profit
- $66,742
- Equity at exit
- $6,917
Cash invested: $22,400 (down + closing). Projections, not guarantees.
Landlord ↔ Tenant lean methodology
- Overall (STATE)
- 83 Strongly Landlord-Friendly
- State Iowa
- 83 Strongly Landlord-Friendly · R+6
- County
- — inherits STATE
- City
- — inherits STATE
ZIP-level market 50436
- Home prices YoY
- -25.3%
- Active inventory
- 45
- Price-to-rent
- 4.9×
Monthly cashflow live
- Estimated rent
- $1,351 medium interval (Pro) →
- Mortgage (P&I)
- −$420
- Tax from tax record
- −$46 /mo · $556/yr
- Insurance
- −$33
- HOA
- −$0
- Vacancy / Maint / Mgmt
- −$284
- Net cashflow
- $568
Break-even live
UW: 25.0% down · 7.5% · 30yr · 1.5% tax · 5.0% vac · 8.0% maint · 8.0% mgmt
Financing live
Cash to close
- Down payment
- $20,000
- Closing costs
- $2,400
- Reserves months
- —
- Total cash needed
- —
Loan-product check · same deal, 3 products live
Conventional
25% down · 7.5% · 30yr
- Down + closing
- —
- Monthly P&I
- —
- Monthly cashflow
- —
- DSCR
- —
- Eligible?
- —
Personal DTI + credit; lowest rate.
DSCR
20% down · 8.5% · 30yr
- Down + closing
- —
- Monthly P&I
- —
- Monthly cashflow
- —
- DSCR
- —
- Eligible?
- —
No personal income docs; deal must DSCR.
Hard money
10% down · 12.0% · 12mo
- Down + closing
- —
- Monthly P&I
- —
- Monthly cashflow
- —
- DSCR
- —
- Eligible?
- —
Short-term bridge; refi at stabilization.
Listing history 11 events
-
2026-06-18days on market $80,000 Active 14 DOM
-
2026-06-17days on market $80,000 Active 13 DOM
-
2026-06-16days on market $80,000 Active 12 DOM
-
2026-06-15days on market $80,000 Active 11 DOM
-
2026-06-13days on market $80,000 Active 9 DOM
-
2026-06-12days on market $80,000 Active 8 DOM
-
2026-06-09days on market $80,000 Active 5 DOM
-
2026-06-08days on market $80,000 Active 4 DOM
-
2026-06-07days on market $80,000 Active 3 DOM
-
2026-06-07remarks 608-char remark
-
2026-06-07$80,000 Active 2 DOM
ⓘ Source: listings_history table (triggers on properties + properties_extension) + one-shot
backfill from property_details.listing_events for pre-trigger history.
Tax reassessment forecast IA · Partial reset (capped growth)
- Current annual tax
- $556 · $46/mo
- Projected year-2 tax
- $906 · $76/mo
- Expected delta
- +$350/yr (+$29/mo · 62.9%)
ⓘ Screening estimate from a state-policy table — verify with the county assessor before closing.
Climate risk First Street
- Flood 1/10 Low FEMA zone X (unshaded) · 0% chance over 30 yrs
- Wildfire 2/10 Low
- Heat 2/10 Low 7 d/yr ≥100°F today · 16 d/yr by 30 yrs out
- Wind 2/10 Low
- Air quality 1/10 Low 0 unhealthy d/yr today · 0 by 30 yrs out
Nearby sold comps map
Loading sold comps map…
Walkable amenities ~0.75 mi
Loading nearby amenities…
Taxation est. · year 1
- Rental income
- $16,212
- − Mortgage interest
- −$4,481
- − Property taxes
- −$556
- − Insurance
- −$400
- − Repairs & maintenance
- −$1,297
- − Management
- −$1,297
- − Depreciation
- −$2,327
- Taxable income
- $5,853
- Est. tax owed @ 24.0%
- −$1,405
- After-tax cash flow
- $5,412/yr
For passive investors: Depreciation is non-cash, so a rental often shows a tax loss while cash-flowing — sheltering income. Rental losses are passive: they offset passive income freely, and up to $25,000/yr can offset ordinary (W-2) income if you actively participate and your MAGI is under $100k (phasing out to $0 by $150k); unused losses carry forward. On sale, claimed depreciation is recaptured at up to 25%, and gains may owe capital-gains tax (a 1031 exchange can defer both). Figures are a year-1 estimate at your 24.0% rate — not tax advice; consult a CPA.
Schools (NCES district)
- District
- Forest City Community School District
- NCES district ID
- 1911790
- Math proficiency
- 67% ▼ -10.00%
- Reading proficiency
- 78% ▲ 1.00%
- Median HH income
- $46,674
- Composite
- 61.08/100
- National rank
- #789
- State rank
- #111 of 289 in IA
Livability — Forest City
- Score
- 77/100
- State rank
- #160
- US rank
- #2902
Category grades
Schools grade is shown separately in the Schools card above.
Census & demographics
- Census place
- Forest City, IA
- Population (ZIP)
- 5,760
Population outlook (Winnebago County) Hauer SSP2
- Today (2025)
- 10,099 people
- By 2030
- 9,831 · -2.7%
- By 2040
- 9,326 · -7.7%
- By 2050
- 9,073 · -10.2%
- By 2075
- 9,448 · -6.4%
- By 2100
- 10,279 · +1.8%
Race, ethnicity, and origin ACS 2023
- Neighborhood character
- Predominantly White (88%)
- Race & ethnicity
- White 88% Asian 6% Hispanic / Latino 4% Two or more races 2%
- Common ancestry
- Portuguese 21% Romanian 2% Iranian 1%
- Foreign-born
- 5% · China, Canada, Vietnam
- Languages at home
- 92% English-only · Tagalog/Filipino 2% Spanish 2% Other Indo-European 1%
Political lean MEDSL · Winnebago
- 2024 margin
- Solid R (+30.7) · D 33.9% · R 64.6% · Other 1.5%
- 2008→2024 swing
- -39.3pp toward R · 2008: 8.6pp · 2024: -30.7pp
- All cycles
- 2024: R+30.7 2020: R+26.3 2016: R+26.5 2012: R+0.0 2008: D+8.6
Not yet ingested
- Civics
- —
Market trends
- HPI YoY
- ▼ -63.62%
- Current HPI
- 187.8639
- Rent YoY
- —
- Metro
- —
- State GDP YoY
- ▲ 2.48%
- F500 in state
- 4
Industry mix (Fortune 500 HQ in IA)
| Industry | F500 HQs | Revenue |
|---|---|---|
| Financial Services | 1 | $16B |
|
||
| Retail / Convenience | 1 | $15B |
|
||
Price history
+384.8% since first listed3 events — show timeline
- 2026-06-04 Listed $80,000 IAR
- 2022-07-06 Sold (Public Records) $23,000 Public Records
- 2012-11-21 Sold (Public Records) $16,500 Public Records
Property tax history
+5.0%/yrLatest (2025): $556 · +4.5% YoY. Source: county tax records.
Cash-flow waterfall
monthlySold comps — $/sqft
last 12 mo · ≤1 miLoading sold comps…