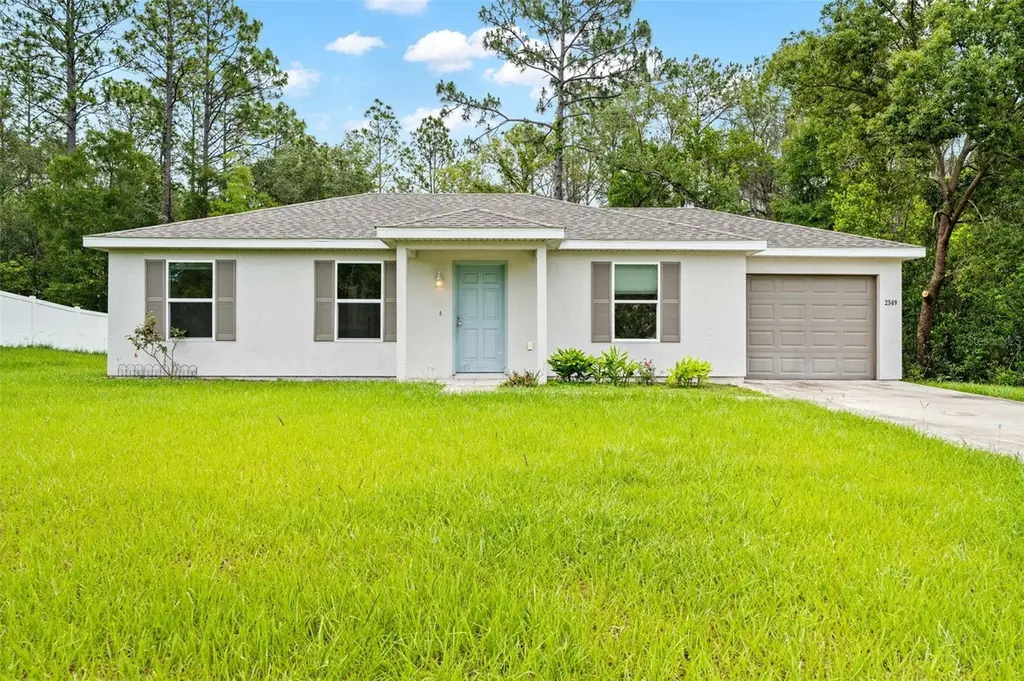
2549 W Castania Dr · Citrus Springs, FL
Flood risk 6/10 · Moderate
- FEMA flood zone
- X (unshaded)
- Chance of flooding over 30 yrs
- 0.68%
- Est. flood insurance / yr
- $507 – $1,088
Fire risk 4/10 · Minor
- Est. fire insurance / yr
- $947 – $1,759
Heat risk 9/10 · Severe
- Hot days now (above 107°F)
- 7 days/yr
- Hot days in 30 yrs
- 22 days/yr
Wind risk 9/10 · Severe
- Chance of severe wind over 30 yrs
- 99.0%
Air-quality risk 2/10 · Minimal
- Unhealthy air days now
- 0 days/yr
- Unhealthy air days in 30 yrs
- 1 days/yr
Risk factors via First Street. Map © Google.
Why this score? — see what drove the F grade
The composite is a weighted blend of 9 inputs, each scored 0–100. Each bar is that input's sub-score; the figure is the points it added to the 100-point composite (weight × sub-score).
- Cash flow +12.9/30.0
- Schools +4.1/10.0
- DSCR +3.9/10.0
- 1% rule +3.5/10.0
- Livability +3.4/5.0
- Rent growth +2.5/5.0
- Condition / age +2.5/5.0
- ARV discount +1.1/15.0
- Appreciation +0.1/10.0
$204,900
🖨 Deal sheet (PDF) 📄 Offer letter ✓ Due diligence
Listing remarks
Welcome to your fresh and inviting home in Citrus Springs, built in 2020 and beautifully maintained. This charming residence offers 3 spacious bedrooms and 2 bathrooms, featuring brand-new luxury vinyl plank (LVP) flooring throughout and freshly painted walls, creating a modern and clean atmosphere. Enjoy the convenience of walking just minutes to Wesley Jones Park, perfect for outdoor activities and relaxation. Nature lovers and adventurers will appreciate the close proximity to several beautiful destinations: Discover the crystal-clear waters at Rainbow Springs State Park, embark on scenic biking trips along the Withlacoochee Trail, explore the stunning Three Sisters Springs, and unwind a
Key facts
- 7,500 sq ft lot
- Garage
- Built 2020
Tags
Property features AI
Exterior
- Parking: Attached garage; Garage with 1 space; Driveway; Concrete surfaces
- Utilities: Public water; Public sewer
- Home design: Single-family residence; One-story; Residential property
- Construction: Block and concrete construction; Block foundation; Asphalt shingle roof; Built as a single-level structure
- Exterior features: Cleared lot; Private road frontage; Private road maintained by owner(s); No pool
Interior
- Kitchen: Electric oven; Electric range
- Flooring: Vinyl
- Bathrooms: 2 full bathrooms
- Heating & cooling: Heat pump; Central air
- Interior features: Electric oven; Electric range; Vinyl flooring; Central air conditioning; Heat pump heating
Neighborhood map
What this means for you Summary
Snapshot
- This is a 3-bed/2.0-bath single-family listed at $205k.
Deal economics
- At list price, monthly cash flow is $-15 ($-175/yr) — negative.
- To cash-flow at today's rent, offer at most $202k (1.3% below list).
- To meet the 1% rule (rent ≥ 1% of price), the offer needs to be $174k (15.1% below list).
- Recommended offer: $174k (15.1% below list) — sets the bar for 1% rule.
- Cap rate 6.2% vs local median 5.1% in Citrus Springs — meaningfully above typical; check what's discounted (condition, days-on-market, listing class) to confirm the premium yield is real.
Location & tenants
- Location reads 68/100 on livability (#521 in FL) — a middle-class / working-renter tenant base. Strengths: cost of living A+, housing A+; Watch: health & safety C-, employment D+, amenities F.
- Citrus (rural): math 49% / reading 50% proficiency, ranked #44 of 73 in FL (top 60%) — families likely to look elsewhere, expect single-tenant / working-renter base with shorter leases.
- Zoned schools: Citrus Springs Elementary School (math 52% / reading 48%, grade D+, #1,070 of 2,144 statewide, top 51%, 817 students, 71% FRL); Citrus Springs Middle School (math 55% / reading 54%, grade B-, #183 of 571 statewide, top 34%, 821 students, 59% FRL); Crystal River High School (math 31% / reading 44%, grade F, #336 of 667 statewide, top 51%, 1,249 students, 56% FRL) — zoned schools at 62% FRL track the district average.
- Market conditions: 1247 active listings in the ZIP; 19 comparable units currently listed for rent nearby; rentals at typical pace (median 23d on market — plan ~3-4 weeks tenant-placement turnaround); 2,443 units permitted in Citrus County in 2024 (0 in 5+ unit buildings).
- This rent runs 30% of the median local income ($69k/yr) — at the standard rent-burdened threshold; future hikes will face affordability resistance.
Forward outlook
- Local home prices are declining (-3.0%/yr); year-one equity from $1k of loan paydown is wiped out by about $6k of value loss. Plan a longer hold.
- Citrus County population projected to shrink 10% by 2050 — rents likely to lag national; underwrite the cash flow, not the appreciation.
Negotiation context
- Only 9 days on market — expect competitive offers; lowballing is unlikely to land.
- Current owner paid $55k; list at $205k implies a 273% gain — meaningful room to come down on a strong offer.
Risks & watch-outs
- Climate carrying-cost: major flood risk; severe wind risk, 99% chance of damaging wind over 30y; extreme-heat days projected 7→22/yr by 2055 (HVAC capex compounding) — expect insurance premiums to compound above CPI over the hold.
Questions for the listing agent
- What do current leases actually rent for vs. the listed asking? Can we see a recent rent roll and the last 12 months of T-12 income?
- What does the HOA fee cover, when was the last increase, and are there any pending special assessments or reserve-fund shortfalls?
- Is there a deadline driving the sale (1031 exchange, divorce, estate, relocation)? That informs how much negotiation room exists.
- The area grade is low — what's the realistic commute time and amenity access for the typical tenant pool here? Any planned neighborhood developments (good or bad) we should know about?
- What's the average days-on-market for RENTAL listings here right now (not sales)? A rising rental-DOM trend means longer vacancies and softer asking-rent achievability than the comps imply.
- What's the recent tenant-quality profile in this submarket — average credit score on applications, eviction rate, late-payment / NSF rate, and stable-employment percentage? A property-management company in the area should have these aggregated.
- How much new for-sale + rental construction is in the pipeline within 1–3 miles? Heavy new supply typically softens prices + rents 12–24 months out; constrained supply supports both.
Investment metrics
- 1% rule
- 0.85% ✗
- Cap rate
- 6.21%
- Cash-on-cash
- -0.31%
- DSCR
- 0.99
- GRM
- 9.8
CMA / ARV
- ARV (on-the-fly)
- $179,478
- Comps found
- 12
Show comp detail 12 sales within ~0.75 mi
| Address | Dist | Beds/Ba | Sqft | Sold | Price | $/sf | Match |
|---|---|---|---|---|---|---|---|
| 2494 W Eric Dr | 0.13mi | 2/2.0 (-1) | 1,017 (+0%) | 5mo | $186,500 | $183 | 84 |
| 2271 W Gardenia Dr | 0.41mi | 2/2.0 (-1) | 1,025 (+1%) | 9mo | $170,000 | $166 | 67 |
| 2224 W Greenway Pl | 0.35mi | 2/1.5 (-1) | 1,020 (+1%) | 12mo | $194,000 | $190 | 66 |
| 9376 N Citrus Springs Blvd | 0.46mi | 2/2.0 (-1) | 1,110 (+10%) | 2mo | $199,000 | $179 | 57 |
| 2090 W Argus Pl | 0.51mi | 2/2.0 (-1) | 945 (-7%) | 6mo | $167,000 | $177 | 55 |
| 9355 N Elliot Way | 0.67mi | 3/1.0 | 1,036 (+2%) | 7mo | $170,000 | $164 | 55 |
| 9020 N Arcadia Way | 0.62mi | 3/2.0 | 1,104 (+9%) | 8mo | $195,000 | $177 | 49 |
| 2155 W Devon | 0.43mi | 2/1.0 (-1) | 864 (-15%) | 3mo | $165,000 | $191 | 44 |
| 2024 W Gardenia Dr | 0.59mi | 2/1.0 (-1) | 939 (-7%) | 13mo | $165,000 | $176 | 40 |
| 1817 W Gardenia Dr | 0.74mi | 3/1.5 | 880 (-13%) | 8mo | $145,000 | $165 | 35 |
| 1872 W Freeman Pl | 0.71mi | 2/1.0 (-1) | 902 (-11%) | 9mo | $147,500 | $164 | 32 |
| 1882 W Gardenia Dr | 0.70mi | 2/1.0 (-1) | 894 (-12%) | 10mo | $160,000 | $179 | 30 |
Match score weights: distance 35% · size 25% · config 20% · recency 20%. Top-matched comps best support the ARV.
Projected returns pro-forma
-3.0% appreciation · 3.0% rent growth · sell at horizon
- IRR
- -16.8%
- Equity multiple
- 0.41×
- Total profit
- $-34,123
- Equity at exit
- $30,551
- IRR
- -8.6%
- Equity multiple
- 0.46×
- Total profit
- $-30,872
- Equity at exit
- $17,716
Cash invested: $57,372 (down + closing). Projections, not guarantees.
Landlord ↔ Tenant lean methodology
- Overall (STATE)
- 87 Strongly Landlord-Friendly
- State Florida
- 87 Strongly Landlord-Friendly · R+3
- County
- — inherits STATE
- City
- — inherits STATE
ZIP-level market 34434
- Home prices YoY
- -2.9%
- Active inventory
- 1247
- Price-to-rent
- 9.8×
Monthly cashflow live
- Estimated rent
- $1,740 high interval (Pro) →
- Mortgage (P&I)
- −$1,075
- Tax from tax record
- −$228 /mo · $2,731/yr
- Insurance
- −$85
- HOA
- −$2
- Vacancy / Maint / Mgmt
- −$365
- Net cashflow
- $-15
Break-even live
Sensitivity live
| Price | -10% $101 | -5% $43 | +0% $-15 | +5% $-73 | +10% $-131 |
|---|---|---|---|---|---|
| Rent | -10% $-152 | -5% $-83 | +0% $-15 | +5% $54 | +10% $123 |
| Rate | -1.0pp $89 | -0.5pp $38 | base $-15 | +0.5pp $-68 | +1.0pp $-122 |
UW: 25.0% down · 7.5% · 30yr · 1.5% tax · 5.0% vac · 8.0% maint · 8.0% mgmt
Financing live
Cash to close
- Down payment
- $51,225
- Closing costs
- $6,147
- Reserves months
- —
- Total cash needed
- —
Loan-product check · same deal, 3 products live
Conventional
25% down · 7.5% · 30yr
- Down + closing
- —
- Monthly P&I
- —
- Monthly cashflow
- —
- DSCR
- —
- Eligible?
- —
Personal DTI + credit; lowest rate.
DSCR
20% down · 8.5% · 30yr
- Down + closing
- —
- Monthly P&I
- —
- Monthly cashflow
- —
- DSCR
- —
- Eligible?
- —
No personal income docs; deal must DSCR.
Hard money
10% down · 12.0% · 12mo
- Down + closing
- —
- Monthly P&I
- —
- Monthly cashflow
- —
- DSCR
- —
- Eligible?
- —
Short-term bridge; refi at stabilization.
Rent comps 19 comps
| Address | Beds | Baths | Sqft | Rent | $/sqft | DOM | Units | Dist |
|---|---|---|---|---|---|---|---|---|
| 9305 N Citrus Springs Blvd Citrus Springs, FL | 3.0 | 2.0 | 1411 | $1,800 | $1.28 | 23d | 1 | 0.12mi |
| 9081 N Golfview Dr Citrus Springs, FL | 3.0 | 1.5 | 1374 | $1,400 | $1.02 | 23d | 1 | 0.15mi |
| 2330 W Juan Vega Ln Dunnellon, FL | 3.0 | 2.0 | 1204 | $1,675 | $1.39 | 23d | 1 | 0.26mi |
| 9205 N Fawn Way Citrus Springs, FL | 3.0 | 2.0 | 1428 | $1,750 | $1.23 | 23d | 1 | 0.27mi |
| 2907 W Camilo Dr Citrus Springs, FL | 4.0 | 2.0 | 1449 | $1,795 | $1.24 | 23d | 1 | 0.35mi |
| 9127 N Justa Dr Citrus Springs, FL | 3.0 | 2.0 | 1453 | $1,800 | $1.24 | 23d | 1 | 0.67mi |
| 9545 N Travis Dr Unit A Citrus Springs, FL | 3.0 | 2.0 | 1000 | $1,350 | $1.35 | 23d | 1 | 1.11mi |
| 9543B N Travis Dr Unit A Citrus Springs, FL | 3.0 | 2.0 | 1000 | $1,350 | $1.35 | 23d | 1 | 1.14mi |
| 3584 W Burgandy Dr Citrus Springs, FL | 3.0 | 2.0 | 1413 | $1,699 | $1.20 | 23d | 1 | 1.19mi |
| 8715 N Paradisea Dr Citrus Springs, FL | 3.0 | 2.0 | 1403 | $1,850 | $1.32 | 23d | 1 | 1.23mi |
| 9810 N Santee Ter Dunnellon, FL | 4.0 | 2.0 | 1449 | $1,815 | $1.25 | 23d | 1 | 1.26mi |
| 9271 N Peachtree Way Unit 9271 Citrus Springs, FL | 2.0 | 2.0 | 900 | $1,300 | $1.44 | 23d | 1 | 1.34mi |
| 9337 N Mendoza Way Citrus Springs, FL | 2.0 | 2.0 | 984 | $1,275 | $1.30 | 23d | 1 | 1.37mi |
| 9298 N Mendoza Way Citrus Springs, FL | 3.0 | 2.0 | 1350 | $1,800 | $1.33 | 23d | 1 | 1.37mi |
| 9995 N Sandree Dr Citrus Springs, FL | 3.0 | 2.0 | 1453 | $1,895 | $1.30 | 23d | 1 | 1.38mi |
| 9437 N Travis Dr Citrus Springs, FL | 2.0 | 2.0 | 972 | $1,325 | $1.36 | 23d | 1 | 1.39mi |
| 1924 W Roseboro Dr Dunnellon, FL | 4.0 | 2.0 | 1449 | $1,795 | $1.24 | 23d | 1 | 1.41mi |
| 8267 N Santos Dr Citrus Springs, FL | 3.0 | 2.0 | 1453 | $1,800 | $1.24 | 23d | 1 | 1.44mi |
| 9262 N Travis Dr Citrus Springs, FL | 2.0 | 2.0 | 984 | $1,395 | $1.42 | 23d | 1 | 1.46mi |
HOA detail
- Monthly dues
- $2 · $24/yr
- Likely covers
- water
Listing history 22 events
-
2026-06-21days on market $204,900 Active 9 DOM
-
2026-06-19days on market $204,900 Active 7 DOM
-
2026-06-18days on market $204,900 Active 6 DOM
-
2026-06-17days on market $204,900 Active 5 DOM
-
2026-06-16days on market $204,900 Active 4 DOM
-
2026-06-15days on market $204,900 Active 3 DOM
-
2026-06-13remarks 699-char remark
-
2026-06-13days on market $204,900 Active 1 DOM
-
2026-05-31days on market $204,900 Active 223 DOM
-
2026-05-30days on market $204,900 Active 222 DOM
-
2026-04-13price $204,900
-
2026-03-18price $214,900
-
2025-12-01price $219,900
-
2025-11-03price $221,999
-
2025-10-20$224,999 Active
-
2019-12-18soldstatus $55,000
-
2018-07-09soldstatus $29,900
-
2005-04-08soldstatus $602,000
-
2003-10-14soldstatus $95,800
-
2003-10-01soldstatus $95,800
-
2003-03-01soldstatus $47,100
-
2003-03-01soldstatus $47,100
ⓘ Source: listings_history table (triggers on properties + properties_extension) + one-shot
backfill from property_details.listing_events for pre-trigger history.
Tax reassessment forecast FL · Resets to sale price
- Current annual tax
- $2,731 · $228/mo
- Projected year-2 tax
- $2,731 · $228/mo
- Expected delta
- $0/yr ($0/mo · 0.0%)
ⓘ Screening estimate from a state-policy table — verify with the county assessor before closing.
Climate risk First Street
- Flood 6/10 Major FEMA zone X (unshaded) · 68% chance over 30 yrs
- Wildfire 4/10 Moderate
- Heat 9/10 Extreme 7 d/yr ≥107°F today · 22 d/yr by 30 yrs out
- Wind 9/10 Extreme 99% chance of damaging wind over 30 yrs
- Air quality 2/10 Low 0 unhealthy d/yr today · 1 by 30 yrs out
Nearby sold comps map
Loading sold comps map…
Walkable amenities ~0.75 mi
Loading nearby amenities…
Taxation est. · year 1
- Rental income
- $20,884
- − Mortgage interest
- −$11,478
- − Property taxes
- −$2,731
- − Insurance
- −$1,024
- − Repairs & maintenance
- −$1,671
- − Management
- −$1,671
- − HOA
- −$24
- − Depreciation
- −$5,961
- Taxable loss
- −$3,675
- Est. tax savings @ 24.0%
- +$882
- After-tax cash flow
- $707/yr
For passive investors: Depreciation is non-cash, so a rental often shows a tax loss while cash-flowing — sheltering income. Rental losses are passive: they offset passive income freely, and up to $25,000/yr can offset ordinary (W-2) income if you actively participate and your MAGI is under $100k (phasing out to $0 by $150k); unused losses carry forward. On sale, claimed depreciation is recaptured at up to 25%, and gains may owe capital-gains tax (a 1031 exchange can defer both). Figures are a year-1 estimate at your 24.0% rate — not tax advice; consult a CPA.
Schools (NCES district)
- District
- Citrus
- NCES district ID
- 1200270
- Math proficiency
- 49% ▼ -10.00%
- Reading proficiency
- 50% ▼ -6.00%
- Median HH income
- $38,618
- Composite
- 41.28/100
- National rank
- #3519
- State rank
- #44 of 73 in FL
Livability — Citrus Springs
- Score
- 68/100
- State rank
- #521
- US rank
- #9598
Category grades
Schools grade is shown separately in the Schools card above.
Census & demographics
- Census place
- Citrus Springs, FL
- County
- Citrus County · 111,314 people
- City population
- 10,730
- Metro
- Homosassa Springs, FL
- Population (ZIP)
- 11,074
- Household income
- $68,939
- Rent vs Own
- Severe rent burden
- 171.0
Population outlook (Citrus County) Hauer SSP2
- Today (2025)
- 138,622 people
- By 2030
- 136,886 · -1.3%
- By 2040
- 132,009 · -4.8%
- By 2050
- 125,196 · -9.7%
- By 2075
- 108,570 · -21.7%
- By 2100
- 84,454 · -39.1%
Race, ethnicity, and origin ACS 2023
- Neighborhood character
- Predominantly White (78%)
- Race & ethnicity
- White 78% Two or more races 11% Hispanic / Latino 9% Black 6%
- Hispanic origin (detail)
- Mexican 3% Puerto Rican 4%
- Common ancestry
- Iranian 3% Romanian 2% Slovak 2%
- Foreign-born
- 4% · Canada
- Languages at home
- 93% English-only · Spanish 5% German/W. Germanic 1% Other Indo-European 1%
Political lean MEDSL · Citrus
- 2024 margin
- Solid R (+45.9) · D 26.8% · R 72.6%
- 2008→2024 swing
- -29.8pp toward R · 2008: -16.1pp · 2024: -45.9pp
- All cycles
- 2024: R+45.9 2020: R+41.0 2016: R+39.7 2012: R+21.9 2008: R+16.1
Not yet ingested
- Civics
- —
Market trends
- HPI YoY
- ▼ -9.70%
- Current HPI
- 328.2164
- Rent YoY
- —
- Metro
- Homosassa Springs, FL
- State GDP YoY
- ▲ 3.28%
- F500 in state
- 36
Industry mix (Fortune 500 HQ in FL)
| Industry | F500 HQs | Revenue |
|---|---|---|
| Industrial Technology | 2 | $29B |
|
||
| Insurance | 2 | $17B |
|
||
| Retail | 1 | $60B |
|
||
| Technology Distribution | 1 | $58B |
|
||
| Homebuilding | 1 | $35B |
|
||
| Technology Manufacturing | 1 | $35B |
|
||
Price history
+335.0% since first listed12 events — show timeline
- 2026-04-13 Price Changed $204,900 RACC
- 2026-03-18 Price Changed $214,900 RACC
- 2025-12-01 Price Changed $219,900 RACC
- 2025-11-03 Price Changed $221,999 RACC
- 2025-10-20 Listed $224,999 RACC
- 2019-12-18 Sold (Public Records) $55,000 Public Records
- 2018-07-09 Sold (Public Records) $29,900 Public Records
- 2005-04-08 Sold (Public Records) $602,000 Public Records
- 2003-10-14 Sold (Public Records) $95,800 Public Records
- 2003-10-01 Sold (Public Records) $95,800 Public Records
- 2003-03-01 Sold (Public Records) $47,100 Public Records
- 2003-03-01 Sold (Public Records) $47,100 Public Records
Property tax history
+44.4%/yrLatest (2025): $2,731 · +6.3% YoY. Source: county tax records.
Cash-flow waterfall
monthlySold comps — $/sqft
last 12 mo · ≤1 miLoading sold comps…