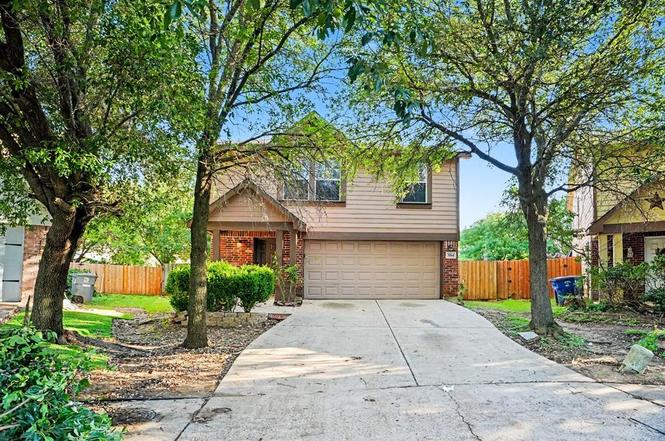
3164 Saint Dominic Cir · Dallas, TX
Flood risk 1/10 · Minimal
- FEMA flood zone
- X (unshaded)
- Chance of flooding over 30 yrs
- 0.0%
- Est. flood insurance / yr
- $507 – $1,088
Fire risk 1/10 · Minimal
- Est. fire insurance / yr
- $1,222 – $2,270
Heat risk 7/10 · Major
- Hot days now (above 109°F)
- 7 days/yr
- Hot days in 30 yrs
- 25 days/yr
Wind risk 6/10 · Moderate
- Chance of severe wind over 30 yrs
- 27.0%
Air-quality risk 3/10 · Minor
- Unhealthy air days now
- 2 days/yr
- Unhealthy air days in 30 yrs
- 3 days/yr
Risk factors via First Street. Map © Google.
Why this score? — see what drove the D grade
The composite is a weighted blend of 9 inputs, each scored 0–100. Each bar is that input's sub-score; the figure is the points it added to the 100-point composite (weight × sub-score).
- ARV discount +10.2/15.0
- Cash flow +7.7/30.0
- Appreciation +7.1/10.0
- Livability +4.0/5.0
- 1% rule +3.1/10.0
- Schools +2.8/10.0
- Rent growth +2.5/5.0
- Condition / age +2.5/5.0
- DSCR +1.8/10.0
$294,900
🖨 Deal sheet (PDF) 📄 Offer letter ✓ Due diligence
Listing remarks MLS
Beautiful 4 bedroom 2.5 Baths in the heart of Oak Cliff. Close to shopping areas and major highways, near Mountain View College, minutes from Downtown Dallas and Bishop Arts District. This home is a great size for a large family, nestled in an established neighborhood, lots of shade for those hot summer days. Huge backyard for those family gatherings, Rood was replaced January 2022. This one will not last come see for yourself!
Key facts
- Upgraded kitchen
- Granite countertops
- 8,059 sq ft lot
Tags
Property features AI
Finance
- Other: No municipal utility district
- Financial info: Listing accepts Cash, Conventional, FHA, and VA financing
- HOA & community: Mandatory homeowners association; Annual association fee (management fees included); HOA management company: Encino Hills Homeowners Association
Exterior
- Parking: Attached 2-car garage; Driveway parking; On-street parking; Asphalt and concrete surfaces; Garage door opener
- Security: No specific security features listed
- Utilities: City water; City sewer; Individual water meter; Cable available; Curbs and sidewalks present
- Home design: Single-family residence; Two-story home; Entry level: 1; Built in 2004; Property not attached
- Construction: Brick and wood construction; Shingle/composition roof; Slab foundation
- Exterior features: Front porch; Exterior lighting; Wood fencing (fenced yard); Located on a cul-de-sac
Interior
- Kitchen: Dishwasher; Refrigerator; Electric water heater
- Bedrooms: 4 bedrooms (all on the second level — primary bedroom plus three additional bedrooms)
- Flooring: Laminate flooring; Vinyl flooring
- Bathrooms: 3 total bathrooms (2 full, 1 half)
- Heating & cooling: Central heating; Central air conditioning
- Interior features: Open floorplan; Walk-in closets; One living area; One dining area; 6 total rooms
- Laundry & utility: Full-size washer/dryer area
Neighborhood map
What this means for you Summary
Snapshot
- This is a 4-bed/2.5-bath single-family listed at $295k.
Deal economics
- At list price, monthly cash flow is $-346 ($-4k/yr) — negative.
- To cash-flow at today's rent, offer at most $234k (20.8% below list).
- To meet the 1% rule (rent ≥ 1% of price), the offer needs to be $240k (18.5% below list).
- Recommended offer: $234k (20.8% below list) — sets the bar for cash-flow.
- Cap rate 4.9% vs local median 2.3% in Dallas — top-decile yield for the area; either an underpriced asset or a hidden risk that comps aren't pricing in. Stress-test before assuming the spread holds.
Location & tenants
- Location reads 81/100 on livability (#24 in TX, #1,380 nationally) — a professional / high-income tenant draw. Strengths: amenities A+, commute A+, housing A+; Watch: crime F.
- Dallas ISD (urban): math 31% / reading 36% proficiency, ranked #559 of 826 in TX (top 68%) — families likely to look elsewhere, expect single-tenant / working-renter base with shorter leases; 83% free/reduced lunch — lower-income household profile, screen leases tightly.
- Zoned schools: Jimmie Tyler Brashear El (math 28% / reading 37%, grade F, #2,234 of 4,322 statewide, top 52%, 601 students, 85% FRL); Zan Wesley Holmes Jr Middle (math 22% / reading 28%, grade F, #1,258 of 1,662 statewide, top 77%, 644 students, 96% FRL); Justin F Kimball H S (math 15% / reading 24%, grade F, #1,424 of 1,632 statewide, top 88%, 1,192 students, 81% FRL) — zoned schools at 87% FRL track the district average.
- Market conditions: 51 active listings in the ZIP; 17 comparable units currently listed for rent nearby; rentals leasing fast (median 14d on market — plan ~1-2 weeks tenant-placement turnaround); 12,577 units permitted in Dallas County in 2024 (6,829 in 5+ unit buildings).
Forward outlook
- In year one you build about $14k of equity ($2k loan paydown + $12k appreciation (4.2% local appreciation)).
- Dallas County population projected at +35% by 2050 — long-run rental-demand tailwind backs the buy-and-hold thesis.
- By year 3, paydown + projected appreciation supports a ~$35k cash-out refi (75% LTV) — recoverable capital for the next deal without selling this one.
Negotiation context
- Only 6 days on market — expect competitive offers; lowballing is unlikely to land.
- 3 sale attempts since 22y ago with the ask held roughly flat each time — persistent listings suggest the price (not the market) is what's stuck; bring a comps-based counter.
Risks & watch-outs
- Climate carrying-cost: major wind risk, 27% chance of damaging wind over 30y; extreme-heat days projected 7→25/yr by 2055 (HVAC capex compounding) — expect insurance premiums to compound above CPI over the hold.
Questions for the listing agent
- What do current leases actually rent for vs. the listed asking? Can we see a recent rent roll and the last 12 months of T-12 income?
- What does the HOA fee cover, when was the last increase, and are there any pending special assessments or reserve-fund shortfalls?
- Is there a deadline driving the sale (1031 exchange, divorce, estate, relocation)? That informs how much negotiation room exists.
- Crime grade is F in this area — have there been break-ins, vandalism, or insurance claims at this property in the last 3 years? What carrier currently insures it and at what premium?
- The area grade is low — what's the realistic commute time and amenity access for the typical tenant pool here? Any planned neighborhood developments (good or bad) we should know about?
- What's the average days-on-market for RENTAL listings here right now (not sales)? A rising rental-DOM trend means longer vacancies and softer asking-rent achievability than the comps imply.
- What's the recent tenant-quality profile in this submarket — average credit score on applications, eviction rate, late-payment / NSF rate, and stable-employment percentage? A property-management company in the area should have these aggregated.
- How much new for-sale + rental construction is in the pipeline within 1–3 miles? Heavy new supply typically softens prices + rents 12–24 months out; constrained supply supports both.
Investment metrics
- 1% rule
- 0.81% ✗
- Cap rate
- 4.88%
- Cash-on-cash
- -5.03%
- DSCR
- 0.78
- GRM
- 10.2
CMA / ARV
- ARV (on-the-fly)
- $313,600
- Comps found
- 12
Show comp detail 12 sales within ~0.75 mi
| Address | Dist | Beds/Ba | Sqft | Sold | Price | $/sf | Match |
|---|---|---|---|---|---|---|---|
| 3150 St Sophia Dr | 0.05mi | 4/2.5 | 1,992 (+2%) | 7mo | $285,000 | $143 | 89 |
| 2939 St Zachary Dr | 0.22mi | 5/2.0 (+1) | 1,846 (-6%) | 3mo | $295,500 | $160 | 70 |
| 2859 Saint David Dr | 0.31mi | 5/2.0 (+1) | 1,901 (-3%) | 8mo | $309,000 | $163 | 67 |
| 3315 Cedarcroft Ln | 0.49mi | 4/2.0 | 2,180 (+11%) | 0mo | $339,900 | $156 | 56 |
| 3520 Kiestcrest Dr | 0.65mi | 3/2.0 (-1) | 1,980 (+1%) | 8mo | $284,900 | $144 | 54 |
| 2918 Saint Rita Dr | 0.44mi | 3/2.0 (-1) | 1,805 (-8%) | 6mo | $307,000 | $170 | 54 |
| 3054 Kiestridge Dr | 0.64mi | 3/2.0 (-1) | 2,023 (+3%) | 7mo | $369,900 | $183 | 52 |
| 3764 Kiest Valley Pkwy | 0.55mi | 3/2.5 (-1) | 2,165 (+10%) | 3mo | $189,900 | $88 | 50 |
| 2823 Whitewood Dr | 0.54mi | 3/2.0 (-1) | 1,798 (-8%) | 9mo | $285,000 | $159 | 47 |
| 3526 Boulder Dr | 0.66mi | 3/2.0 (-1) | 2,070 (+6%) | 10mo | $475,000 | $229 | 45 |
| 2814 Woodmere Dr | 0.69mi | 3/2.5 (-1) | 1,816 (-7%) | 8mo | $399,000 | $220 | 44 |
| 3446 Silverwood Ln | 0.55mi | 3/2.0 (-1) | 2,246 (+15%) | 2mo | $265,000 | $118 | 42 |
Match score weights: distance 35% · size 25% · config 20% · recency 20%. Top-matched comps best support the ARV.
Projected returns pro-forma
4.17% appreciation · 3.0% rent growth · sell at horizon
- IRR
- 6.3%
- Equity multiple
- 1.39×
- Total profit
- $32,236
- Equity at exit
- $152,400
- IRR
- 8.8%
- Equity multiple
- 2.50×
- Total profit
- $124,095
- Equity at exit
- $251,590
Cash invested: $82,572 (down + closing). Projections, not guarantees.
Landlord ↔ Tenant lean methodology
- Overall (STATE)
- 87 Strongly Landlord-Friendly
- State Texas
- 87 Strongly Landlord-Friendly · R+5
- County
- — inherits STATE
- City
- — inherits STATE
ZIP-level market 75233
- Home prices YoY
- 1.1%
- Active inventory
- 51
- Price-to-rent
- 10.2×
Monthly cashflow live
- Estimated rent
- $2,402 high interval (Pro) →
- Mortgage (P&I)
- −$1,546
- Tax from tax record
- −$554 /mo · $6,647/yr
- Insurance
- −$123
- HOA
- −$21
- Vacancy / Maint / Mgmt
- −$504
- Net cashflow
- $-346
Break-even live
Sensitivity live
| Price | -10% $-179 | -5% $-263 | +0% $-346 | +5% $-430 | +10% $-513 |
|---|---|---|---|---|---|
| Rent | -10% $-536 | -5% $-441 | +0% $-346 | +5% $-252 | +10% $-157 |
| Rate | -1.0pp $-198 | -0.5pp $-271 | base $-346 | +0.5pp $-423 | +1.0pp $-501 |
UW: 25.0% down · 7.5% · 30yr · 1.5% tax · 5.0% vac · 8.0% maint · 8.0% mgmt
Financing live
Cash to close
- Down payment
- $73,725
- Closing costs
- $8,847
- Reserves months
- —
- Total cash needed
- —
Loan-product check · same deal, 3 products live
Conventional
25% down · 7.5% · 30yr
- Down + closing
- —
- Monthly P&I
- —
- Monthly cashflow
- —
- DSCR
- —
- Eligible?
- —
Personal DTI + credit; lowest rate.
DSCR
20% down · 8.5% · 30yr
- Down + closing
- —
- Monthly P&I
- —
- Monthly cashflow
- —
- DSCR
- —
- Eligible?
- —
No personal income docs; deal must DSCR.
Hard money
10% down · 12.0% · 12mo
- Down + closing
- —
- Monthly P&I
- —
- Monthly cashflow
- —
- DSCR
- —
- Eligible?
- —
Short-term bridge; refi at stabilization.
Rent comps 17 comps
| Address | Beds | Baths | Sqft | Rent | $/sqft | DOM | Units | Dist |
|---|---|---|---|---|---|---|---|---|
| 2925 Spruce Valley Ln Unit 403 Dallas, TX | 3.0 | 2.0 | 1477 | $2,500 | $1.69 | 23d | 1 | 0.36mi |
| 3240 Springwood Ln Dallas, TX | 3.0 | 2.0 | 1840 | $2,099 | $1.14 | 19d | 1 | 0.38mi |
| 3217 Cedarcroft Ln Dallas, TX | 3.0 | 3.0 | 1558 | $2,200 | $1.41 | 46d | 1 | 0.41mi |
| 3202 Noor St Dallas, TX | 4.0 | 2.0 | 1535 | $2,400 | $1.56 | 7d | 1 | 0.57mi |
| 3202 Noor St Dallas, TX | 4.0 | 2.0 | 1535 | $2,400 | $1.56 | 9d | 1 | 0.57mi |
| 3243 Noor St Dallas, TX | 4.0 | 2.0 | 1535 | $2,400 | $1.56 | 9d | 1 | 0.61mi |
| 3235 Noor St Dallas, TX | 4.0 | 2.0 | 1535 | $2,400 | $1.56 | 23d | 1 | 0.61mi |
| 3235 Noor St Dallas, TX | 4.0 | 2.0 | 1535 | $2,400 | $1.56 | 46d | 1 | 0.61mi |
| 2607 Clearview Cir Dallas, TX | 3.0 | 1.5 | 1486 | $1,950 | $1.31 | 9d | 1 | 0.85mi |
| 2736 Rolinda Dr Dallas, TX | 3.0 | 2.0 | 1250 | $2,150 | $1.72 | 8d | 1 | 1.03mi |
| 3837 Kimball Ridge Dr Dallas, TX | 3.0 | 3.0 | 2135 | $3,200 | $1.50 | 21d | 1 | 1.03mi |
| 2122 Riviera Dr Dallas, TX | 3.0 | 2.0 | 1568 | $2,350 | $1.50 | 6d | 1 | 1.21mi |
| 4520 Wyoming St Dallas, TX | 3.0 | 1.0 | 1250 | $1,750 | $1.40 | 26d | 1 | 1.25mi |
| 3425 Shelley Blvd Dallas, TX | 4.0 | 3.0 | 2448 | $4,250 | $1.74 | 5d | 1 | 1.38mi |
| 3901 Altoona Dr Dallas, TX | 2.0–4.0 | 1.5 | 1367 | $1,950 | $1.43 | 5d | 4 | 1.40mi |
| 3716 Ovid Ave Dallas, TX | 4.0 | 3.5 | 2554 | $3,200 | $1.25 | 13d | 1 | 1.40mi |
| 1819 Barlow Ave Dallas, TX | 4.0 | 2.0 | 1408 | $2,195 | $1.56 | 26d | 1 | 1.45mi |
HOA detail
- Monthly dues
- $21 · $252/yr
Listing history 5 events
-
2026-06-22days on market $294,900 Active 6 DOM
-
2026-06-21days on market $294,900 Active 5 DOM
-
2026-06-18days on market $294,900 Active 2 DOM
-
2026-06-17remarks 699-char remark
-
2026-06-17$294,900 Active 1 DOM
ⓘ Source: listings_history table (triggers on properties + properties_extension) + one-shot
backfill from property_details.listing_events for pre-trigger history.
Tax reassessment forecast TX · Resets to sale price
- Current annual tax
- $6,647 · $554/mo
- Projected year-2 tax
- $6,647 · $554/mo
- Expected delta
- $0/yr ($0/mo · 0.0%)
ⓘ Screening estimate from a state-policy table — verify with the county assessor before closing.
Climate risk First Street
- Flood 1/10 Low FEMA zone X (unshaded) · 0% chance over 30 yrs
- Wildfire 1/10 Low
- Heat 7/10 Severe 7 d/yr ≥109°F today · 25 d/yr by 30 yrs out
- Wind 6/10 Major 27% chance of damaging wind over 30 yrs
- Air quality 3/10 Moderate 2 unhealthy d/yr today · 3 by 30 yrs out
Nearby sold comps map
Loading sold comps map…
Walkable amenities ~0.75 mi
Loading nearby amenities…
Taxation est. · year 1
- Rental income
- $28,829
- − Mortgage interest
- −$16,519
- − Property taxes
- −$6,647
- − Insurance
- −$1,474
- − Repairs & maintenance
- −$2,306
- − Management
- −$2,306
- − HOA
- −$252
- − Depreciation
- −$8,579
- Taxable loss
- −$9,256
- Est. tax savings @ 24.0%
- +$2,221
- After-tax cash flow
- $-1,936/yr
For passive investors: Depreciation is non-cash, so a rental often shows a tax loss while cash-flowing — sheltering income. Rental losses are passive: they offset passive income freely, and up to $25,000/yr can offset ordinary (W-2) income if you actively participate and your MAGI is under $100k (phasing out to $0 by $150k); unused losses carry forward. On sale, claimed depreciation is recaptured at up to 25%, and gains may owe capital-gains tax (a 1031 exchange can defer both). Figures are a year-1 estimate at your 24.0% rate — not tax advice; consult a CPA.
Schools (NCES district)
- District
- Dallas ISD
- NCES district ID
- 4816230
- Math proficiency
- 31% ▼ -16.00%
- Reading proficiency
- 36% ▼ -4.00%
- Median HH income
- $42,881
- Composite
- 28.41/100
- National rank
- #6763
- State rank
- #559 of 826 in TX
Livability — Dallas
- Score
- 81/100
- State rank
- #24
- US rank
- #1380
Category grades
Schools grade is shown separately in the Schools card above.
Census & demographics
- Census place
- Dallas, TX
- City population
- 1,168,437
- Population (ZIP)
- 15,775
Population outlook (Dallas County) Hauer SSP2
- Today (2025)
- 2,979,839 people
- By 2030
- 3,191,823 · +7.1%
- By 2040
- 3,619,611 · +21.5%
- By 2050
- 4,026,915 · +35.1%
- By 2075
- 4,957,073 · +66.4%
- By 2100
- 5,508,725 · +84.9%
Race, ethnicity, and origin ACS 2023
- Neighborhood character
- Majority Hispanic (63%)
- Race & ethnicity
- Hispanic / Latino 63% Black 25% Two or more races 11% White 10% Asian 1%
- Hispanic origin (detail)
- Mexican 60%
- Common ancestry
- Slovak 1% Italian 1%
- Foreign-born
- 23% · Canada
- Languages at home
- 47% English-only · Spanish 52% Vietnamese 1%
Political lean MEDSL · Dallas
- 2024 margin
- Strong D (+22.2) · D 60.2% · R 38.0% · Other 1.8%
- 2008→2024 swing
- +6.9pp toward D · 2008: 15.3pp · 2024: 22.2pp
- All cycles
- 2024: D+22.2 2020: D+31.6 2016: D+26.2 2012: D+15.4 2008: D+15.3
Not yet ingested
- Civics
- —
Market trends
- HPI YoY
- ▲ 4.17%
- Current HPI
- 370.9766
- Rent YoY
- —
- Metro
- —
- State GDP YoY
- ▲ 3.95%
- F500 in state
- 110
Industry mix (Fortune 500 HQ in TX)
| Industry | F500 HQs | Revenue |
|---|---|---|
| Energy | 16 | $1,198B |
|
||
| Technology | 5 | $198B |
|
||
| Engineering / Construction | 4 | $72B |
|
||
| Energy Services | 3 | $60B |
|
||
| Utilities | 3 | $41B |
|
||
| Healthcare | 2 | $330B |
|
||
Price history
+132.4% since first listed10 events — show timeline
- 2026-06-16 Listed $294,900 NTREIS
- 2022-12-01 Rental Removed — RENT.
- 2022-07-11 Sold (Public Records) — Public Records
- 2022-07-08 Sold (MLS) — NTREIS
- 2022-06-13 Pending — NTREIS
- 2022-06-05 Contingent — NTREIS
- 2022-05-13 Listed $315,000 NTREIS
- 2004-12-23 Sold (MLS) — NTREIS
- 2004-10-12 Listing Removed — NTREIS
- 2004-08-18 Listed $126,890 NTREIS
Property tax history
+4.8%/yrLatest (2025): $6,647 · -0.4% YoY. Source: county tax records.
Cash-flow waterfall
monthlySold comps — $/sqft
last 12 mo · ≤1 miLoading sold comps…