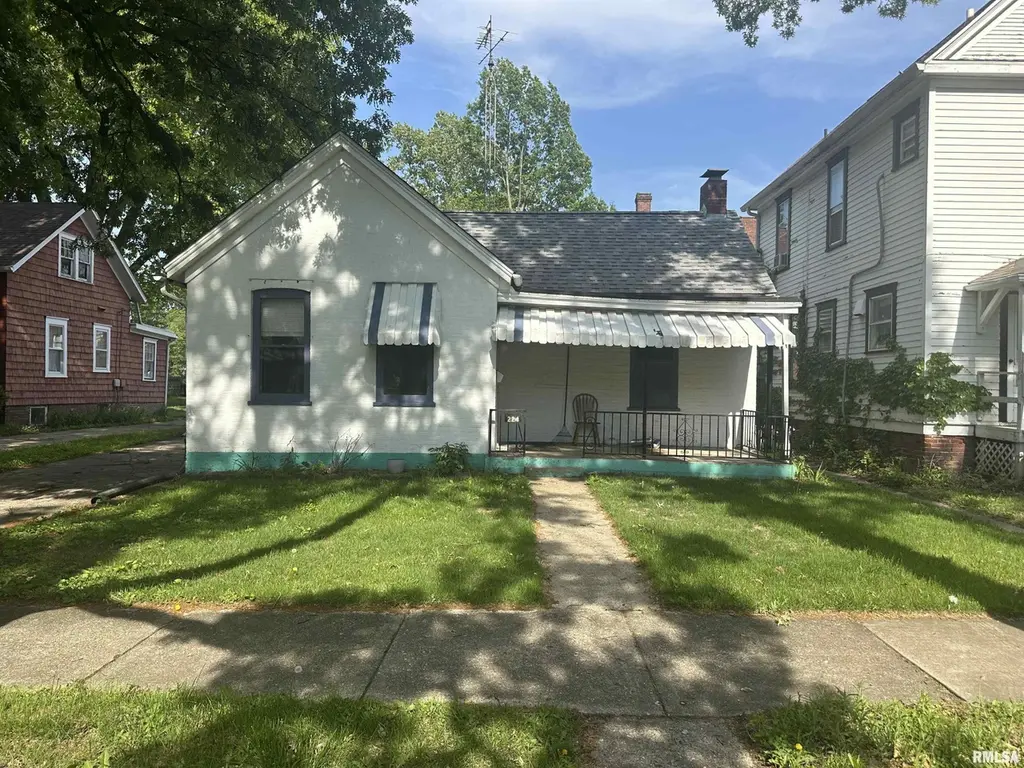
224 S Glenwood Ave · Springfield, IL
Flood risk 1/10 · Minimal
- FEMA flood zone
- X (unshaded)
- Chance of flooding over 30 yrs
- 0.0%
- Est. flood insurance / yr
- $473 – $860
Fire risk 1/10 · Minimal
- Est. fire insurance / yr
- $804 – $1,492
Heat risk 4/10 · Minor
- Hot days now (above 105°F)
- 7 days/yr
- Hot days in 30 yrs
- 20 days/yr
Wind risk 2/10 · Minimal
- Chance of severe wind over 30 yrs
- 1.0%
Air-quality risk 2/10 · Minimal
- Unhealthy air days now
- 1 days/yr
- Unhealthy air days in 30 yrs
- 2 days/yr
Risk factors via First Street. Map © Google.
Why this score? — see what drove the A- grade
The composite is a weighted blend of 9 inputs, each scored 0–100. Each bar is that input's sub-score; the figure is the points it added to the 100-point composite (weight × sub-score).
- Cash flow +30.0/30.0
- ARV discount +15.0/15.0
- 1% rule +10.0/10.0
- DSCR +10.0/10.0
- Appreciation +5.0/10.0
- Livability +4.0/5.0
- Rent growth +2.5/5.0
- Condition / age +2.5/5.0
- Schools +1.7/10.0
$65,000
🖨 Deal sheet (PDF) 📄 Offer letter ✓ Due diligence
Listing remarks MLS
2 bed, 1 bath "Fixer-upper", Close to downtown. Unfinished partial basement. Good for investment purposes.
Key facts
- Newer roof
- Eat in kitchen
- Full basement
Tags
Property features AI
Exterior
- Parking: Attached 1-car garage
- Utilities: Public water; Public sewer
- Home design: Single family residence; Built in 1940; 975 total building area
- Construction: Shingle roof; Full basement
- Exterior features: Level lot; Paved road access
Interior
- Kitchen: Refrigerator
- Bedrooms: 2 bedrooms (one 14 x 14 main-level bedroom; one 12 x 6.5 main-level bedroom)
- Flooring: Carpet in bedrooms; Laminate in living room; Tile in kitchen
- Bathrooms: 2 full bathrooms
- Heating & cooling: Window unit heating/cooling
- Interior features: Ceiling fan(s)
Neighborhood map
What this means for you Summary
Snapshot
- This is a 2-bed/2.0-bath single-family listed at $65k.
Deal economics
- At list price, monthly cash flow is $329 ($4k/yr) — positive.
- The deal already cash-flows at list — no discount required.
- Meets the 1% rule at list price ($1k rent vs $65k).
- Cap rate 12.4% vs local median 4.9% in Springfield — top-decile yield for the area; either an underpriced asset or a hidden risk that comps aren't pricing in. Stress-test before assuming the spread holds.
Location & tenants
- Location reads 79/100 on livability (#122 in IL, #2,138 nationally) — a middle-class / working-renter tenant base. Strengths: amenities A+, commute A+, cost of living A+; Watch: crime F.
- Springfield SD 186 (urban): math 17% / reading 22% proficiency, ranked #438 of 620 in IL (top 71%) — low school quality limits family demand, transient renter base, plan for 1-2y turnover; 64% free/reduced lunch — lower-income household profile, screen leases tightly.
- Zoned schools: Elizabeth Graham Elem School (math 5% / reading 12%, grade F, #1,617 of 2,056 statewide, top 79%, 252 students, 0% FRL); U S Grant Middle School (math 6% / reading 15%, grade F, #580 of 665 statewide, top 88%, 529 students, 0% FRL); Springfield High School (math 44% / reading 53%, grade D, #49 of 693 statewide, top 7%, 1,461 students, 0% FRL) — zoned schools average 0% FRL vs 64% district-wide (64 pts lower); this property's tenant base skews higher-income than the district average.
- Market conditions: 1 active listings in the ZIP; 22 comparable units currently listed for rent nearby; rentals lingering (median 46d on market — plan ~5-8 weeks vacancy on turnover, expect pricing pressure); 50% of comp listings sitting > 30 days — soft ceiling on asking rent; 225 units permitted in Sangamon County in 2024 (48 in 5+ unit buildings).
Forward outlook
- In year one you build about $2k of equity ($449 loan paydown + $2k appreciation (3.0% local appreciation)).
- Sangamon County population projected to shrink 9% by 2050 — rents likely to lag national; underwrite the cash flow, not the appreciation.
- At projected returns (3.0% appreciation + 3.0% rent growth), your $18k cash investment doubles in ~3 years — after that, you're playing with house money.
Negotiation context
- Only 3 days on market — expect competitive offers; lowballing is unlikely to land.
- 3 sale attempts since 11y ago with the ask held roughly flat each time — persistent listings suggest the price (not the market) is what's stuck; bring a comps-based counter.
- Current owner paid $32k; list at $65k implies a 103% gain — meaningful room to come down on a strong offer.
Risks & watch-outs
- Watch-outs: built in 1940 — expect roof / HVAC / electrical / plumbing capex.
Questions for the listing agent
- Built in 1940 — when were the roof, HVAC, electrical panel, plumbing, and water heater last replaced?
- Is there a deadline driving the sale (1031 exchange, divorce, estate, relocation)? That informs how much negotiation room exists.
- Schools are D-rated, which usually means shorter tenancies and higher turnover. Who's the typical renter profile here, and what's been the actual vacancy rate?
- Crime grade is F in this area — have there been break-ins, vandalism, or insurance claims at this property in the last 3 years? What carrier currently insures it and at what premium?
- What's the average days-on-market for RENTAL listings here right now (not sales)? A rising rental-DOM trend means longer vacancies and softer asking-rent achievability than the comps imply.
- What's the recent tenant-quality profile in this submarket — average credit score on applications, eviction rate, late-payment / NSF rate, and stable-employment percentage? A property-management company in the area should have these aggregated.
- How much new for-sale + rental construction is in the pipeline within 1–3 miles? Heavy new supply typically softens prices + rents 12–24 months out; constrained supply supports both.
Investment metrics
- 1% rule
- 1.58% ✓
- Cap rate
- 12.37%
- Cash-on-cash
- 21.71%
- DSCR
- 1.97
- GRM
- 5.3
CMA / ARV
- ARV (on-the-fly)
- $109,200
- Comps found
- 12
Show comp detail 12 sales within ~0.75 mi
| Address | Dist | Beds/Ba | Sqft | Sold | Price | $/sf | Match |
|---|---|---|---|---|---|---|---|
| 121 N Parker Ave | 0.19mi | 3/1.0 (+1) | 923 (-5%) | 3mo | $53,000 | $57 | 70 |
| 137 N Douglas Ave | 0.38mi | 2/1.0 | 936 (-4%) | 6mo | $69,000 | $74 | 66 |
| 329 S Park Ave | 0.59mi | 2/1.0 | 991 (+2%) | 1mo | $110,000 | $111 | 66 |
| 720 W Fayette Ave | 0.57mi | 2/2.0 | 994 (+2%) | 6mo | $155,000 | $156 | 65 |
| 612 S English Ave | 0.38mi | 2/1.0 | 896 (-8%) | 1mo | $100,000 | $112 | 64 |
| 1021 W Monroe St | 0.23mi | 2/1.0 | 864 (-11%) | 5mo | $100,000 | $116 | 62 |
| 1316 W Lawrence Ave | 0.69mi | 2/1.5 | 1,008 (+3%) | 3mo | $112,500 | $112 | 58 |
| 524 W Carpenter St | 0.52mi | 3/2.0 (+1) | 1,026 (+5%) | 5mo | $115,000 | $112 | 58 |
| 165 N English Ave | 0.35mi | 2/1.0 | 850 (-13%) | 8mo | $76,000 | $89 | 52 |
| 524 W Fayette Ave | 0.61mi | 2/1.0 | 910 (-7%) | 8mo | $45,500 | $50 | 50 |
| 235 N Illinois St | 0.51mi | 2/1.0 | 837 (-14%) | 4mo | $114,000 | $136 | 46 |
| 611 S Illinois St | 0.49mi | 1/1.0 (-1) | 830 (-15%) | 2mo | $73,600 | $89 | 41 |
Match score weights: distance 35% · size 25% · config 20% · recency 20%. Top-matched comps best support the ARV.
Projected returns pro-forma
3.0% appreciation · 3.0% rent growth · sell at horizon
- IRR
- 28.0%
- Equity multiple
- 2.58×
- Total profit
- $28,836
- Equity at exit
- $29,227
- IRR
- 28.5%
- Equity multiple
- 5.03×
- Total profit
- $73,325
- Equity at exit
- $45,042
Cash invested: $18,200 (down + closing). Projections, not guarantees.
Landlord ↔ Tenant lean methodology
- Overall (STATE)
- 43 Moderately Tenant-Leaning
- State Illinois
- 43 Moderately Tenant-Leaning · D+7
- County
- — inherits STATE
- City
- — inherits STATE
ZIP-level market 62704-1805
- Active inventory
- 1
- Price-to-rent
- 5.3×
Monthly cashflow live
- Estimated rent
- $1,027 high interval (Pro) →
- Mortgage (P&I)
- −$341
- Tax from tax record
- −$114 /mo · $1,372/yr
- Insurance
- −$27
- HOA
- −$0
- Vacancy / Maint / Mgmt
- −$216
- Net cashflow
- $329
Break-even live
Sensitivity live
| Price | -10% $366 | -5% $348 | +0% $329 | +5% $311 | +10% $292 |
|---|---|---|---|---|---|
| Rent | -10% $248 | -5% $289 | +0% $329 | +5% $370 | +10% $410 |
| Rate | -1.0pp $362 | -0.5pp $346 | base $329 | +0.5pp $312 | +1.0pp $295 |
UW: 25.0% down · 7.5% · 30yr · 1.5% tax · 5.0% vac · 8.0% maint · 8.0% mgmt
Financing live
Cash to close
- Down payment
- $16,250
- Closing costs
- $1,950
- Reserves months
- —
- Total cash needed
- —
Loan-product check · same deal, 3 products live
Conventional
25% down · 7.5% · 30yr
- Down + closing
- —
- Monthly P&I
- —
- Monthly cashflow
- —
- DSCR
- —
- Eligible?
- —
Personal DTI + credit; lowest rate.
DSCR
20% down · 8.5% · 30yr
- Down + closing
- —
- Monthly P&I
- —
- Monthly cashflow
- —
- DSCR
- —
- Eligible?
- —
No personal income docs; deal must DSCR.
Hard money
10% down · 12.0% · 12mo
- Down + closing
- —
- Monthly P&I
- —
- Monthly cashflow
- —
- DSCR
- —
- Eligible?
- —
Short-term bridge; refi at stabilization.
Rent comps 22 comps
| Address | Beds | Baths | Sqft | Rent | $/sqft | DOM | Units | Dist |
|---|---|---|---|---|---|---|---|---|
| 629 W Washington St Unit 4 Springfield, IL | 2.0 | 1.0 | 700 | $800 | $1.14 | 45d | 1 | 0.18mi |
| 203 N Glenwood Ave Springfield, IL | 2.0 | 1.0 | 850 | $1,000 | $1.18 | 22d | 1 | 0.21mi |
| 616 New St Springfield, IL | 1.0 | 1.0 | 550 | $850 | $1.55 | 45d | 1 | 0.36mi |
| 216 N Lincoln Ave Springfield, IL | 2.0 | 1.0 | 800 | $1,200 | $1.50 | 45d | 1 | 0.46mi |
| 423 W Lawrence Ave Unit 2 Springfield, IL | 2.0 | 1.0 | 900 | $1,050 | $1.17 | 22d | 1 | 0.47mi |
| 550 W Miller St Springfield, IL | 1.0 | 1.0 | 590 | $995 | $1.69 | 22d | 1 | 0.60mi |
| 300 N Park Ave Springfield, IL | 1.0–2.0 | 1.0 | 694 | $1,035 | $1.49 | 22d | 1 | 0.62mi |
| 1539 W Monroe St Springfield, IL | 2.0 | 1.0 | 820 | $2,000 | $2.44 | 22d | 1 | 0.77mi |
| 1004 S College St Springfield, IL | 1.0 | 1.0 | 700 | $800 | $1.14 | 22d | 1 | 0.77mi |
| 229 W Allen St Springfield, IL | 3.0 | 1.5 | 1050 | $1,305 | $1.24 | 22d | 1 | 0.82mi |
| 8 S Old State Capitol Plz Unit 1031831P Springfield, IL | 2.0 | 2.0 | 990 | $2,927 | $2.96 | 45d | 1 | 0.84mi |
| 417 E Cook St Springfield, IL | 1.0 | 1.0 | 700 | $875 | $1.25 | 45d | 1 | 0.86mi |
| 417 E Cook St Unit A Springfield, IL | 1.0 | 1.0 | 550 | $850 | $1.55 | 22d | 1 | 0.86mi |
| 619 S 5th St Springfield, IL | 1.0 | 1.0 | 750 | $900 | $1.20 | 45d | 1 | 0.87mi |
| 1644 W Adams St Unit 1 Springfield, IL | 2.0 | 1.0 | 950 | $1,200 | $1.26 | 45d | 1 | 0.90mi |
| 401 W Elliott Ave Unit A Springfield, IL | 3.0 | 1.0 | 1100 | $1,300 | $1.18 | 45d | 1 | 1.05mi |
| 1500 S Lowell Ave Springfield, IL | 1.0 | 1.0 | 590 | $775 | $1.31 | 45d | 1 | 1.08mi |
| 1501 S Spring St Springfield, IL | 2.0 | 1.0 | 1000 | $1,000 | $1.00 | 22d | 1 | 1.15mi |
| 909 S 8th St Unit 4 Springfield, IL | 1.0 | 1.0 | 550 | $800 | $1.45 | 22d | 1 | 1.16mi |
| 1600 S 6th St Unit 1 Springfield, IL | 3.0 | 2.0 | 1100 | $1,250 | $1.14 | 22d | 1 | 1.39mi |
| 1127 N 6th St Unit 2 Springfield, IL | 1.0 | 1.0 | 900 | $900 | $1.00 | 45d | 1 | 1.39mi |
| 201 Eastman Ave Springfield, IL | 2.0 | 1.0 | 812 | $950 | $1.17 | 45d | 1 | 1.45mi |
Listing history 9 events
-
2026-06-02status $65,000 Pending 3 DOM
-
2026-06-01days on market $65,000 Active 3 DOM
-
2026-05-31days on market $65,000 Active 2 DOM
-
2026-05-29$65,000 Active
-
2016-07-21soldstatus $32,000
-
2016-06-08soldstatus $32,000 116-char remark
Show marketing remark (116 chars)
2 bed, 1 bath "Fixer-upper", Close to downtown. Unfinished partial basement. Good for investment purposes.
-
2016-06-08$32,000 116-char remark
Show marketing remark (116 chars)
2 bed, 1 bath "Fixer-upper", Close to downtown. Unfinished partial basement. Good for investment purposes.
-
2016-03-28soldstatus $32,000 136-char remark
Show marketing remark (136 chars)
THIS IS A CHARMER THAT YOU DON'T WANT TO MISS OUT ON. 2 BD, 1 BA, CLOSE TO DOWNTOWN AND SCHOOLS. SQ FT TO BE ACCURATE BUT NOT WARRANTED.
-
2015-06-09$42,000 136-char remark
Show marketing remark (136 chars)
THIS IS A CHARMER THAT YOU DON'T WANT TO MISS OUT ON. 2 BD, 1 BA, CLOSE TO DOWNTOWN AND SCHOOLS. SQ FT TO BE ACCURATE BUT NOT WARRANTED.
ⓘ Source: listings_history table (triggers on properties + properties_extension) + one-shot
backfill from property_details.listing_events for pre-trigger history.
Tax reassessment forecast IL · Partial reset (capped growth)
- Current annual tax
- $1,372 · $114/mo
- Projected year-2 tax
- $1,424 · $119/mo
- Expected delta
- +$52/yr (+$4/mo · 3.8%)
ⓘ Screening estimate from a state-policy table — verify with the county assessor before closing.
Climate risk First Street
- Flood 1/10 Low FEMA zone X (unshaded) · 0% chance over 30 yrs
- Wildfire 1/10 Low
- Heat 4/10 Moderate 7 d/yr ≥105°F today · 20 d/yr by 30 yrs out
- Wind 2/10 Low 100% chance of damaging wind over 30 yrs
- Air quality 2/10 Low 1 unhealthy d/yr today · 2 by 30 yrs out
Nearby sold comps map
Loading sold comps map…
Walkable amenities ~0.75 mi
Loading nearby amenities…
Taxation est. · year 1
- Rental income
- $12,327
- − Mortgage interest
- −$3,641
- − Property taxes
- −$1,372
- − Insurance
- −$325
- − Repairs & maintenance
- −$986
- − Management
- −$986
- − Depreciation
- −$1,891
- Taxable income
- $3,126
- Est. tax owed @ 24.0%
- −$750
- After-tax cash flow
- $3,201/yr
For passive investors: Depreciation is non-cash, so a rental often shows a tax loss while cash-flowing — sheltering income. Rental losses are passive: they offset passive income freely, and up to $25,000/yr can offset ordinary (W-2) income if you actively participate and your MAGI is under $100k (phasing out to $0 by $150k); unused losses carry forward. On sale, claimed depreciation is recaptured at up to 25%, and gains may owe capital-gains tax (a 1031 exchange can defer both). Figures are a year-1 estimate at your 24.0% rate — not tax advice; consult a CPA.
Schools (NCES district)
- District
- Springfield SD 186
- NCES district ID
- 1737080
- Math proficiency
- 17% ▼ -7.00%
- Reading proficiency
- 22% ▼ -5.00%
- Median HH income
- $43,744
- Composite
- 16.89/100
- National rank
- #9142
- State rank
- #438 of 620 in IL
Livability — Springfield
- Score
- 79/100
- State rank
- #122
- US rank
- #2138
Category grades
Schools grade is shown separately in the Schools card above.
Census & demographics
- Census place
- Springfield, IL
Population outlook (Sangamon County) Hauer SSP2
- Today (2025)
- 198,317 people
- By 2030
- 196,127 · -1.1%
- By 2040
- 188,664 · -4.9%
- By 2050
- 179,624 · -9.4%
- By 2075
- 155,027 · -21.8%
- By 2100
- 122,588 · -38.2%
Not yet ingested
- Political lean
- —
- Race & ethnicity
- —
- Common origin
- —
- Civics
- —
Market trends
- HPI YoY
- —
- Current HPI
- —
- Rent YoY
- —
- Metro
- —
- State GDP YoY
- ▲ 1.59%
- F500 in state
- 60
Industry mix (Fortune 500 HQ in IL)
| Industry | F500 HQs | Revenue |
|---|---|---|
| Insurance | 4 | $201B |
|
||
| Consumer Goods | 4 | $87B |
|
||
| Industrial Machinery | 3 | $64B |
|
||
| Healthcare | 2 | $55B |
|
||
| Retail / Pharmacy | 1 | $148B |
|
||
| Agriculture / Food | 1 | $86B |
|
||
Price history
+54.8% since first listed6 events — show timeline
- 2026-05-29 Listed $65,000 RMLSA as Distributed by MLS Grid
- 2016-07-21 Sold (Public Records) $32,000 Public Records
- 2016-06-08 Listed $32,000 RMLSA as Distributed by MLS Grid
- 2016-06-08 Sold (MLS) $32,000 RMLSA as Distributed by MLS Grid
- 2016-03-28 Sold (MLS) $32,000 RMLSA as Distributed by MLS Grid
- 2015-06-09 Listed $42,000 RMLSA as Distributed by MLS Grid
Property tax history
+0.0%/yrLatest (2025): $1,372 · +6.1% YoY. Source: county tax records.
Cash-flow waterfall
monthlySold comps — $/sqft
last 12 mo · ≤1 miLoading sold comps…