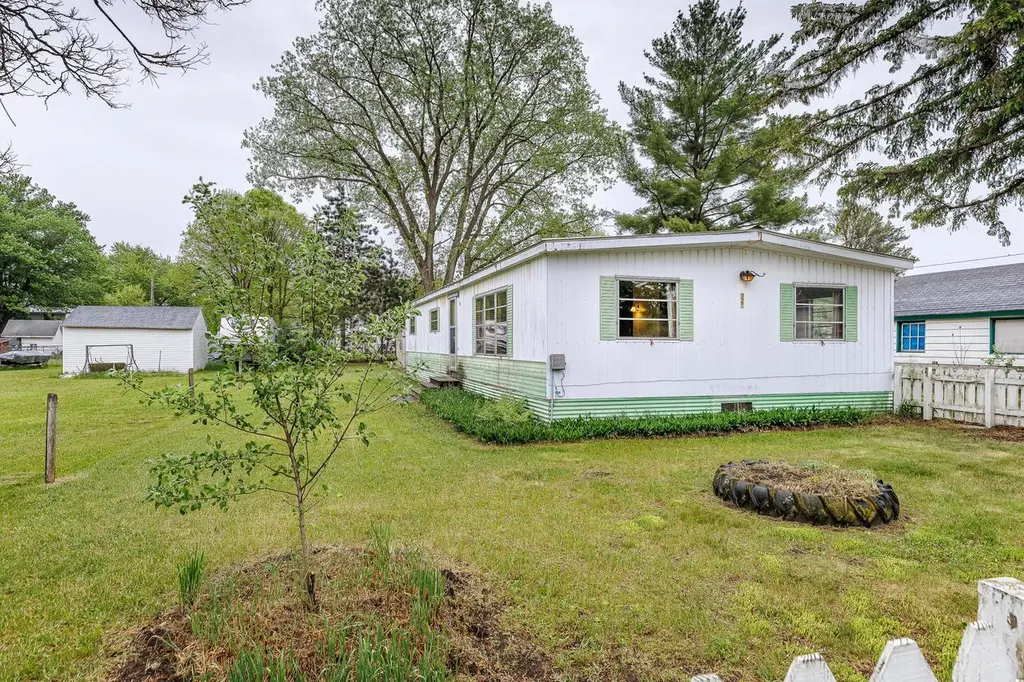
921 Depot St · Sparta, WI
Flood risk 1/10 · Minimal
- FEMA flood zone
- X (unshaded)
- Chance of flooding over 30 yrs
- 0.0%
- Est. flood insurance / yr
- $473 – $860
Fire risk 1/10 · Minimal
- Est. fire insurance / yr
- $636 – $1,182
Heat risk 2/10 · Minimal
- Hot days now (above 100°F)
- 7 days/yr
- Hot days in 30 yrs
- 14 days/yr
Wind risk 2/10 · Minimal
- Chance of severe wind over 30 yrs
- —
Air-quality risk 1/10 · Minimal
- Unhealthy air days now
- 0 days/yr
- Unhealthy air days in 30 yrs
- 0 days/yr
Risk factors via First Street. Map © Google.
Why this score? — see what drove the B+ grade
The composite is a weighted blend of 9 inputs, each scored 0–100. Each bar is that input's sub-score; the figure is the points it added to the 100-point composite (weight × sub-score).
- Cash flow +30.0/30.0
- ARV discount +15.0/15.0
- 1% rule +10.0/10.0
- DSCR +10.0/10.0
- Livability +3.9/5.0
- Rent growth +2.5/5.0
- Condition / age +2.5/5.0
- Schools +2.3/10.0
- Appreciation +0.0/10.0
$125,000
🖨 Deal sheet (PDF) 📄 Offer letter ✓ Due diligence
Listing remarks
Enjoy simple living in this 4-bed, 1-bath manufactured home on a nice-sized lot. Larger bedrooms and generous closet space offer comfort and practicality. The living area is open and perfect for hosting and entertaining. This home is ready for your personal touch and invites you to make it your own. Outside, multiple sheds provide plenty of storage opportunities for tools, toys, or hobbies. It's a great chance to create the space you've been looking for-affordable, flexible, and full of potential.
Key facts
- Multiple sheds
- Larger bedrooms
- Nice-sized lot
Tags
Property features AI
Finance
- Other: Appliances included: refrigerator, stove/oven, washer, dryer; Seller excludes personal property
Exterior
- Utilities: Municipal water; Municipal sewer
- Home design: Single-family, one-story home; Estimated living area in the 1001–1250 sq ft range
- Construction: Aluminum/aluminum-steel construction
- Exterior features: Aluminum / aluminum-steel exterior; Cabana/Gazebo; Three storage sheds; Lot less than 1/2 acre (about 0.22 acre); Residential zoning
Interior
- Kitchen: Kitchen on main level, approximately 11 x 9; Refrigerator; Oven/Range; Pantry
- Bedrooms: Master bedroom on main level, approximately 14 x 11; Bedroom 2 on main level, approximately 11 x 11; Bedroom 3 on main level, approximately 8 x 8; Bedroom 4 on main level, approximately 11 x 11
- Bathrooms: One full bathroom with a shower stall
- Heating & cooling: Forced-air heating; Natural gas fuel
- Interior features: Pantry; Cable/Satellite available; High-speed internet available; Slab foundation (no basement)
- Laundry & utility: Washer; Dryer
Neighborhood map
What this means for you Summary
Snapshot
- This is a 4-bed/1.0-bath single-family listed at $125k.
Deal economics
- At list price, monthly cash flow is $968 ($12k/yr) — positive.
- The deal already cash-flows at list — no discount required.
- Meets the 1% rule at list price ($2k rent vs $125k).
- Recommended offer: $123k (1.5% below list) — sets the bar for market timing.
- Cap rate 15.6% vs local median 5.3% in Sparta — top-decile yield for the area; either an underpriced asset or a hidden risk that comps aren't pricing in. Stress-test before assuming the spread holds.
Location & tenants
- Location reads 77/100 on livability (#124 in WI, #3,230 nationally) — a middle-class / working-renter tenant base. Strengths: cost of living A+, housing A+, health & safety A+; Watch: crime D, amenities F, commute F.
- Sparta Area School District (town): math 22% / reading 30% proficiency, ranked #302 of 342 in WI (top 88%) — low school quality limits family demand, transient renter base, plan for 1-2y turnover.
- Market conditions: 70 active listings in the ZIP; 1 comparable units currently listed for rent nearby; 93 units permitted in Monroe County in 2024 (0 in 5+ unit buildings).
Forward outlook
- Local home prices are declining (-3.0%/yr); year-one equity from $864 of loan paydown is wiped out by about $4k of value loss. Plan a longer hold.
- Monroe County population projected to shrink 9% by 2050 — rents likely to lag national; underwrite the cash flow, not the appreciation.
- At projected returns (-3.0% appreciation + 3.0% rent growth), your $35k cash investment doubles in ~4 years — after that, you're playing with house money.
Negotiation context
- It's been on market 25 days — a 2% lower offer ($123k) is reasonable based on typical stale-listing flexibility.
Questions for the listing agent
- Built in 1971 — when were the roof, HVAC, electrical panel, plumbing, and water heater last replaced?
- Is there a deadline driving the sale (1031 exchange, divorce, estate, relocation)? That informs how much negotiation room exists.
- Crime grade is D in this area — have there been break-ins, vandalism, or insurance claims at this property in the last 3 years? What carrier currently insures it and at what premium?
- What's the average days-on-market for RENTAL listings here right now (not sales)? A rising rental-DOM trend means longer vacancies and softer asking-rent achievability than the comps imply.
- What's the recent tenant-quality profile in this submarket — average credit score on applications, eviction rate, late-payment / NSF rate, and stable-employment percentage? A property-management company in the area should have these aggregated.
- How much new for-sale + rental construction is in the pipeline within 1–3 miles? Heavy new supply typically softens prices + rents 12–24 months out; constrained supply supports both.
Investment metrics
- 1% rule
- 1.88% ✓
- Cap rate
- 15.58%
- Cash-on-cash
- 33.17%
- DSCR
- 2.48
- GRM
- 4.4
CMA / ARV
- ARV (on-the-fly)
- $223,200
- Comps found
- 6
Show comp detail 6 sales within ~0.75 mi
| Address | Dist | Beds/Ba | Sqft | Sold | Price | $/sf | Match |
|---|---|---|---|---|---|---|---|
| 505 East Ave | 0.35mi | 4/1.0 | 1,270 (+6%) | 0mo | $234,900 | $185 | 74 |
| 675 Prairie Ave | 0.08mi | 3/2.0 (-1) | 1,329 (+11%) | 9mo | $285,000 | $214 | 62 |
| 916 S Water St | 0.59mi | 3/1.5 (-1) | 1,304 (+9%) | 5mo | $218,000 | $167 | 46 |
| 1417 S Water St | 0.75mi | 3/1.0 (-1) | 1,096 (-9%) | 4mo | $140,000 | $128 | 42 |
| 9620 Ignite Ave | 0.74mi | 3/2.0 (-1) | 1,056 (-12%) | 10mo | $275,000 | $260 | 28 |
| 112 N Tyler St | 0.73mi | 3/1.0 (-1) | 1,039 (-13%) | 21mo | $193,289 | $186 | 21 |
Match score weights: distance 35% · size 25% · config 20% · recency 20%. Top-matched comps best support the ARV.
Projected returns pro-forma
-3.0% appreciation · 3.0% rent growth · sell at horizon
- IRR
- 28.4%
- Equity multiple
- 2.18×
- Total profit
- $41,416
- Equity at exit
- $18,638
- IRR
- 35.8%
- Equity multiple
- 4.30×
- Total profit
- $115,618
- Equity at exit
- $10,808
Cash invested: $35,000 (down + closing). Projections, not guarantees.
Landlord ↔ Tenant lean methodology
- Overall (STATE)
- 73 Landlord-Friendly
- State Wisconsin
- 73 Landlord-Friendly · R+2
- County
- — inherits STATE
- City
- — inherits STATE
ZIP-level market 54656
- Active inventory
- 70
- Price-to-rent
- 4.4×
Monthly cashflow live
- Estimated rent
- $2,350 medium interval (Pro) →
- Mortgage (P&I)
- −$656
- Tax from tax record
- −$181 /mo · $2,177/yr
- Insurance
- −$52
- HOA
- −$0
- Vacancy / Maint / Mgmt
- −$494
- Net cashflow
- $968
Break-even live
Sensitivity live
| Price | -10% $1,038 | -5% $1,003 | +0% $968 | +5% $932 | +10% $897 |
|---|---|---|---|---|---|
| Rent | -10% $782 | -5% $875 | +0% $968 | +5% $1,060 | +10% $1,153 |
| Rate | -1.0pp $1,030 | -0.5pp $999 | base $968 | +0.5pp $935 | +1.0pp $902 |
UW: 25.0% down · 7.5% · 30yr · 1.5% tax · 5.0% vac · 8.0% maint · 8.0% mgmt
Financing live
Cash to close
- Down payment
- $31,250
- Closing costs
- $3,750
- Reserves months
- —
- Total cash needed
- —
Loan-product check · same deal, 3 products live
Conventional
25% down · 7.5% · 30yr
- Down + closing
- —
- Monthly P&I
- —
- Monthly cashflow
- —
- DSCR
- —
- Eligible?
- —
Personal DTI + credit; lowest rate.
DSCR
20% down · 8.5% · 30yr
- Down + closing
- —
- Monthly P&I
- —
- Monthly cashflow
- —
- DSCR
- —
- Eligible?
- —
No personal income docs; deal must DSCR.
Hard money
10% down · 12.0% · 12mo
- Down + closing
- —
- Monthly P&I
- —
- Monthly cashflow
- —
- DSCR
- —
- Eligible?
- —
Short-term bridge; refi at stabilization.
Rent comps 1 comps
| Address | Beds | Baths | Sqft | Rent | $/sqft | DOM | Units | Dist |
|---|---|---|---|---|---|---|---|---|
| 703 Stelting St Sparta, WI | 3.0 | 2.0 | 1368 | $2,350 | $1.72 | 14d | 1 | 0.96mi |
Listing history 11 events
-
2026-06-13statusdays on market $125,000 Pending 25 DOM
-
2026-06-10days on market $125,000 Active 23 DOM
-
2026-06-09days on market $125,000 Active 22 DOM
-
2026-06-08days on market $125,000 Active 21 DOM
-
2026-06-07days on market $125,000 Active 20 DOM
-
2026-06-03days on market $125,000 Active 16 DOM
-
2026-06-02days on market $125,000 Active 15 DOM
-
2026-06-01days on market $125,000 Active 14 DOM
-
2026-05-31days on market $125,000 Active 13 DOM
-
2026-05-31days on market $125,000 Active 12 DOM
-
2026-05-18$125,000 Active
ⓘ Source: listings_history table (triggers on properties + properties_extension) + one-shot
backfill from property_details.listing_events for pre-trigger history.
Tax reassessment forecast WI · Partial reset (capped growth)
- Current annual tax
- $2,177 · $181/mo
- Projected year-2 tax
- $2,245 · $187/mo
- Expected delta
- +$68/yr (+$6/mo · 3.1%)
ⓘ Screening estimate from a state-policy table — verify with the county assessor before closing.
Climate risk First Street
- Flood 1/10 Low FEMA zone X (unshaded) · 0% chance over 30 yrs
- Wildfire 1/10 Low
- Heat 2/10 Low 7 d/yr ≥100°F today · 14 d/yr by 30 yrs out
- Wind 2/10 Low
- Air quality 1/10 Low 0 unhealthy d/yr today · 0 by 30 yrs out
Nearby sold comps map
Loading sold comps map…
Walkable amenities ~0.75 mi
Loading nearby amenities…
Taxation est. · year 1
- Rental income
- $28,200
- − Mortgage interest
- −$7,002
- − Property taxes
- −$2,177
- − Insurance
- −$625
- − Repairs & maintenance
- −$2,256
- − Management
- −$2,256
- − Depreciation
- −$3,636
- Taxable income
- $10,248
- Est. tax owed @ 24.0%
- −$2,459
- After-tax cash flow
- $9,151/yr
For passive investors: Depreciation is non-cash, so a rental often shows a tax loss while cash-flowing — sheltering income. Rental losses are passive: they offset passive income freely, and up to $25,000/yr can offset ordinary (W-2) income if you actively participate and your MAGI is under $100k (phasing out to $0 by $150k); unused losses carry forward. On sale, claimed depreciation is recaptured at up to 25%, and gains may owe capital-gains tax (a 1031 exchange can defer both). Figures are a year-1 estimate at your 24.0% rate — not tax advice; consult a CPA.
Schools (NCES district)
- District
- Sparta Area School District
- NCES district ID
- 5514160
- Math proficiency
- 22% ▼ -9.00%
- Reading proficiency
- 30% ▼ -2.00%
- Median HH income
- $51,340
- Composite
- 22.99/100
- National rank
- #7982
- State rank
- #302 of 342 in WI
Livability — Sparta
- Score
- 77/100
- State rank
- #124
- US rank
- #3230
Category grades
Schools grade is shown separately in the Schools card above.
Census & demographics
- Census place
- Sparta, WI
- Population (ZIP)
- 18,068
Population outlook (Monroe County) Hauer SSP2
- Today (2025)
- 45,682 people
- By 2030
- 45,187 · -1.1%
- By 2040
- 43,768 · -4.2%
- By 2050
- 41,596 · -8.9%
- By 2075
- 35,555 · -22.2%
- By 2100
- 28,278 · -38.1%
Race, ethnicity, and origin ACS 2023
- Neighborhood character
- Predominantly White (88%)
- Race & ethnicity
- White 88% Hispanic / Latino 6% Two or more races 4% Black 2%
- Hispanic origin (detail)
- Mexican 5%
- Common ancestry
- Portuguese 14% Romanian 4% Slovak 3%
- Foreign-born
- 3% · Canada
- Languages at home
- 94% English-only · Spanish 4% Other Indo-European 0%
Political lean MEDSL · Monroe
- 2024 margin
- Strong R (+26.1) · D 36.3% · R 62.5% · Other 1.2%
- 2008→2024 swing
- -34.1pp toward R · 2008: 8.0pp · 2024: -26.1pp
- All cycles
- 2024: R+26.1 2020: R+23.6 2016: R+22.5 2012: R+0.7 2008: D+8.0
Not yet ingested
- Civics
- —
Market trends
- HPI YoY
- ▼ -154.23%
- Current HPI
- 214.4606
- Rent YoY
- —
- Metro
- —
- State GDP YoY
- ▲ 2.10%
- F500 in state
- 20
Industry mix (Fortune 500 HQ in WI)
| Industry | F500 HQs | Revenue |
|---|---|---|
| Industrial Machinery | 4 | $23B |
|
||
| Industrial Technology | 2 | $36B |
|
||
| Insurance | 1 | $36B |
|
||
| Professional Services | 1 | $19B |
|
||
| Utilities | 1 | $9B |
|
||
| Consumer Goods | 1 | $3B |
|
||
Price history
1 event — show timeline
- 2026-05-18 Listed $125,000 METROMLS
Property tax history
+3.3%/yrLatest (2025): $2,177 · +12.5% YoY. Source: county tax records.
Cash-flow waterfall
monthlySold comps — $/sqft
last 12 mo · ≤1 miLoading sold comps…