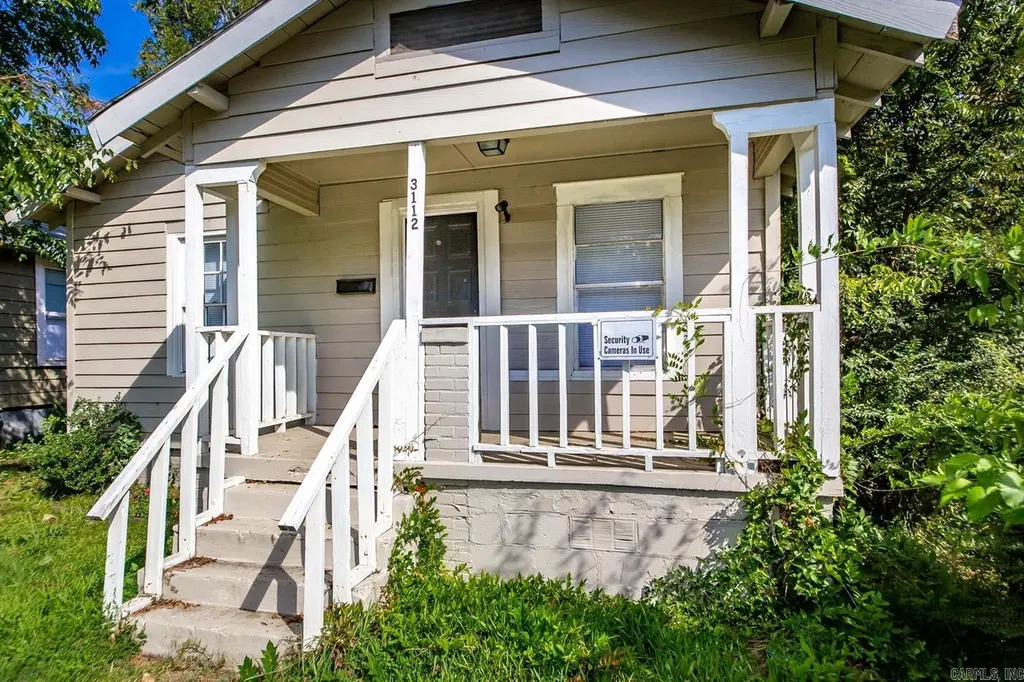
3112 W 16th St · Little Rock, AR
Flood risk 6/10 · Moderate
- FEMA flood zone
- X (unshaded)
- Chance of flooding over 30 yrs
- 0.95%
- Est. flood insurance / yr
- $507 – $1,088
Fire risk 2/10 · Minimal
- Est. fire insurance / yr
- $1,499 – $2,785
Heat risk 7/10 · Major
- Hot days now (above 110°F)
- 7 days/yr
- Hot days in 30 yrs
- 18 days/yr
Wind risk 4/10 · Minor
- Chance of severe wind over 30 yrs
- 10.0%
Air-quality risk 2/10 · Minimal
- Unhealthy air days now
- 1 days/yr
- Unhealthy air days in 30 yrs
- 1 days/yr
Risk factors via First Street. Map © Google.
Why this score? — see what drove the B grade
The composite is a weighted blend of 9 inputs, each scored 0–100. Each bar is that input's sub-score; the figure is the points it added to the 100-point composite (weight × sub-score).
- Cash flow +30.0/30.0
- ARV discount +10.4/15.0
- DSCR +10.0/10.0
- 1% rule +8.5/10.0
- Rent growth +3.7/5.0
- Livability +3.7/5.0
- Condition / age +2.5/5.0
- Schools +2.1/10.0
- Appreciation +0.0/10.0
$103,000
🖨 Deal sheet (PDF) 📄 Offer letter ✓ Due diligence
Listing remarks MLS
Affordable 4-bedroom Gem! This older home offers plenty of space and charm at a budget-friendly price. With 4 bedrooms and solid bones, it's perfect for first time buyers, families, or investors looking for a smart opportunity. Great potential and close to the freeway -- don't miss out!
Key facts
- 4,791 sq ft lot
- 2 parking spots
- Built 1938
Neighborhood map
What this means for you Summary
Snapshot
- This is a 4-bed/1.0-bath single-family listed at $103k.
Deal economics
- At list price, monthly cash flow is $438 ($5k/yr) — positive.
- The deal already cash-flows at list — no discount required.
- Meets the 1% rule at list price ($1k rent vs $103k).
- Recommended offer: $91k (12.0% below list) — sets the bar for market timing.
- Cap rate 11.4% vs local median 4.1% in Little Rock — top-decile yield for the area; either an underpriced asset or a hidden risk that comps aren't pricing in. Stress-test before assuming the spread holds.
Location & tenants
- Location reads 73/100 on livability (#22 in AR) — a middle-class / working-renter tenant base. Strengths: commute A+, cost of living A+, housing A+; Watch: crime F.
- Little Rock School District (urban): math 23% / reading 26% proficiency, ranked #183 of 238 in AR (top 77%) — low school quality limits family demand, transient renter base, plan for 1-2y turnover; 69% free/reduced lunch — lower-income household profile, screen leases tightly.
- Zoned schools: Forest Heights Stem Academy (math 45% / reading 57%, grade C-, #88 of 454 statewide, top 19%, 739 students, 50% FRL); Central High School (math 32% / reading 42%, grade F, #64 of 292 statewide, top 26%, 2,338 students, 53% FRL) — zoned schools average 52% FRL vs 69% district-wide (17 pts lower); this property's tenant base skews higher-income than the district average.
- Zoned-school proficiency averages 44% at this address vs 24% district-wide (+20 pts) — the actual schools serving this property are materially stronger than the Little Rock School District average implies; a family-tenant draw the district grade alone would hide.
- Market conditions: Rents rising fast (+4.9%/yr); 187 active listings in the ZIP; 31 comparable units currently listed for rent nearby; rentals lingering (median 46d on market — plan ~5-8 weeks vacancy on turnover, expect pricing pressure); 52% of comp listings sitting > 30 days — soft ceiling on asking rent; lower-income renter base — watch delinquency; 1,006 units permitted in Pulaski County in 2024 (0 in 5+ unit buildings).
Forward outlook
- Local home prices are declining (-3.0%/yr); year-one equity from $712 of loan paydown is wiped out by about $3k of value loss. Plan a longer hold.
- Pulaski County population projected at +6% by 2050 — modest demand growth; plan on rents tracking national, not racing it.
- At projected returns (-3.0% appreciation + 4.9% rent growth), your $29k cash investment doubles in ~6 years — after that, you're playing with house money.
Negotiation context
- It's been on market 359 days — a 12% lower offer ($91k) is reasonable based on typical stale-listing flexibility.
- 10 sale attempts since 6y ago; this cycle's ask is 8519% above the opening price — seller raised mid-cycle; expect resistance to lowballs.
Risks & watch-outs
- Watch-outs: built in 1938 — expect roof / HVAC / electrical / plumbing capex.
- Climate carrying-cost: major flood risk; extreme-heat days projected 7→18/yr by 2055 (HVAC capex compounding) — expect insurance premiums to compound above CPI over the hold.
Questions for the listing agent
- It's been on market 359 days. Have you received any prior offers? Is the seller open to a 12% concession, seller financing, or rate buy-down credit?
- Built in 1938 — when were the roof, HVAC, electrical panel, plumbing, and water heater last replaced?
- Why hasn't it sold? Are there any deal-killer items the seller is aware of (foundation, flood, title, zoning, code violations)?
- Is there a deadline driving the sale (1031 exchange, divorce, estate, relocation)? That informs how much negotiation room exists.
- Crime grade is F in this area — have there been break-ins, vandalism, or insurance claims at this property in the last 3 years? What carrier currently insures it and at what premium?
- What's the average days-on-market for RENTAL listings here right now (not sales)? A rising rental-DOM trend means longer vacancies and softer asking-rent achievability than the comps imply.
- What's the recent tenant-quality profile in this submarket — average credit score on applications, eviction rate, late-payment / NSF rate, and stable-employment percentage? A property-management company in the area should have these aggregated.
- How much new for-sale + rental construction is in the pipeline within 1–3 miles? Heavy new supply typically softens prices + rents 12–24 months out; constrained supply supports both.
Investment metrics
- 1% rule
- 1.35% ✓
- Cap rate
- 11.39%
- Cash-on-cash
- 18.21%
- DSCR
- 1.81
- GRM
- 6.2
CMA / ARV
- ARV (median comp)
- $110,081
- List price
- $103,000
- Delta
- -6.43%
- Verdict
- FAIR
- Comps
- 20 within 1.0 mi
Show comp detail 12 sales within ~0.75 mi
| Address | Dist | Beds/Ba | Sqft | Sold | Price | $/sf | Match |
|---|---|---|---|---|---|---|---|
| 3407 Maryland Ave | 0.45mi | 3/1.0 (-1) | 1,140 (-1%) | 8mo | $80,000 | $70 | 66 |
| 3113 W 11th | 0.29mi | 3/1.0 (-1) | 1,163 (+1%) | 19mo | $49,000 | $42 | 64 |
| 1617 S Valentine St | 0.30mi | 3/2.0 (-1) | 1,204 (+4%) | 7mo | $164,360 | $137 | 64 |
| 2109 Brown St | 0.36mi | 3/2.0 (-1) | 1,239 (+8%) | 3mo | $145,000 | $117 | 59 |
| 3105 W 13th St | 0.16mi | 3/2.0 (-1) | 1,296 (+12%) | 8mo | $146,500 | $113 | 56 |
| 3212 Lamar | 0.57mi | 3/2.5 (-1) | 1,228 (+7%) | 1mo | $75,000 | $61 | 51 |
| 2220 W 22nd St | 0.74mi | 3/1.0 (-1) | 1,200 (+4%) | 8mo | $130,000 | $108 | 47 |
| 4219 W 13th St | 0.73mi | 3/2.0 (-1) | 1,156 (+0%) | 12mo | $135,000 | $117 | 46 |
| 3317 W 7th St | 0.62mi | 3/2.0 (-1) | 1,200 (+4%) | 11mo | $184,000 | $153 | 46 |
| 4009 W 11th St | 0.64mi | 3/2.0 (-1) | 1,305 (+13%) | 2mo | $161,950 | $124 | 38 |
| 3519 Maryland Ave | 0.49mi | 3/1.0 (-1) | 1,323 (+15%) | 17mo | $52,750 | $40 | 33 |
| 2210 W Tenth St | 0.71mi | 3/2.0 (-1) | 1,305 (+13%) | 10mo | $279,000 | $214 | 27 |
Match score weights: distance 35% · size 25% · config 20% · recency 20%. Top-matched comps best support the ARV.
Projected returns pro-forma
-3.0% appreciation · 4.91% rent growth · sell at horizon
- IRR
- 11.9%
- Equity multiple
- 1.48×
- Total profit
- $13,906
- Equity at exit
- $15,358
- IRR
- 22.3%
- Equity multiple
- 3.07×
- Total profit
- $59,627
- Equity at exit
- $8,906
Cash invested: $28,840 (down + closing). Projections, not guarantees.
Landlord ↔ Tenant lean methodology
- Overall (STATE)
- 92 Strongly Landlord-Friendly
- State Arkansas
- 92 Strongly Landlord-Friendly · R+14
- County
- — inherits STATE
- City
- — inherits STATE
ZIP-level market 72204
- Home prices YoY
- -21.5%
- Rents YoY
- 4.9%
- Active inventory
- 187
- Price-to-rent
- 6.2×
Monthly cashflow live
- Estimated rent
- $1,395 high interval (Pro) →
- Mortgage (P&I)
- −$540
- Tax from tax record
- −$82 /mo · $980/yr
- Insurance
- −$43
- HOA
- −$0
- Vacancy / Maint / Mgmt
- −$293
- Net cashflow
- $438
Break-even live
Sensitivity live
| Price | -10% $496 | -5% $467 | +0% $438 | +5% $408 | +10% $379 |
|---|---|---|---|---|---|
| Rent | -10% $327 | -5% $382 | +0% $438 | +5% $493 | +10% $548 |
| Rate | -1.0pp $489 | -0.5pp $464 | base $438 | +0.5pp $411 | +1.0pp $384 |
UW: 25.0% down · 7.5% · 30yr · 1.5% tax · 5.0% vac · 8.0% maint · 8.0% mgmt
Financing live
Cash to close
- Down payment
- $25,750
- Closing costs
- $3,090
- Reserves months
- —
- Total cash needed
- —
Loan-product check · same deal, 3 products live
Conventional
25% down · 7.5% · 30yr
- Down + closing
- —
- Monthly P&I
- —
- Monthly cashflow
- —
- DSCR
- —
- Eligible?
- —
Personal DTI + credit; lowest rate.
DSCR
20% down · 8.5% · 30yr
- Down + closing
- —
- Monthly P&I
- —
- Monthly cashflow
- —
- DSCR
- —
- Eligible?
- —
No personal income docs; deal must DSCR.
Hard money
10% down · 12.0% · 12mo
- Down + closing
- —
- Monthly P&I
- —
- Monthly cashflow
- —
- DSCR
- —
- Eligible?
- —
Short-term bridge; refi at stabilization.
Rent comps 31 comps
| Address | Beds | Baths | Sqft | Rent | $/sqft | DOM | Units | Dist |
|---|---|---|---|---|---|---|---|---|
| 1626 S Brown St Little Rock, AR | 3.0 | 2.0 | 1386 | $995 | $0.72 | 46d | 1 | 0.14mi |
| 3214 W 13th St Little Rock, AR | 3.0 | 2.0 | 1264 | $1,095 | $0.87 | 46d | 1 | 0.17mi |
| 2900 W 15th St Little Rock, AR | 3.0 | 1.0 | 1337 | $950 | $0.71 | 46d | 1 | 0.17mi |
| 3401 W 17th St Little Rock, AR | 3.0 | 2.0 | 1370 | $1,400 | $1.02 | 46d | 1 | 0.20mi |
| 1820 Johnson St Little Rock, AR | 4.0 | 2.0 | 1223 | $1,550 | $1.27 | 21d | 1 | 0.21mi |
| 1822 Booker St Little Rock, AR | 3.0 | 2.0 | 1076 | $1,195 | $1.11 | 25d | 1 | 0.24mi |
| 2803 W Daisy L Gatson Bates Dr Little Rock, AR | 4.0 | 2.0 | 1138 | $1,495 | $1.31 | 46d | 1 | 0.24mi |
| 3109 W 11th St Little Rock, AR | 3.0 | 2.0 | 1055 | $1,295 | $1.23 | 46d | 1 | 0.26mi |
| 3204 Maryland Ave Little Rock, AR | 3.0 | 1.0 | 921 | $1,095 | $1.19 | 46d | 1 | 0.41mi |
| 3423 Maryland Ave Little Rock, AR | 4.0 | 2.0 | 1223 | $1,595 | $1.30 | 46d | 1 | 0.43mi |
| 2105 S Valentine St Little Rock, AR | 4.0 | 2.0 | 1223 | $1,595 | $1.30 | 16d | 1 | 0.44mi |
| 1123 Thayer St Little Rock, AR | 4.0 | 2.0 | 1223 | $1,595 | $1.30 | 25d | 1 | 0.51mi |
| 4104 W 15th St Little Rock, AR | 4.0 | 2.0 | 1223 | $1,595 | $1.30 | 46d | 1 | 0.60mi |
| 2305 S Oak St Little Rock, AR | 4.0 | 2.0 | 1223 | $1,525 | $1.25 | 46d | 1 | 0.62mi |
| 2421 S Oak St Little Rock, AR | 3.0 | 1.0 | 1092 | $950 | $0.87 | 23d | 1 | 0.70mi |
| 4314 W 14th St Little Rock, AR | 4.0 | 2.0 | 1223 | $1,495 | $1.22 | 25d | 1 | 0.76mi |
| 3615 W Capitol Ave Little Rock, AR | 4.0 | 2.0 | 1410 | $1,550 | $1.10 | 25d | 1 | 0.77mi |
| 2200 Dennison St Little Rock, AR | 3.0 | 1.5 | 1080 | $1,000 | $0.93 | 46d | 1 | 0.77mi |
| 1515 Wolfe St Little Rock, AR | 3.0 | 2.0 | 1386 | $1,100 | $0.79 | 25d | 1 | 0.93mi |
| 1320 Adams St Little Rock, AR | 3.0 | 1.0 | 1026 | $1,025 | $1.00 | 46d | 1 | 0.94mi |
| 212 Rice St Little Rock, AR | 3.0 | 2.0 | 1442 | $1,795 | $1.24 | 21d | 1 | 0.97mi |
| 2701 Abigail St Little Rock, AR | 3.0 | 1.0 | 1098 | $1,195 | $1.09 | 25d | 1 | 1.00mi |
| 1720 Pinewood Dr Little Rock, AR | 3.0 | 2.0 | 1382 | $1,180 | $0.85 | 46d | 1 | 1.04mi |
| 4721 W 16th St Little Rock, AR | 4.0 | 1.0 | 1100 | $1,195 | $1.09 | 25d | 1 | 1.04mi |
| 324 S Schiller St Little Rock, AR | 3.0 | 2.0 | 1352 | $1,995 | $1.48 | 25d | 1 | 1.07mi |
| 306 S Schiller St Little Rock, AR | 3.0 | 2.0 | 1037 | $1,795 | $1.73 | 46d | 1 | 1.08mi |
| 1903 Marshall St Little Rock, AR | 3.0 | 2.0 | 1152 | $1,200 | $1.04 | 25d | 1 | 1.08mi |
| 1914 S Van Buren St Little Rock, AR | 3.0 | 1.5 | 1318 | $995 | $0.75 | 25d | 1 | 1.32mi |
| 322 Rose St Little Rock, AR | 3.0 | 2.0 | 1200 | $1,850 | $1.54 | 16d | 1 | 1.36mi |
| 1209 W 22nd St Little Rock, AR | 4.0 | 2.0 | 1104 | $1,850 | $1.68 | 46d | 1 | 1.37mi |
| 119 N Monroe St Little Rock, AR | 3.0 | 2.0 | 1490 | $1,850 | $1.24 | 46d | 1 | 1.49mi |
Listing history 49 events
-
2026-06-21days on market $103,000 Active 359 DOM
-
2026-06-18days on market $103,000 Active 356 DOM
-
2026-06-17days on market $103,000 Active 355 DOM
-
2026-06-16days on market $103,000 Active 354 DOM
-
2026-06-15days on market $103,000 Active 353 DOM
-
2026-06-14days on market $103,000 Active 351 DOM
-
2026-06-13days on market $103,000 Active 350 DOM
-
2026-06-10days on market $103,000 Active 348 DOM
-
2026-06-09days on market $103,000 Active 347 DOM
-
2026-06-08days on market $103,000 Active 346 DOM
-
2026-06-05days on market $103,000 Active 342 DOM
-
2026-06-03days on market $103,000 Active 341 DOM
-
2026-06-02days on market $103,000 Active 340 DOM
-
2026-06-01days on market $103,000 Active 339 DOM
-
2026-05-31days on market $103,000 Active 338 DOM
-
2026-05-31days on market $103,000 Active 337 DOM
-
2025-10-13historical $1,150
-
2025-09-30price $103,000 287-char remark
Show marketing remark (287 chars)
Affordable 4-bedroom Gem! This older home offers plenty of space and charm at a budget-friendly price. With 4 bedrooms and solid bones, it's perfect for first time buyers, families, or investors looking for a smart opportunity. Great potential and close to the freeway -- don't miss out!
-
2025-09-10price $1,150
-
2025-08-27price $108,000 287-char remark
Show marketing remark (287 chars)
Affordable 4-bedroom Gem! This older home offers plenty of space and charm at a budget-friendly price. With 4 bedrooms and solid bones, it's perfect for first time buyers, families, or investors looking for a smart opportunity. Great potential and close to the freeway -- don't miss out!
-
2025-08-12$1,195
-
2025-07-31historical $1,195
-
2025-06-28price $1,195
-
2025-06-26$110,000 New Listing 287-char remark
Show marketing remark (287 chars)
Affordable 4-bedroom Gem! This older home offers plenty of space and charm at a budget-friendly price. With 4 bedrooms and solid bones, it's perfect for first time buyers, families, or investors looking for a smart opportunity. Great potential and close to the freeway -- don't miss out!
-
2025-06-26historical
Show marketing remark (287 chars)
Affordable 4-bedroom Gem! This older home offers plenty of space and charm at a budget-friendly price. With 4 bedrooms and solid bones, it's perfect for first time buyers, families, or investors looking for a smart opportunity. Great potential and close to the freeway -- don't miss out!
-
2025-05-30$1,250
-
2025-05-29$110,000 New Listing
-
2025-05-28historical
-
2025-04-22price $110,000
-
2025-03-23price $115,000
-
2025-03-07historical $1,250
-
2025-03-06$120,000 New Listing
-
2025-02-28price $1,250
-
2025-02-06$1,350
-
2024-09-27historical $1,250
-
2024-08-20$1,250
-
2023-10-20historical $1,250
-
2023-10-01$1,250
-
2023-08-18soldstatus $102,500
-
2023-08-10soldstatus $102,500 Sold
-
2023-07-21status Under Contract
-
2023-06-28historical Take Backups
-
2023-05-04$104,500 New Listing
-
2021-03-02soldstatus $82,000
-
2021-02-19soldstatus $82,000 Sold
-
2021-01-26historical
-
2020-10-07historical
-
2020-10-07$89,000
-
2020-09-29soldstatus $23,000
ⓘ Source: listings_history table (triggers on properties + properties_extension) + one-shot
backfill from property_details.listing_events for pre-trigger history.
Tax reassessment forecast AR · Resets to sale price
- Current annual tax
- $980 · $82/mo
- Projected year-2 tax
- $980 · $82/mo
- Expected delta
- $0/yr ($0/mo · 0.0%)
ⓘ Screening estimate from a state-policy table — verify with the county assessor before closing.
Climate risk First Street
- Flood 6/10 Major FEMA zone X (unshaded) · 95% chance over 30 yrs
- Wildfire 2/10 Low
- Heat 7/10 Severe 7 d/yr ≥110°F today · 18 d/yr by 30 yrs out
- Wind 4/10 Moderate 10% chance of damaging wind over 30 yrs
- Air quality 2/10 Low 1 unhealthy d/yr today · 1 by 30 yrs out
Nearby sold comps map
Loading sold comps map…
Walkable amenities ~0.75 mi
Loading nearby amenities…
Taxation est. · year 1
- Rental income
- $16,745
- − Mortgage interest
- −$5,770
- − Property taxes
- −$980
- − Insurance
- −$515
- − Repairs & maintenance
- −$1,340
- − Management
- −$1,340
- − Depreciation
- −$2,996
- Taxable income
- $3,804
- Est. tax owed @ 24.0%
- −$913
- After-tax cash flow
- $4,338/yr
For passive investors: Depreciation is non-cash, so a rental often shows a tax loss while cash-flowing — sheltering income. Rental losses are passive: they offset passive income freely, and up to $25,000/yr can offset ordinary (W-2) income if you actively participate and your MAGI is under $100k (phasing out to $0 by $150k); unused losses carry forward. On sale, claimed depreciation is recaptured at up to 25%, and gains may owe capital-gains tax (a 1031 exchange can defer both). Figures are a year-1 estimate at your 24.0% rate — not tax advice; consult a CPA.
Schools (NCES district)
- District
- Little Rock School District
- NCES district ID
- 0509000
- Math proficiency
- 23% ▼ -12.00%
- Reading proficiency
- 26% ▼ -8.00%
- Median HH income
- $43,346
- Composite
- 21.0/100
- National rank
- #8457
- State rank
- #183 of 238 in AR
Livability — Little Rock
- Score
- 73/100
- State rank
- #22
- US rank
- #5295
Category grades
Schools grade is shown separately in the Schools card above.
Census & demographics
- Census place
- Little Rock, AR
- County
- Pulaski County · 372,764 people
- City population
- 218,896
- Metro
- Little Rock-North Little Rock-Conway, AR
- Population (ZIP)
- 30,525
- Household income
- $40,882
- Rent vs Own
- Severe rent burden
- 1553.0
Population outlook (Pulaski County) Hauer SSP2
- Today (2025)
- 415,378 people
- By 2030
- 423,720 · +2.0%
- By 2040
- 435,182 · +4.8%
- By 2050
- 440,904 · +6.1%
- By 2075
- 445,521 · +7.3%
- By 2100
- 419,173 · +0.9%
Race, ethnicity, and origin ACS 2023
- Neighborhood character
- Predominantly Black (66%)
- Race & ethnicity
- Black 66% White 18% Hispanic / Latino 12% Two or more races 6%
- Hispanic origin (detail)
- Mexican 9%
- Common ancestry
- Slovak 1%
- Foreign-born
- 7% · Canada, Vietnam
- Languages at home
- 89% English-only · Spanish 9% Vietnamese 1%
Political lean MEDSL · Pulaski
- 2024 margin
- Strong D (+22.1) · D 59.8% · R 37.7% · Other 2.5%
- 2008→2024 swing
- +10.6pp toward D · 2008: 11.6pp · 2024: 22.1pp
- All cycles
- 2024: D+22.1 2020: D+22.5 2016: D+17.9 2012: D+11.4 2008: D+11.6
Not yet ingested
- Civics
- —
Market trends
- HPI YoY
- ▼ -47.17%
- Current HPI
- 172.3977
- Rent YoY
- ▲ 4.91%
- Metro
- Little Rock-North Little Rock-Conway, AR
- State GDP YoY
- ▲ 3.80%
- F500 in state
- 10
Industry mix (Fortune 500 HQ in AR)
| Industry | F500 HQs | Revenue |
|---|---|---|
| Retail | 1 | $681B |
|
||
| Food / Agriculture | 1 | $53B |
|
||
| Retail / Energy | 1 | $22B |
|
||
| Transportation / Logistics | 1 | $12B |
|
||
| Energy | 1 | $4B |
|
||
Price history
-95.0% since first listed33 events — show timeline
- 2025-10-13 Rental Removed $1,150 Avail
- 2025-09-30 Price Changed $103,000 CARMLS
- 2025-09-10 Price Changed $1,150 Avail
- 2025-08-27 Price Changed $108,000 CARMLS
- 2025-08-12 Listed for Rent $1,195 Avail
- 2025-07-31 Rental Removed $1,195 Avail
- 2025-06-28 Price Changed $1,195 Avail
- 2025-06-26 Listing Removed — CARMLS
- 2025-06-26 Listed $110,000 CARMLS
- 2025-05-30 Listed for Rent $1,250 Avail
- 2025-05-29 Listed $110,000 CARMLS
- 2025-05-28 Listing Removed — CARMLS
- 2025-04-22 Price Changed $110,000 CARMLS
- 2025-03-23 Price Changed $115,000 CARMLS
- 2025-03-07 Rental Removed $1,250 Avail
- 2025-03-06 Listed $120,000 CARMLS
- 2025-02-28 Price Changed $1,250 Avail
- 2025-02-06 Listed for Rent $1,350 Avail
- 2024-09-27 Rental Removed $1,250 Avail
- 2024-08-20 Listed for Rent $1,250 Avail
- 2023-10-20 Rental Removed $1,250 Avail
- 2023-10-01 Listed for Rent $1,250 Avail
- 2023-08-18 Sold (Public Records) $102,500 Public Records
- 2023-08-10 Sold (MLS) $102,500 CARMLS
- 2023-07-21 Pending — CARMLS
- 2023-06-28 Contingent — CARMLS
- 2023-05-04 Listed $104,500 CARMLS
- 2021-03-02 Sold (Public Records) $82,000 Public Records
- 2021-02-19 Sold (MLS) $82,000 CARMLS
- 2021-01-26 Listing Removed — CARMLS
- 2020-10-07 Listed $89,000 CARMLS
- 2020-10-07 Listing Removed — CARMLS
- 2020-09-29 Sold (Public Records) $23,000 Public Records
Property tax history
+9.7%/yrLatest (2025): $980 · +0.0% YoY. Source: county tax records.
Cash-flow waterfall
monthlySold comps — $/sqft
last 12 mo · ≤1 miLoading sold comps…