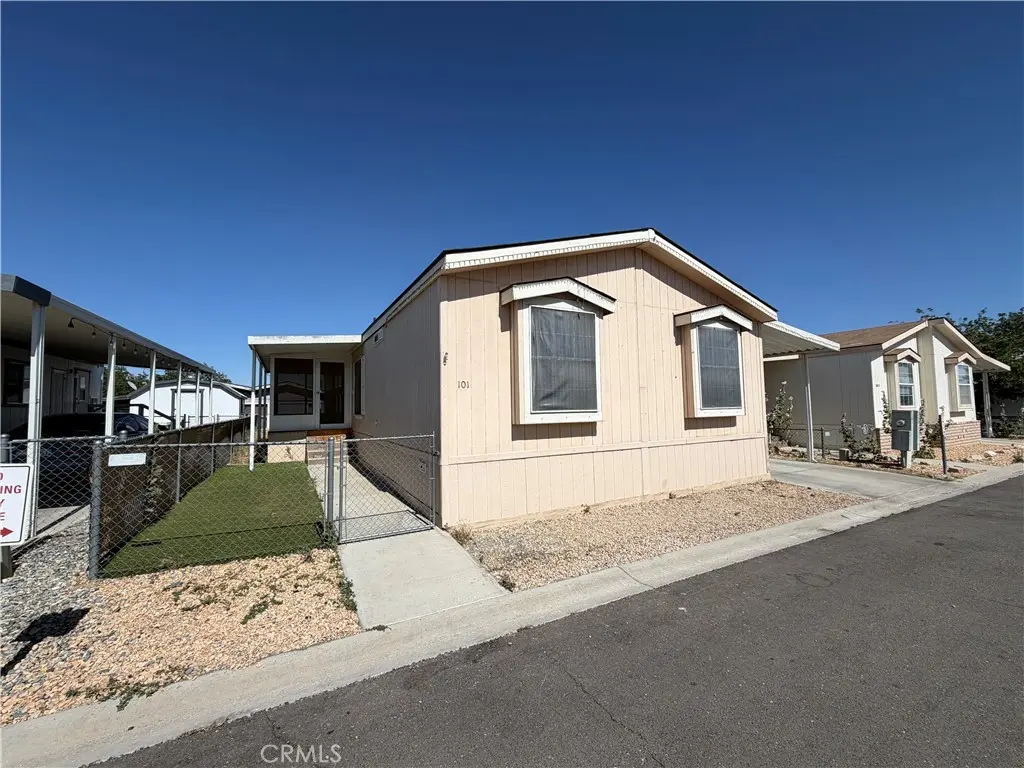
20843 Waalew Unit C101 · Apple Valley, CA
Flood risk 1/10 · Minimal
- FEMA flood zone
- X (unshaded)
- Chance of flooding over 30 yrs
- 0.0%
- Est. flood insurance / yr
- $507 – $1,088
Fire risk 6/10 · Moderate
- Est. fire insurance / yr
- $659 – $1,223
Heat risk 7/10 · Major
- Hot days now (above 100°F)
- 4 days/yr
- Hot days in 30 yrs
- 10 days/yr
Wind risk 1/10 · Minimal
- Chance of severe wind over 30 yrs
- —
Air-quality risk 9/10 · Severe
- Unhealthy air days now
- 21 days/yr
- Unhealthy air days in 30 yrs
- 26 days/yr
Risk factors via First Street. Map © Google.
Why this score? — see what drove the B- grade
The composite is a weighted blend of 9 inputs, each scored 0–100. Each bar is that input's sub-score; the figure is the points it added to the 100-point composite (weight × sub-score).
- Cash flow +30.0/30.0
- 1% rule +10.0/10.0
- DSCR +10.0/10.0
- ARV discount +6.0/15.0
- Rent growth +3.9/5.0
- Schools +3.1/10.0
- Livability +3.1/5.0
- Condition / age +2.5/5.0
- Appreciation +0.0/10.0
$114,500
🖨 Deal sheet 📄 Offer letter ✓ Due diligence
Listing remarks MLS
This newer 2005 Champion home, with 1440 square feet of living space, has three bedrooms and 2 baths with a split floor plan and a family room with fireplace and custom tall windows. Roomy kitchen with formica counters and tile backsplash. REAL oak cabinets! Formal dining area has corner hutch. Indoor laundry room with back door leading to covered 2 car carport. Spacious Master suite with walk-in closet and the master bath features a large garden tub and a separate shower, double sink and pullman and linen cabinet. The other 2 bedrooms and bath are just off the family room. The second bath has a single pullman and tub shower combo. Large 7'x17' front deck that is all screened in. Dual glazed windows and central air and heat. Also, there is a 7'x10' wooden storage shed at rear of driveway. The rear yard has artificial turf and rockscape for easy maintenance. This home is located in a nice family park and is one block from the pool and clubhouse. Come and see! # of RV Spaces: 0 Special Features: Cable TV, Storage ShedFRON, REAR Lot Location Type: Standard Location FireplaceFeatures: Family Room Pool Features: Common Pool Spa Features: Common Spa Zoning: Residential 1 # of Attached Spaces: 0 # of Detached Spaces: 0 # of RV Spaces: 0
Key facts
- Fitness center
- Swimming pool
- Peaceful pond
Tags
Property features AI
Finance
- Other: Manager approval required for residency; Pets: contact manager
- Financial info: Land lease of $997.97 per month (park land lease); Rent includes trash and sewer
Exterior
- Parking: Located in Los Ranchos park
- Utilities: Public sewer; District/public water
- Home design: Single-story; Mobile home remains; Estimated year built
- Construction: Parcel number 0441011596101
- Exterior features: Community pool; Neighborhood amenities: fishing, park, street lighting; Lot zoning roughly 0–1 unit per acre
Interior
- Kitchen: Microwave; Refrigerator; Gas range; Dishwasher; Gas water heater
- Bathrooms: 2 full bathrooms
- Heating & cooling: Central air conditioning; Central furnace heating
- Interior features: One-level entry; Side entry; Open kitchen to family room; Granite counters; Has view
- Laundry & utility: Laundry inside; Laundry in closet
Neighborhood map
What this means for you Summary
Snapshot
- This is a 3-bed/2.0-bath manufactured listed at $114k.
Deal economics
- At list price, monthly cash flow is $851 ($10k/yr) — positive.
- The deal already cash-flows at list — no discount required.
- Meets the 1% rule at list price ($2k rent vs $114k).
- Cap rate 15.2% vs local median 3.5% in Apple Valley — top-decile yield for the area; either an underpriced asset or a hidden risk that comps aren't pricing in. Stress-test before assuming the spread holds.
Location & tenants
- Location reads 61/100 on livability (#532 in CA) — a middle-class / working-renter tenant base. Strengths: housing A+, commute B+; Watch: employment D+, schools F, crime D-.
- Apple Valley Unified (suburban): math 25% / reading 40% proficiency, ranked #955 of 1,400 in CA (top 68%) — families likely to look elsewhere, expect single-tenant / working-renter base with shorter leases; 60% free/reduced lunch — lower-income household profile, screen leases tightly.
- Market conditions: Rents rising fast (+5.5%/yr); 526 active listings in the ZIP; 6 comparable units currently listed for rent nearby; rentals at typical pace (median 25d on market — plan ~3-4 weeks tenant-placement turnaround); solid renter incomes; 5,458 units permitted in San Bernardino County in 2024 (1,500 in 5+ unit buildings).
- This rent runs 31% of the median local income ($77k/yr) — at the standard rent-burdened threshold; future hikes will face affordability resistance.
Forward outlook
- Local home prices are declining (-3.0%/yr); year-one equity from $792 of loan paydown is wiped out by about $3k of value loss. Plan a longer hold.
- San Bernardino County population projected at +15% by 2050 — modest demand growth; plan on rents tracking national, not racing it.
- At projected returns (-3.0% appreciation + 5.5% rent growth), your $32k cash investment doubles in ~4 years — after that, you're playing with house money.
Negotiation context
- Only 7 days on market — expect competitive offers; lowballing is unlikely to land.
- 2 sale attempts since 10y ago with the ask held roughly flat each time — persistent listings suggest the price (not the market) is what's stuck; bring a comps-based counter.
- Current owner paid $45k; list at $114k implies a 154% gain — meaningful room to come down on a strong offer.
Risks & watch-outs
- Climate carrying-cost: major wildfire risk; extreme-heat days projected 4→10/yr by 2055 (HVAC capex compounding) — expect insurance premiums to compound above CPI over the hold.
Questions for the listing agent
- Is there a deadline driving the sale (1031 exchange, divorce, estate, relocation)? That informs how much negotiation room exists.
- Schools are F-rated, which usually means shorter tenancies and higher turnover. Who's the typical renter profile here, and what's been the actual vacancy rate?
- Crime grade is D in this area — have there been break-ins, vandalism, or insurance claims at this property in the last 3 years? What carrier currently insures it and at what premium?
- What's the average days-on-market for RENTAL listings here right now (not sales)? A rising rental-DOM trend means longer vacancies and softer asking-rent achievability than the comps imply.
- What's the recent tenant-quality profile in this submarket — average credit score on applications, eviction rate, late-payment / NSF rate, and stable-employment percentage? A property-management company in the area should have these aggregated.
- How much new for-sale + rental construction is in the pipeline within 1–3 miles? Heavy new supply typically softens prices + rents 12–24 months out; constrained supply supports both.
Investment metrics
- 1% rule
- 1.71% ✓
- Cap rate
- 15.22%
- Cash-on-cash
- 31.86%
- DSCR
- 2.42
- GRM
- 4.9
CMA / ARV
- ARV (on-the-fly)
- $110,880
- Comps found
- 12
Show comp detail 12 sales within ~0.75 mi
| Address | Dist | Beds/Ba | Sqft | Sold | Price | $/sf | Match |
|---|---|---|---|---|---|---|---|
| 20843 Waalew Rd Unit C83 | 0.00mi | 3/2.0 | 1,512 (+5%) | 3mo | $92,000 | $61 | 90 |
| 20843 WAALEW Rd Unit C48 | 0.09mi | 3/2.0 | 1,512 (+5%) | 4mo | $135,000 | $89 | 84 |
| 20843 Waalew Rd Unit C80 | 0.00mi | 3/2.0 | 1,512 (+5%) | 9mo | $140,000 | $93 | 84 |
| 20843 Waalew Rd Unit C116 | 0.00mi | 3/2.0 | 1,529 (+6%) | 9mo | $160,000 | $105 | 82 |
| 20843 Waalew Rd #C136 | 0.00mi | 3/2.0 | 1,593 (+11%) | 1mo | $110,710 | $69 | 81 |
| 20843 Waalew Rd Unit C60 | 0.00mi | 3/2.0 | 1,549 (+8%) | 9mo | $120,000 | $77 | 80 |
| 20843 Waalew Rd Unit C44 | 0.00mi | 3/2.0 | 1,296 (-10%) | 8mo | $95,000 | $73 | 77 |
| 20683 Waalew SPC B54 Rd Unit B54 | 0.35mi | 3/2.0 | 1,440 (0%) | 9mo | $130,600 | $91 | 76 |
| 20683 Waalew Rd Unit B2 | 0.26mi | 2/2.0 (-1) | 1,488 (+3%) | 9mo | $65,000 | $44 | 70 |
| 20683 Waalew Rd Unit B169 | 0.35mi | 2/2.0 (-1) | 1,520 (+6%) | 0mo | $108,000 | $71 | 69 |
| 20683 Waalew Rd Unit B4 | 0.35mi | 3/2.0 | 1,608 (+12%) | 10mo | $67,500 | $42 | 56 |
| 20683 Waalew Rd Unit B51 | 0.35mi | 2/2.0 (-1) | 1,248 (-13%) | 11mo | $125,000 | $100 | 47 |
Match score weights: distance 35% · size 25% · config 20% · recency 20%. Top-matched comps best support the ARV.
Projected returns pro-forma
-3.0% appreciation · 5.48% rent growth · sell at horizon
- IRR
- 29.4%
- Equity multiple
- 2.27×
- Total profit
- $40,661
- Equity at exit
- $17,072
- IRR
- 38.1%
- Equity multiple
- 4.95×
- Total profit
- $126,793
- Equity at exit
- $9,900
Cash invested: $32,060 (down + closing). Projections, not guarantees.
Landlord ↔ Tenant lean methodology
- Overall (STATE)
- 18 Strongly Tenant-Friendly
- State California
- 18 Strongly Tenant-Friendly · D+13
- County
- — inherits STATE
- City
- — inherits STATE
ZIP-level market 92307
- Rents YoY
- 5.5%
- Active inventory
- 526
- Price-to-rent
- 4.9×
Monthly cashflow live
- Estimated rent
- $1,963 high interval (Pro) →
- Mortgage (P&I)
- −$600
- Tax from tax record
- −$52 /mo · $620/yr
- Insurance
- −$48
- HOA
- −$0
- Vacancy / Maint / Mgmt
- −$412
- Net cashflow
- $851
Break-even live
UW: 25.0% down · 7.5% · 30yr · 1.5% tax · 5.0% vac · 8.0% maint · 8.0% mgmt
Financing live
Cash to close
- Down payment
- $28,625
- Closing costs
- $3,435
- Reserves months
- —
- Total cash needed
- —
Loan-product check · same deal, 3 products live
Conventional
25% down · 7.5% · 30yr
- Down + closing
- —
- Monthly P&I
- —
- Monthly cashflow
- —
- DSCR
- —
- Eligible?
- —
Personal DTI + credit; lowest rate.
DSCR
20% down · 8.5% · 30yr
- Down + closing
- —
- Monthly P&I
- —
- Monthly cashflow
- —
- DSCR
- —
- Eligible?
- —
No personal income docs; deal must DSCR.
Hard money
10% down · 12.0% · 12mo
- Down + closing
- —
- Monthly P&I
- —
- Monthly cashflow
- —
- DSCR
- —
- Eligible?
- —
Short-term bridge; refi at stabilization.
Rent comps 6 comps
| Address | Beds | Baths | Sqft | Rent | $/sqft | DOM | Units | Dist |
|---|---|---|---|---|---|---|---|---|
| 21225 Wigwam Rd Unit 2 Apple Valley, CA | 2.0 | 1.0 | 934 | $1,200 | $1.28 | 44d | 1 | 0.64mi |
| 15866 Sago Rd Apple Valley, CA | 2.0 | 2.0 | 996 | $1,750 | $1.76 | 24d | 1 | 1.16mi |
| 16100 Navajo Rd Unit 1 Apple Valley, CA | 4.0 | 2.5 | 1600 | $2,450 | $1.53 | 24d | 1 | 1.24mi |
| 16100 Navajo Rd Apple Valley, CA | 4.0 | 2.5 | 1600 | $7,900 | $4.94 | 18d | 1 | 1.24mi |
| 20414 Zuni Rd Unit 1 Apple Valley, CA | 3.0 | 2.0 | 1250 | $1,700 | $1.36 | 44d | 1 | 1.33mi |
| 15728 Sago Rd Unit 1 Apple Valley, CA | 2.0 | 2.0 | 950 | $1,600 | $1.68 | 24d | 1 | 1.37mi |
Listing history 7 events
-
2026-06-18days on market $114,500 Active 7 DOM
-
2026-06-17days on market $114,500 Active 6 DOM
-
2026-06-16days on market $114,500 Active 5 DOM
-
2026-06-15days on market $114,500 Active 4 DOM
-
2026-06-13days on market $114,500 Active 2 DOM
-
2026-06-13remarks 699-char remark
-
2026-06-13$114,500 Active 1 DOM
ⓘ Source: listings_history table (triggers on properties + properties_extension) + one-shot
backfill from property_details.listing_events for pre-trigger history.
Tax reassessment forecast CA · Resets to sale price
- Current annual tax
- $620 · $52/mo
- Projected year-2 tax
- $870 · $73/mo
- Expected delta
- +$251/yr (+$21/mo · 40.4%)
ⓘ Screening estimate from a state-policy table — verify with the county assessor before closing.
Climate risk First Street
- Flood 1/10 Low FEMA zone X (unshaded) · 0% chance over 30 yrs
- Wildfire 6/10 Major
- Heat 7/10 Severe 4 d/yr ≥100°F today · 10 d/yr by 30 yrs out
- Wind 1/10 Low
- Air quality 9/10 Extreme 21 unhealthy d/yr today · 26 by 30 yrs out
Nearby sold comps map
Loading sold comps map…
Walkable amenities ~0.75 mi
Loading nearby amenities…
Taxation est. · year 1
- Rental income
- $23,561
- − Mortgage interest
- −$6,414
- − Property taxes
- −$620
- − Insurance
- −$572
- − Repairs & maintenance
- −$1,885
- − Management
- −$1,885
- − Depreciation
- −$3,331
- Taxable income
- $8,855
- Est. tax owed @ 24.0%
- −$2,125
- After-tax cash flow
- $8,091/yr
For passive investors: Depreciation is non-cash, so a rental often shows a tax loss while cash-flowing — sheltering income. Rental losses are passive: they offset passive income freely, and up to $25,000/yr can offset ordinary (W-2) income if you actively participate and your MAGI is under $100k (phasing out to $0 by $150k); unused losses carry forward. On sale, claimed depreciation is recaptured at up to 25%, and gains may owe capital-gains tax (a 1031 exchange can defer both). Figures are a year-1 estimate at your 24.0% rate — not tax advice; consult a CPA.
Schools (NCES district)
- District
- Apple Valley Unified
- NCES district ID
- 0600017
- Math proficiency
- 25% ▬ 0.00%
- Reading proficiency
- 40% ▬ 0.00%
- Median HH income
- $49,264
- Composite
- 30.91/100
- National rank
- #11351
- State rank
- #955 of 1400 in CA
Livability — Apple Valley
- Score
- 61/100
- State rank
- #532
- US rank
- #17800
Category grades
Schools grade is shown separately in the Schools card above.
Census & demographics
- Census place
- Apple Valley, CA
- County
- San Bernardino County · 2,030,291 people
- City population
- 83,889
- Metro
- Riverside-San Bernardino-Ontario, CA
- Population (ZIP)
- 41,180
- Household income
- $77,106
- Rent vs Own
- Severe rent burden
- 1069.0
Population outlook (San Bernardino County) Hauer SSP2
- Today (2025)
- 2,300,329 people
- By 2030
- 2,378,907 · +3.4%
- By 2040
- 2,523,137 · +9.7%
- By 2050
- 2,642,388 · +14.9%
- By 2075
- 2,880,769 · +25.2%
- By 2100
- 2,909,436 · +26.5%
Race, ethnicity, and origin ACS 2023
- Neighborhood character
- Diverse neighborhood (Simpson 0.63)
- Race & ethnicity
- White 47% Hispanic / Latino 38% Two or more races 22% Black 5% Asian 3% Native American 2%
- Hispanic origin (detail)
- Mexican 34% Puerto Rican 1%
- Common ancestry
- Lithuanian 3% Italian 3% Slovak 2%
- Foreign-born
- 10% · Canada, China
- Languages at home
- 75% English-only · Spanish 20% Arabic 1% Other Indo-European 1%
Political lean MEDSL · San Bernardino
- 2024 margin
- Toss-up / Even · D 47.5% · R 49.7% · Other 2.8%
- 2008→2024 swing
- -8.5pp toward R · 2008: 6.3pp · 2024: -2.1pp
- All cycles
- 2024: R+2.1 2020: D+10.7 2016: D+9.8 2012: D+5.4 2008: D+6.3
Not yet ingested
- Civics
- —
Market trends
- HPI YoY
- ▼ -262.21%
- Current HPI
- 347.8498
- Rent YoY
- ▲ 5.48%
- Metro
- Riverside-San Bernardino-Ontario, CA
- State GDP YoY
- ▲ 3.21%
- F500 in state
- 116
Industry mix (Fortune 500 HQ in CA)
| Industry | F500 HQs | Revenue |
|---|---|---|
| Technology | 27 | $1,492B |
|
||
| Financial Services | 3 | $174B |
|
||
| Retail | 3 | $44B |
|
||
| Insurance | 3 | $26B |
|
||
| Media / Entertainment | 2 | $115B |
|
||
| Pharmaceuticals / Biotech | 2 | $62B |
|
||
Price history
+149.5% since first listed3 events — show timeline
- 2026-06-11 Listed $114,500 CRMLS
- 2016-07-20 Sold (MLS) $45,000 CRMLS
- 2016-03-16 Listed $45,900 CRMLS
Property tax history
-2.3%/yrLatest (2025): $620 · -39.5% YoY. Source: county tax records.
Cash-flow waterfall
monthlySold comps — $/sqft
last 12 mo · ≤1 miLoading sold comps…